All published articles of this journal are available on ScienceDirect.

Computer Vision Syndrome Prevalence and Ocular Sequelae among Medical Students: A University-Wide Study on a Marginalized Visual Security Issue
Authors Info & Affiliations
Abstract
Introduction:
This study aimed to discover and document the potential of visual and ocular sequelae of computer vision syndrome (CVS) among medical students.
Methods:
This cross-sectional case-control study was conducted on medical students (n=4030) of five universities in Egypt. All students completed a specially designed and validated CVS questionnaire survey (CVS-F3). Students with ≥5 CVS symptoms constituted a risk group (n=352), while students with 1-4 CVS symptoms constituted a low-symptoms group (n=3067). Students from the control and risk groups were examined using objective methods, such as visual acuity, subjective refraction, dry eye disease tests, and anterior segment and fundus examinations. Students who complained of visual blur underwent multifocal electroretinography mfERG examinations (mfERG group).
Results:
The CVS-F3 indicated that 84.8% of students had complaints that might be related to CVS, however, our ophthalmic examination group revealed only a 56% CVS prevalence rate. The most common single screen type used by 70.4% of students was the smartphone, and the most common complaint was headache (50.2%). Multivariate logistic regression analysis revealed that CVS was significantly associated with increased screen-hours, including >2 screen-hours daily (odds ratio [OR], 2.48; P<0.0001), >2 screen-hours at night (OR, 1.79; P=0.003), and ≥3 screen-years (OR, 1.69; P=0.006). In the mfERG group, 37% demonstrated reduced amplitudes of mfERG rings and quadrants, indicating reduced foveal responses.
Conclusion:
CVS-questionnaires overestimate the true CVS prevalence and sequelae, which could be accurately detected by objective ophthalmic examination. Smartphones primarily caused CVS among students, with CVS severity increasing in correlation with shorter eye-to-screen distance and frequent use. Contact lens wearing doubled the risk of CVS development and augmented its severity. CVS might affect macular integrity with screen-induced foveal dysfunction.
Clinical Trials Registration:
PACTR201811618954630.
1. INTRODUCTION
Modern digital technology has spread worldwide, thus, unfortunately markedly influencing the daily activities and life-styles of people. Many studies have reported that digital technology users may spend up to 12 screen-hours daily [1, 2], and the American Optometric Association revealed that the average American individual spends an average of 7 hours a day on digital screens at work and/or home [3]. However, this technology and its ocular, visual, and public health hazards [4-8] also impact the users’ musculoskeletal system and their circadian rhythms and sleep patterns [1-10].
Computer Vision Syndrome (CVS) is a mixture of visual ocular and extraocular manifestations that affect digital screen users [3]. Visual symptoms involve blurred vision with an underlying mechanism that is not fully understood [10], visual fatigue or discomfort [11-14], and diplopia [3, 4]. Ocular symptoms include Dry Eye Disease (DED) [3, 15], eye strain [16], redness, and irritation. Extraocular symptoms include headache, neck, shoulder, and back pain [2-17] and trigger thumb or wrist tendonitis or arthritis [18-20].
Since the last decade, smartphones have become a universal hand-held digital screen, and are used extensively worldwide by people of all ages [21-23]. Nevertheless, owing to smartphones’ close-viewing distance [24], related good resolution [14], entertainment and social applications, and 24 availability and internet connectivity [2, 22], smartphones are believed to be responsible for the sudden rise in CVS prevalence and related sequelae worldwide by users of all ages, including the children [25]. CVS prevalence differs among studies [4, 9, 12, 26, 27], ranging from 7% to more than 90% in different countries, institutions, and web surveys [23, 28]. However, the type of work, study, and screen and visual display, along with prolonged screen-hours, inappropriate eye-to-screen distance, eye-screen direction misalignment, excessive screen brightness, and pre-existing eye diseases are the main factors responsible for this wide range in CVS prevalence [4, 9, 11, 24]. Moreover, the accuracy of the reported CVS prevalence in such studies depends on the adequacy of sample size, risk of bias, study power, precise threshold chosen to define CVS (e.g. number of symptoms), and the validity of the instruments and questionnaires used [12, 29-43]. In addition, some studies [1, 7, 15, 35, 37] followed subjective and objective methods and used both CVS questionnaires and ophthalmic examinations of the study participants.
Munshi et al. [10] suggested that smartphones are responsible for the emergence of relatively new unexplained visual performance defects and concluded that CVS-associated visual blur has an underlying mechanism that is not fully understood. Meanwhile, Ali et al. [44] reported visual sensitivity reduction following smartphone use in the dark. Furthermore, Lawrenson et al. [26] investigated the visual and macular functions affections by CVS and if the blue-light blocking lenses can provide protection against potential retinal phototoxicity, however, they finally stated that they found no studies in the literature investigating macular functions. Therefore, based on our previous publication which proved that the CVS- related mfERG reduced foveal responses [45], we decided to further investigate the potential harmful sequelae of CVS on macular health and functions by performing mfERG examinations to confirm or deny such sequelae mainly the screen-induced foveal dysfunction.
Hence, in this study, we aimed to detect the actual CVS prevalence and discover the etiology of potential CVS-related visual sequelae among medical students using a questionnaire (CVS-F3) and an ophthalmic examination that included findings from multifocal electroretinograms (mfERGs).
2. METHODS
Our prospective study was conducted in the following five Egyptian universities: Sohag University (Sohag, Egypt), Minia University (Minia, Egypt), Alexandria University (Alexandria, Egypt), Ain Shams University (Cairo, Egypt), and Suez Canal University (Ismailia, Egypt). This study obtained the approval of the Institutional Review Board (IRB) of the Faculty of Medicine, Sohag University, Egypt. The trial registry number was obtained from the Pan African Clinical Trial Registry (registry number: PACTR201811618954630). This study was conducted in accordance with the tenets of the Declaration of Helsinki. Our study protocol included subjective information (i.e., the CVS questionnaire) and an objective ophthalmic examination of medical students. Prior to study enrolment, informed consent was obtained from students after explaining the nature and possible consequences of the study.
2.1. Subjective Self-Assessment Evaluation
2.1.1. Computer Vision Syndrome–Form 1 and 3 Questionnaires
In 2018, we published [32] our first pilot survey included 100 medical students (50 men and 50 women at a 1:1 ratio). The CVS-F1 outcomes revealed that CVS prevalence was 86% in this sample. Additionally, dry eye, headache, and blurred vision were the most common complaints.
In the present study, CVS-F3 was the modification of CVS-F1 and included 28 questions to accurately determine the screen target and associated risk factors with severe forms of CVS (Supplementary material S1). In 2021, our first article, including CVS-F3, was published [45]. The Cronbach’s alpha reliability coefficient is .702 and .742 for CVS-F1 and CVS-F3, respectively.
2.2. Sample Size
Using an alpha level of 0.01 and the survey sample size determination table created by Bartlett et al. [46], we determined that the minimum sample size required for this study was 623 participants.
Our study included 4030 medical students from the five universities listed above. They were randomly assigned, using STATA version 14.2, to complete the CVS-F3 regardless of age or grade. The nature of the visual, ocular, and extraocular hazards of CVS was explained carefully to all students before they completed the CVS-F3 (S1 Supplementary material).
2.3. Grouping of Study Participants
To facilitate the statistical interpretation of our study, we classified the study participants as follows: the survey group included all surveyed medical students; this group was then subdivided into the control group (students with no CVS symptoms) and the CVS group (students with one or more CVS symptom). The CVS group was further subdivided into the low-symptoms group (1–4 CVS symptoms) and high-symptoms (risk) group (5–9 CVS symptoms i.e., severe CVS). Students in the risk group and an equal number of students from the control group underwent ophthalmologic examination and DED testing. The proportion of students from the control group who underwent ophthalmic examination was identified as the mini-control group. Lastly, the mfERG group included a sample of students from both the risk and mini-control groups, and these participants were subjected to the mfERG examination.
2.4. Ophthalmologic Examination
The students in the risk and mini-control groups (in a 1:1 ratio proportion at each university as the students of the mini-control group were randomly selected from the main control group) underwent a complete clinical ophthalmic assessment and evaluation at the Ophthalmology Examination Unit in the Department of Ophthalmology at their respective universities. All students underwent visual acuity examinations, which included uncorrected distance visual acuity (UDVA) measurement, Corrected Distance Visual Acuity (CDVA) measurement, intraocular pressure measurements, subjective and cycloplegic refractions, slit-lamp examination of the anterior segment, and dilated fundus examination. All examined students also underwent DED testing, which included the tear film break-up time test (TBUT) and the Schirmer test.
To minimize potential statistical bias, we used strict exclusion criteria for the ophthalmic group participants. Our exclusion criteria for the examined students were as follows: UDVA 1.00 logMAR or worse, CDVA 0.10 logMAR or worse, differences in CDVA between both eyes ≥0.20 logMAR, refractive sphere or cylinder exceeding ±4 D, differences between subjective and cycloplegic refractions >1 D, anisometropia >2 D, amblyopia, abnormalities in near vision, and current eye disease or surgery. All excluded students were not included in the study data analysis and if necessary, the excluded students might be referred to other ophthalmic units for further assessments and investigations. The remaining students were included in our statistical data analysis and identified as the ophthalmic examination group.
For the TBUT, a fluorescein strip (1 mg fluorescein sodium I.P.; Surgi Edge, Ahmedabad, Gujarat, India) was inserted into the lower fornix, and the students were instructed to blink several times. The student was then examined with a slit-lamp using the cobalt blue filter to detect black holes in the tear film. The TBUT result was considered abnormal if black areas appeared in less than 10 seconds. Meanwhile, the cornea was examined for clarity, opacities, or positively fluorescein-stained punctate epithelial erosion. For the Schirmer test, a Schirmer strip (Schirmer Ophthalmic Strip; Surgi Edge) was inserted into the lower fornix on a temporal site away from the cornea. The students were instructed to close their eyes gently for 5 minutes. The Schirmer test result was considered abnormal if the amount of wetting of the strip was less than 10 mm. The final CVS diagnosis was based on Iqbal’s 4 major criteria for CVS diagnosis [45].
2.5. mfERG Examination
Since the mfERG device (RETIscan; Roland Instruments, Wiesbaden, Germany) was only available at Minia University and the procedure was difficult and time-consuming, we decided to examine a random subsample of a limited number of students from the mini-control and risk groups at Minia University. The random sample of 90 eyes of 90 students (44 students from the mini-control group and 46 students risk group) was obtained by using STATA version 14.2.
Students in the mfERG group were examined with the RETIscan device in accordance with the standard protocol for mfERG of the International Society for Clinical Electrophysiology of Vision (ISCEV). In the mfERG analysis, the normal mfERG ranges were determined internal to the system. The mfERG stimulus used was 61 hexagons in dilated subjects with system age-matched norms and the protocol adhered to ISCEV standards. The aim of this type of examination was to detect any drawbacks or sequelae of CVS on retinal function.
2.6. Post-ophthalmologic and mfERG Examination
All of the students who were diagnosed with DED were instructed to take the necessary medication and attend follow-up visits at the Ophthalmology Examination Unit. We prescribed different types of topical and oral medications to the students based on the severity of their DED. The topical medications included Systane Ultra eye drops (Alcon Laboratories, Inc.) and GenTeal moisturizing eye gel (0.3% hypromellose and 0.22% carbomer 980; Novartis Pharmaceuticals, East Hanover, NJ, USA). Contact lens wearers with complaints were advised to stop wearing their contact lenses until their eyes become less symptomatic. However, students who presented with severe DED were advised to stop wearing contact lenses and to wear eyeglasses instead. General instructions and protective measures were explained to increase the students’ awareness of the hazards of CVS and how to protect themselves from its potential sequelae.
2.7. Statistical Analysis
We used Stata statistical software (version 14.2; StataCorp LP, College Station, TX, USA) for data analysis. The quantitative data were represented as mean, standard deviation, range, and median values. The qualitative data were represented as numbers and percentages. For comparison between categorical variables, we used the chi-square test for trends. In non-normally distributed data, we used the Mann–Whitney U test for comparison between two groups and the Kruskal–Wallis test for comparison between three or more groups. We used the binary logistic regression analysis to determine the factors that affected CVS occurrence and the linear regression analysis to determine the factors that influenced the number of CVS symptoms. A P value of <0.05 was considered statistically significant.
3. RESULTS
Our study included 4030 medical students (2334 females [57.9%] and 1696 males [42.1%]). The mean age of participants was 21.17±1.33 years, and the total survey group (n=4030) was subdivided into the control group (n=611; 15.2%) and the CVS group (n=3419; 84.8%). The CVS group was further subdivided into the low-symptoms group (n=3067, 76.1% of the total survey group) and high-symptoms (risk) group (n=352, 8.7% of the total survey group). The mini-control group included 352 students (8.7% of the total survey group) who were randomly selected from the main control group by using STATA version 14.2. Finally, 704 students from both the mini-control and risk groups were subjected to ophthalmic examination to diagnose CVS and constituted the ophthalmic examination group (n=704, 17.4% of the total survey group). The mfERG group emerged from the ophthalmic examination group and included 90 students (2.2% of the total survey group), 44 students from the mini-control group and 46 students from the risk group.
3.1. CVS-F3 Outcomes
CVS-F3 revealed that 84.8% of the surveyed medical students had complaints that might be related to CVS. We evaluated the factors that we considered to be the most important outcomes in this study.
All symptoms showed significant differences to be worse with prolonged screen-hours, except DED (P=0.76). Moreover, all symptoms became worse if more screen-hours were spent in the dark, except DED (P=0.11). Students exposed to high levels of brightness had higher complaints than those exposed to lower levels of illumination regarding blurred vision (P<0.0001), neck/shoulder pain (P<0.0001), DED, and headache, and diplopia (all P=0.02). All symptoms, except for eye fatigue (P=0.57), became worse with continuous screen-hours than in students who took breaks between screen hours. All symptoms, except for eye strain and redness (P=0.15 and P=0.31, respectively), were significantly increased in night screen users (31.2%) as compared to day screen users (68.8%).
Table 1 shows association analyses between symptoms and the most commonly used single screen type regarding percentages and numbers of students with complaints. It also revealed that the most common single screen used by students was a smartphone, 58.93% of students used Android smartphones, 6.4% of students used iOS smartphones (i.e., Apple iPhones), and 5.04% of students used other smartphone brands. The second most commonly used screen was the laptop with a total of 26.28% of users. CVS symptoms, such as blurred vision (P=0.04), eye strain (P<0.0001), eye redness (P=0.04), double vision (P<0.0001), and difficulty in refocusing the eyes (P=0.002), were significantly higher in students who used smartphones than in those who used laptops and desktop computers (Table 1).
The number of CVS symptoms, including blurred vision (P=0.003), neck pain (P=0.02), eye fatigue (P=0.02), eye strain (P=0.002), and difficulty in eye refocusing (P=0.007), was significantly higher in students who used Android smartphones (2.32±1.67) than in students who used Apple smartphones (1.81±1.47; P=0.0001). These findings suggested that iPhones might be associated with a fewer number of complaints than Android smartphones for users’ eyes.
Our results also demonstrated that ametropia (refractive errors) was an important risk factor for many complaints, including headache, visual blur, neck pans, DED, and refocusing difficulties (P=0.007, 0.003, 0.01. 0.002 and 0.001, respectively).
3.2. Logistic and Linear Regression Analysis Outcomes
Tables 2-4 show the CVS-F3 multivariate logistic and linear regression analyses.
| CVS Symptoms |
Android N=2375 |
Apple N=258 |
Laptop N=1059 |
Desktop Computer N=135 |
Other Smartphone N=203 |
Any Smartphone*N=2836 | P Value |
| Headache | 50.99% (1211) | 48.06% (124) | 47.69% (505) | 52.59% (71) | 55.17% (112) | 51.02%(1447) | 0.20 |
| Blurred vision | 34.44% (818) | 25.19% (65) | 32.20% (341) | 31.11% (42) | 34.48% (70) | 33.60%(953) | 0.04 |
| Neck/Shoulder/Back pains | 34.57% (821) | 27.52% (71) | 33.14% (351) | 42.22% (57) | 33.00% (67) | 33.82% (959) | 0.046 |
| Fatigue | 55.96% (854) | 28.68% (74) | 37.20% (394) | 32.59% (44) | 30.54%(62) | 34.91% (990) | 0.05 |
| Eye strain | (404) 17.01% | 9.69% (25) | 12.56% (133) | 8.89% (12) | 12.32% (25) | 16.01% (454) | <0.0001 |
| Dry eye | 17.22% (409) | 14.35% (37) | 18.98% (201) | 22.96% (31) | 12.81% (26) | 16.64% (472) | 0.052 |
| Eye redness and irritation | 20.59% (489) | 15.50% (40) | 22.66% (240) | 14.07% (19) | 20.69% (42) | 20.13% (571) | 0.04 |
| Double vision | 3.58% (85) | 1.55% (4) | 2.83% (30) | 9.63% (13) | 2.46% (5) | 3.31% (94) | <0.0001 |
| Difficulty refocusing the eyes | 17.52% (416) | 10.85% (28) | 15.96% (169) | 7.41% (10) | 14.29% (29) | 16.68% (473) | 0.002 |
|
Number of symptoms Mean ± SD Median (range) |
2.31±1.67 2 (0-9) |
1.81±1.47 2 (0-6) |
2.23±1.9 2 (0-9) |
2.21±1.98 2 (0-9) |
2.16±1.55 2 (0-6) |
2.26±1.65 2 (0-9) |
0.0001 |
| Variable | Odds ratio (95% Confidence Interval) | P Value |
|
How many hours do you spend on your digital screen? 1 hour 2 hours 3 hours 4 hours 5 hours ≥ 6 hours |
1 0.99 (0.671.46) 2.48 (1.65-3.73) 1.54 (1.04-2.27) 3.24 (2.08-5.03) 2.84 (1.88-4.44) |
0.96 <0.0001 0.03 <0.0001 <0.0001 |
|
How many hours you spend watching your screen in the dark? 1 hour 2 hours 3 hours 4 hours 5 hours ≥ 6 hours |
1 0.97 (0.78-1.21) 1.79 (1.22-2.60) 1.75 (1.06-2.89) 5.07 (1.58-16.29) 3.84 (0.91-16.23) |
0.80 0.003 0.03 0.006 0.007 |
|
To what level do you illuminate your digital screen (i.e., brightness) in a lit room? 10% 20% 50% 70% 100% |
1 1.85 (1.41-2.45) 1.89 (1.45-2.46) 1.99 (1.45-2.73) 1.90 (1.34-2.69) |
<0.0001 <0.0001 <0.0001 <0.0001 |
|
How many years have you spent using screens in this manner: 1 years 2 years 3 years 4 years 5 years or more |
1 1.33 (0.91-1.96) 1.69 (1.17-2.45) 3.34 (2.24-4.97) 1.76 (1.20-2.56) |
0.15 0.006 <0.0001 0.003 |
|
Do you usually study medicine using: Book Screen Both |
1 3.02 (2.04-4.46) 1.81 (1.34-2.45) |
<0.0001 <0.0001 |
|
Do you have any refractive error or wearing glasses? No Yes |
1 3.4 (2.5:4.8) |
0.002 |
|
Do you wear contact lenses? No Yes |
1 4.1 (2.9:5.5) |
<0.0001 |
|
Upper screen edge is at/above horizontal eye level No Yes |
1 44.3 (10.0:196.5) |
<0.0001 |
|
Close eye-screen distance No Yes |
1 12.6 (6.4:23.5) |
<0.0001 |
|
Poor lightening conditions No Yes |
1 3.2 (2:4.2) |
<0.0001 |
| Variable | Regression coefficient (95% confidence interval) | P Value |
|
Gender Males Females |
1 0.17 (0.08:0.27) |
<0.0001 |
|
What is your commonest/primary screen? Desktop Computer Screen Apple smartphone Android smartphone Laptop iPad/Table/ Other screen |
1 1.3 (0.5:2.9) 3.9 (2:8.4) 1.5 (0.8:4.2) 1.2 (0.7:3.1) |
0.68 <0.0001 0.26 0.32 |
|
How many hours do you spend on your digital screen? 1 hour 2 hours 3 hours 4 hours 5 hours ≥ 6 hours |
1 0.23 (-0.02:0.49) 0.39 (0.20:0.54) 0.46 (0.29:0.70) 0.35 (0.10:0.61) 0.80 (0.53:1.05) |
0.07 0.02 0.03 0.01 <0.0001 |
|
How many hours you spend watching your screen in the dark? 1 hour 2 hours 3 hours 4 hours 5 hours ≥ 6 hours |
1 0.03 (0.09:0.15) 0.19 (0.03:0.15) 0.26 (0.05:0.48) 0.43 (0.15:0.72) 0.31 (0.11:0.64) |
0.60 0.02 0.02 0.003 0.01 |
|
To what level do you illuminate your digital screen (i.e., brightness) in a lit room? 10% 20% 50% 70% 100% |
1 0.18 (0.02:0.33) 0.28 (0.14:0.43) 0.36 (0.19:0.54) 0.08 (-0.10:0.26) |
0.02 <0.0001 <0.0001 0.41 |
|
The hours you spend on your digital screen are: Interrupted Continued |
1 0.31 (0.18:0.43) |
<0.0001 |
|
Do you spend most of your screen time during the day or at night? Day Night |
1 0.30 (0.19:0.41) |
<0.0001 |
|
How many years have you spent using screens in this manner: 1 year 2 years 3 years 4 years 5 years or more |
1 0.23 (-0.01:0.48) 0.41 (0.18:0.64) 0.71 (0.47:0.95) 0.49 (0.26:0.73) |
0.06 0.001 <0.0001 <0.0001 |
|
Do you have any refractive error or wearing glasses? No Yes |
1 0.7 (0.4:1.0) |
0.002 |
|
Screen-glare No Yes |
1 1.4 (0.8:2.0) |
<0.0001 |
|
Poor screen- resolution or design No Yes |
1 1.4 (0.9:2.0) |
<0.0001 |
| Variable | Regression Coefficient (95% confidence interval) | P Value |
|
Gender Males Females |
1 0.15 (0.06:0.5) |
0.003 |
| Total daily screen-hours | 0.2 (0.1:0.28) | <0.0001 |
| Screen-years | 0.2 (0.08:0.3) | <0.0001 |
|
Commonest used screen Desktop Computer Screen Apple smartphone Android smartphone Laptop iPad/Table/ Other screen |
1 0.9 (0.3:1.5) 1.0 (0.5:1.5) 0.6 (0.4:1.2) 2.0 (0.8:3.2) |
0.01 <0.0001 0.04 0.001 |
|
Screen size Large Medium/ Small |
1 0.3 (0.02:0.7) |
0.04 |
| Previous DED diagnosis | 1.0 (0.5:1.5) | <0.0001 |
| Contact lens wearer | 1.2 (0.3:2.1) | 0.01 |
| Poor lightening conditions | 0.8 (0.4:1.3) | <0.0001 |
| Upper screen edge at/above horizontal eye level | 1.0 (0.6:1.4) | <0.0001 |
| Close eye-screen distance | 1.0 (0.6:1.3) | <0.0001 |
| Uncomfortable seating postures | 1.9 (1.3:2.5) | <0.0001 |
| Texting with both thumbs | 0.9 (0.5:1.3) | <0.0001 |
| Screen-glare | 0.8 (0.1:1.5) | 0.02 |
| Poor screen- resolution or design | 1.2 (0.5:1.8) | 0.001 |
3.3. Ophthalmologic Examination Outcomes
The risk group included 352 students, and the control group included 611 students. We examined the entire risk group and randomly selected 352 students from the control group by using STATA version 14.2 to achieve a 1:1 ratio at each university and minimize statistical bias. Students who were randomly selected from the control group comprised the “mini-control group”. Overall, we examined a total of 704 eyes of 704 students (one eye from each student) and identified them as the ophthalmic examination group.
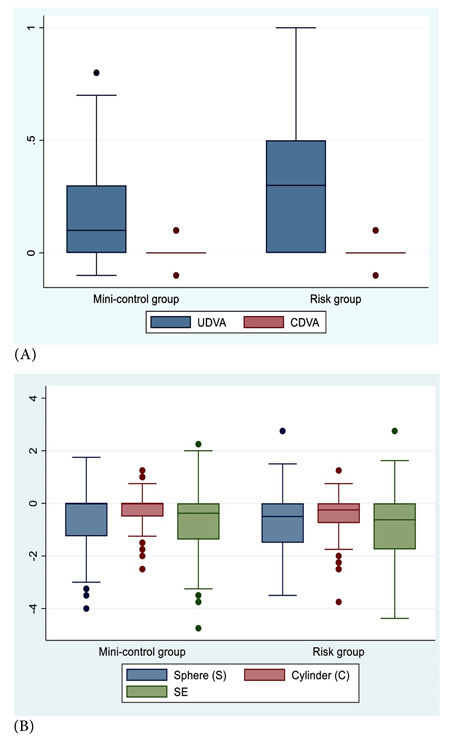
Table 5 and Fig. (1) show the comparative outcomes between the mini-control and risk groups.
| Parameters |
Mini-control Group (n= 352 eyes of 352 students) (Mean ± SD) Median (Range) |
Risk Group (n= 352 eyes of 352 students) (Mean ± SD) Median (Range) |
Mean difference 95% Confidence Interval | P Value | |
| Visual outcomes (logMAR): | |||||
| UDVA | 0.19±0.20 0.1 (-0.1:0.8) |
0.31±0.26 0.3 (0:0.9) |
-0.12 (-0.16:-0.08) |
<0.0001 | |
| CDVA | 0.008±0.03 0 (-0.1:0.1) |
0.015±0.04 0 (-0.1:0.1) |
-0.007 (-0.013:-0.001) |
0.02 | |
| Refractive status: | |||||
| Eyes with emmetropia (SE= 0.00) Eyes with amertropia (refractive errors) |
86 eyes (24.3%) 266 eyes (75.7%) |
106 eyes (29.9%) 246 eyes (70%) |
0.14 | ||
| Subjective refraction (D): | |||||
| Sphere | -0.56±1.02 0 (-4:1.75) |
-0.72±0.97 -0.5 (-3.5:2.75) |
-0.0.17 (-0.003:0.33) |
0.02 | |
| Cylinder | -0.19±0.54 0 (-2.5:1.25) |
-0.42±0.66 -0.25 (-3.75:1.25) |
0.23 (0.13:0.33) |
<0.0001 | |
| SE | -0.66±1.15 -0.38 (-4.75:2.25) |
-0.94±1.17 -0.63 (-4.38:2.75) |
0.28 (0.08:0.48) |
0.005 | |
| Contact lens: | |||||
| Contact lens wearers | 13 eyes (4%) | 78 eyes (22.2%) | <0.0001 | ||
| DED tests: | |||||
|
Tear film break-up time: TBUT in seconds Abnormal TBUT test (< 10 seconds) |
11.42±2.78 12 (4:17) 80 eyes (22.8%) |
8.59±1.99 8 (4:14) 250 eyes (71.1%) |
2.83 (2.42:3.24) |
<0.0001 <0.0001 |
|
|
Schirmer test: Schirmer test in mm Abnormal Schirmer test (< 10 mm) |
17.69±5.43 19 (6:33) 39 eyes (11.2%) |
10.69±4.91 8 (5:25) 206 eyes (58.4%) |
6.84 (5.96:7.72) |
<0.0001 <0.0001 |
|
| Slit-Lamp examination: | |||||
| Conjunctival hyperemia (eye redness) | 51 eyes (14.6%) | 220 eyes (62.5%) | <0.0001 | ||
| Watery/Mucous discharge | 5 eyes (1.5%) | 35 eyes (10.1%) | <0.0001 | ||
| Fundus examination: | Normal in 100% of eyes | Normal in 100% of eyes | |||
| Students/Eyes documented with: | |||||
| Diagnosed CVS cases | 42 students (11.9%) | 352 students (100%) | <0.0001 | ||
Regarding refractive outcomes, there were insignificant differences between numbers of emmetropic and ametropic eyes in both groups (P=0.14) (Table 5). However, the mean sphere, cylinder, and SE were significantly higher in the risk groups than the mini-control groups (P=0.02, <0.0001 and 0.005, respectively). These findings suggest that refractive errors, myopia, and astigmatism were associated risk factors for CVS occurrence.
Despite the fact that our CVS-F3 recorded that 56.5% of 4030 students had refractive errors and/or wearing glasses while 5.9% were contact lens wearers; however, our ophthalmic examination of 704 students revealed that 27.1% were emmetropes, 64.4% were myopes, and 8.5% were hyperopes.
Regarding visual outcomes, both UDVA and CDVA were significantly better in mini-control than risk groups (P<0.0001 and 0.02 respectively). A sub-sample of these students underwent mfERG examination.
In addition, our ophthalmic examination documented that 12.9% of examined students were contact lens wearers; 4% and 22.2% in mini-control and risk groups, respectively (P<0.0001) (Table 5). Furthermore, Tables 6 and 7 show detailed statistical analysis regarding contact lens wearers. We exhibited statistically significant differences between contact and non-contact lens-wearers regarding associated CVS complaints and severity especially DED, visual blur, headache, and eye redness (P<0.0001, 0.03, 0.02, and 0.03, respectively) (Table 6). Interestingly, we documented that 100% of contact lens wearers (91 students) versus 49.3% non-contact lens wearers (303 students) were finally diagnosed with CVS (P<0.0001) (Table 6). Eventually, these findings and statistical data signify that contact lens wearers were more susceptible to a greater risk of developing CVS.
Regarding DED tests, both TBUT and Schirmer tests showed significantly reduced means in risk than mini-control groups (P<0.0001). However, 22.8% and 11.2% of students in the mini-control group had undiagnosed DED and CVS, respectively (Table 5 and Fig. 2).
| Symptoms |
Non-Contact Lens-Wearer N=613 (87.1%) |
Contact Lens-Wearer N=91 (12.9%) |
P Value |
| Ocular symptoms | |||
| Blurred vision | 40.9% | 58.1% | 0.03 |
| Dry eyes | 19.1% | 88.4% | <0.0001 |
| Eye strain/fatigue | 43.6% | 44.2% | 0.94 |
| Eye redness | 20.7% | 34.9% | 0.03 |
| Double vision | 2.0% | 2.3% | 0.60 |
| Refocusing difficulties | 17.5% | 25.6% | 0.18 |
| Near vision difficulties | 13.5% | 20.9% | 0.17 |
| Unclear objects | 39.1% | 55.8% | 0.03 |
| Extraocular symptoms | |||
| Headache | 36.2% | 55.8% | 0.02 |
| Insomnia | 17.7% | 39.5% | <0.0001 |
| Depression | 0.6% | 0 | 1.00 |
| Neck pains | 42.3% | 60.5% | 0.02 |
| Joint pains | 28.6% | 41.9% | 0.06 |
| Inability to hold objects | 3.3% | 14.0% | 0.01 |
| Difficulty to write | 6.5% | 4.7% | 1.00 |
|
Number of symptoms Mean ± SD Median (range) |
3.4±2.9 3 (0:13) |
5.5±2.9 6 (0:11) |
<0.0001 |
| CVS diagnosed with ophthalmic examination | 303 (49.3%) | 91 (100%) | <0.0001 |
| - |
Non-Contact Lens-Wearer N=613 (87.1%) |
Contact Lens-Wearer N=91 (12.9%) |
P Value |
| Poor lightening conditions | 20.4% | 27.9% | 0.24 |
| Watch screen in the dark | 33.6% | 34.9% | 0.87 |
| Upper screen edge at/above horizontal eye level | 28.6% | 23.3% | 0.45 |
| Close eye-screen distance | 41.9% | 58.5% | 0.01 |
| Uncomfortable seating postures | 10.9% | 9.3% | 0.75 |
| Texting with both thumbs | 27.8% | 44.2% | 0.02 |
| Screen-glare | 6.4% | 2.3% | 0.51 |
| Poor screen- resolution or design | 6.8% | 9.3% | 0.53 |
| Small font-size | 23.6% | 27.9% | 0.52 |
| Previous DED diagnosis | 9.0% | 83.7% | <0.0001 |
| Refractive errors | 54.4% | 90.7% | <0.0001 |
3.4. mfERG Examination Outcomes
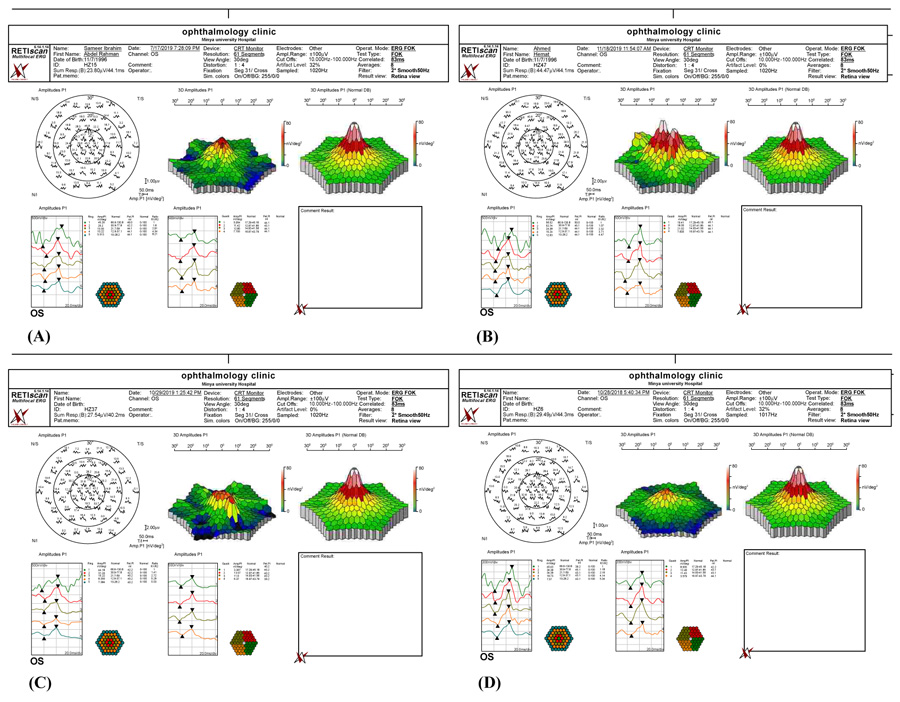
The mfERG group included 90 eyes of 90 students (35 men and 55 women): 44 eyes from the mini-control group and 46 eyes from the risk group. All 90 eyes revealed a normal fundus examination during the ophthalmological assessment; however, the eyes from the risk group had complaints of a visual blur. Out of the total 90 eyes, the mfERG examination revealed normal foveal responses in 57 eyes (63%), including 44 eyes from the mini-control group and 13 eyes from the risk group, respectively (P<0.0001) (Table 8). These 57 eyes had a good foveal response with a preserved foveal peak (first positive peak, P1), and the Amplitude Density (AD) was within the normal range, which indicated normal foveal function. However, we recorded reduced foveal response in the remaining 33 eyes (37%) from the risk group, respectively (P<0.0001) (Table 8). We identified that the 33 eyes with positive mfERG findings were positive cases. Table 8 shows the data summary of the mfERG group.
|
Parameters
(Mean ± SD) Median (Range) |
mfERG students from
mini-control group (n= 44 eyes of 44 students) |
mfERG of students from
risk Group (n= 46 eyes of 46 students) |
Mean difference
(mini-control-risk) 95% Confidence of Interval |
P Value |
|---|---|---|---|---|
| Age | 22.90±1.60 23 (19:25) |
22.00±2.09 22 (19:25) |
0.11 | |
| mfERG findings: | ||||
| I- Amplitudes P1(nV/deg2): | ||||
|
Ring 1
(normal 66.6-130.8) |
74.15±18.06 72.78 (41.72:141.4) |
57.83±13.00 57.02 (26.04:90.16) |
16.32 (6.85:26.76) |
<0.0001 |
|
Ring 2
(normal 30.9-77.8) |
36.35±6.83 35.5 (25.08:55.45) |
30.71±6.17 31.59 (15.17:43.11) |
5.64 (1.12:9.41) |
0.0001 |
|
Ring 3
(normal 21.7-59) |
20.88±4.35 21.23 (11.32:29.81) |
18.88±3.81 18.54 (11.54:31.42) |
2 (-0.54:4.08) |
0.02 |
|
Ring 4
(normal 12.9-37.1) |
12.85±2.67 13.16 (7.33:17.84) |
10.81±2.74 10.73 (4.98:17.83) |
2.08 (0.49:3.58) |
0.001 |
|
Ring 5
(normal 10-28.2) |
10.13±2.59 9.94 (5.51:15.78) |
8.10±2.18 7.94 (3.27:13.75) |
2.03 (0.57:3.39) |
0.0001 |
| II- Amplitudes P1 (nV/deg2): | ||||
|
Quadrant 1
(normal 15.8-42.74) |
11.74±3.48 11.53 (5.05:19.41) |
9.84±2.40 9.68 (5.12:19.38) |
1.9 (0.12:3.98) |
0.003 |
|
Quadrant 2
(normal 15.98-42.75) |
14.96±2.53 15.84 (9.58:18.71) |
12.49±3.67 12.40 (4.18:21.82) |
2.47 (0.56:4.34) |
0.0004 |
|
Quadrant 3
(normal 15.18-42.05) |
15.58±3.35 14.81 (10.6:22.37) |
12.92±3.55 12.96 (4.89:19.97) |
2.66 (0.35:4.56) |
0.0004 |
|
Quadrant 4
(normal 13.87-39.61) |
10.98±3.32 10.46 (4.78:19.72) |
9.09±2.42 9.32 (3.26:13.45) |
1.89 (0.11:3.78) |
0.003 |
| III- Foveal functions: | ||||
|
Normal foveal response (eye)
Reduced foveal response (eye) |
44 eyes (100%) 0 eyes (0%) |
13 eyes (28.26%) 33 eyes (71.74%) |
<0.0001 |
Fig. (2) shows examples of mfERG findings in 4 students from the risk group. Table 8 shows the differences in mfERG findings between the students in the mini-control and risk groups. Overall, mfERG rings (1, 2, 4, and 5) and mfERG quadrants (1–3) were significantly different between the two groups. Furthermore, the mfERG foveal response was better in the mini-control group than in the risk group (P<0.0001).
These mfERG findings suggest dysfunction of macular cone bipolar cells. In addition, we believe that these changes in the mfERG findings might have emerged from direct light exposure due to electrode/focusing effects, cone adaptation, or the spectral output of the devices which varied between subjects. Moreover, the eye exposure to excessive levels of longer-wavelength light could also adapt M and L cones more than a shorter-wavelength exposure.
4. DISCUSSION
Our study demonstrated that CVS surveys actually overestimate the real CVS prevalence. Furthermore, smartphone abuse was the main cause of CVS among the participants. In addition, we exhibited mfERG findings in CVS students complaining of a visual blur. These findings suggest that CVS might have induced visual drawbacks in form of reduced foveal, peri-foveal, and para-foveal rings responses.
Our ophthalmic examination demonstrated that the CVS prevalence rate was 56% among the users, which is much lower than the 84.8% prevalence rate of CVS-F3 surveyed students. Therefore, the CVS questionnaire survey overestimated the actual CVS prevalence.
We demonstrated a 56% CVS prevalence rate among the study participants despite CVS-F3 analysis revealed that 84.8% of total enrolled participants might have complaints related to CVS. Our ophthalmic examination group included 704 students (352 from the mini-control group and 352 from the risk group) with 100% and 12% CVS prevalence in risk and mini-control groups, respectively, thus the overall CVS prevalence in the ophthalmic group was 56%. Moreover, 22.9% and 14.6% of mini-control students had DED and eye redness, respectively, despite they reported no complaints in their previous CVS-F3 responses. These results suggest that CVS may be presented subclinically in non-complaining subjects.
Our CVS-F3 outcomes revealed that the female gender was a risk factor for CVS occurrence and symptomatology. This finding can be explained by several factors; the higher percentage of surveyed students were females (57.9%) who complained of more symptoms than males particularly headache, eye fatigue, DED, and eye redness (P=0.001, 0.04, 0.002, and 0.005, respectively). Furthermore, females were spending more screen-hours in the dark than males (P=0.03). We also believe that females had spent more indoor-times with their screens than males who had more outdoor activities.
The relatively better statistical outcomes of Apple smartphones than Android smartphones can be explained by many factors mainly because of the small number of students using Apple smartphones (6.40%) in comparison to a large number of students using Android smartphones (58.93%) in our study. We think that the differences between Android and Apple smartphones may disappear with equal samples. Furthermore, the different screen sizes, poor screen resolutions, and old or used versions of smartphones might be responsible for such complaints. In addition, the Android smartphone is more popular in our communities because of its several models, cheap prices, and wide commercial network with easy availability and exchangeability.
We recorded that most students had used more than one type of screen in their practical lives and it is actually difficult to isolate the effect of a particular screen alone on the eye in presence of mixed-screen use. At the beginning of the study, we were expecting desktop computers, laptops, pads, or tabs to be the commonest screen used by medical students for their medical education programs and tasks. Surprisingly we documented smartphones to be the commonest screen used by the students. The main reason is that our universities provide only desktop computers in special halls and libraries for medical students inside the universities. Therefore, our study recorded that 74% of students studied their medical materials using medical books and printed layouts which may explain why smartphone was recorded as the commonest screen used.
We think that the smartphone itself might not be the problem exacerbating CVS but the way the subjects were using smartphones might be the problem, e.g. too close or improper viewing distance and illumination, uncomfortable/incorrect seating postures, poor screen design, or screen resolution, improper screen-brightness, screen-glare, texting with both thumbs, font-size, screen-size, gaze angle, and excessive visual tasks. Smartphones are lightweight, small in size, and hand-held screens. Our Multivariate linear and logistic regression analyses exhibited that all the previously mentioned screen behaviour were associated risk factors for CVS development and increasing severity.
Our linear and logistic regression analyses documented that the CVS severity increases as the screen becomes closer to the eye. We also observed that the smaller the screen i.e. small screen size, the more the CVS severity with an increase in the symptoms-attacks mainly eye strain. The previous findings aggravated eye-focussing inadequacy and improper eye coordination that eventually increased the CVS severity and sequelae. Furthermore, CVS severity was also increased by the uncorrected refractive errors, excessively high screen-brightness, and an increase in the total daily screen hours. This might explain the more CVS severity in the risk group, as we documented significantly higher refractive errors with higher levels of screen-brightness and illumination in the risk than mini-control groups. Ideally, the upper border of the screen should be below the horizontal eye level, a down-gaze angle of 15° is perfect for decreasing eyestrain, however, we think that students do not keep such an ideal gaze angle with their screens mainly smartphones as being light hand-held screen than can be seen from different improper gaze angles (e.g. when lying down or in beds) which explain poor eye-focusing with eye strain and headache. For all these reasons, we exhibited that smartphone abuse was responsible for the utmost CVS severity. On the other hand, the desktop computer was responsible for the least CVS severity.
Several studies [47-49] reported that DED is a major contributor to the manifestation of CVS. Malik et al. [35] revealed that 52.5% of students studied at night and that 18.5% and 35.5% of students had abnormal TBUT and Schirmer test results, respectively. In our study, 68.8% of the students studied at night, while 47% and 34.8% of students had abnormal TBUT and Schirmer test results, respectively. Moreover, Akkaya et al. [15] concluded that long screen-hours did not affect the Schirmer test results but did change the TBUT results and also stated that CVS is a cause of evaporative DED.
Similar to the results of our final logistic regression analysis, Kim [50] et al. revealed that >2 continuous screen-hours daily were associated with a higher number of symptoms. They also reported that a higher smartphone exposure in a lifetime was associated with a higher occurrence of multiple symptoms; while we recorded that ≥3 screen-year was associated with a higher incidence of CVS. Meanwhile, contrary to our outcomes, Reddy et al. [23] reported that the CVS prevalence was 90% among 795 medical students from five national universities. The prevalence was higher than that reported in our study, and these outcomes may be attributed to the larger sample size included in our study. Furthermore, they reported that >2 continuous screen-hours were associated with the highest number of complaints, while interrupted screen-hours were associated with the least number of complaints. We also documented an increase in the number of symptoms with continuous screen hours.
González-Pérez et al. [28] created the Computer-Vision Symptom Scale (CVSS17) based on the Rasch analysis [51]. They subsequently classified the main CVS-associated factors into two basic categories: 1) internal and 2) external symptom factors. The main difference between the CVS-F3 and CVSS 17 is that the CVSS 17 focuses on symptomatology, while the CVS-F3 focuses on both symptomatology and the detection of main causative screen types and screen-associated factors responsible for these symptoms. Our CVS-F3 can also be compared with the CVS-Q, which is also based on the Rasch analysis. The CVS-Q was created by Seguí et al. [29] and includes an analysis of the frequency and intensity of 16 CVS symptoms; therefore, it provides more details about the grades of individual symptom severity than CVS-F3 which included analysis of the frequency and intensity of only 13 CVS symptoms, however, CVS-F3 investigates additional 9 CVS screen-behavior factors regarding users’ screen-style which is not available in CVS-Q. Moreover, Cronbach’s alpha reliability coefficient is .742 for CVS-F3.
For example, Rossi et al. [48] used a multivariate analysis to evaluate the results of the CVSS17 and reported that there was a positive association between DED and screen-hours and age. We also recorded a positive association between DED and other factors, including female gender, continuous screen-hours, and night screen exposure. Although we did not find a significant relationship between DED and the number of daily screen hours, we identified that there was a statistically significant relationship between DED and the number of screen hours in the dark. We think that night screen exposure or in the dark, screen-hours allow complete eye-focusing on the screen with maximum brain attention in following the screen-content resulting in decreased blink rate and exacerbation of evaporative DED more than that associated with day screen-hours in which there are simultaneous different visual targets at the same time with less brain attention.
Recently, Vaz et al. [1] conducted subjective and objective examinations on 77 participants to evaluate CVS-related eye fatigue and DED. The authors used two separate questionnaires for their subjective assessment: 1) the Ocular Surface Disease Index (OSDI) questionnaire and 2) the Portuguese Group of Ergophthalmology (PGE) questionnaire. The OSDI and PGE questionnaires evaluate DED and eye fatigue, respectively. They also conducted a slit-lamp examination, the Schirmer test without topical anesthesia, tear film analysis with TBUT using a DED monitor, and convergence and accommodation near points measurements for their objective analysis. Similar to our outcomes, Vaz et al. [1] finally concluded that more screen-hours (>2 screen-hours daily) increased CVS severity.
In addition, Lin et al. [52] reported their long-term five years longitudinal study regarding myopia progression after puberty. They revealed a remarkable result with up to 95% prevalence of myopia after the age of puberty. Finally, they concluded that myopia continued to progress after puberty but at a slower rate than that of childhood. Similarly, our study recorded a higher 64.4% prevalence rate of myopia among medical students.
Interestingly, in Egypt, we are familiar with the use of blue-filter lenses to treat refractive errors and partially guard against CVS complaints. However, these blue-filter lenses are new strategies in the United States of America (USA) where ophthalmologists and optometrists are more familiar with the use of plus lenses, progressive lenses, and other types of lenses to treat refractive errors such as myopia, hyperopia, and related problems or even slowing their progression [53-57]. On the contrary, we are not familiar in Egypt with these modalities of treatment in the USA. Furthermore, we think that hyperopes who have CVS could get benefit from plus lenses to relieve the associated complaints and lessen the frequency of symptoms-attacks.
The basic limitation of our study was the small sample size of the mfERG group (n=90) due to cost-related issues. Unfortunately, our ophthalmic examination group included only participants from mini-control and risk groups but not from the low-symptoms group which might be a potential source of bias. However, similar to our study, several authors stressed the necessity to understand the underlying mechanisms of CVS development, how to prevent, and treat its sequelae [58-69].
CONCLUSION
In conclusion, CVS is a potentially serious and marginalized health security issue that does not receive adequate attention from health organizations, such as the World Health Organization, and medical societies. Due to the lack of public and clinicians' awareness, it can be simply misdiagnosed or missed. Unfortunately, subjective CVS surveys overestimate the actual CVS prevalence. Such questionnaires are helpful in identifying subjects at CVS risk to be subjected to ophthalmic examination. CVS diagnosis could only be confirmed through comprehensive ophthalmic examination. The way users handle smartphones is the real cause of the sudden rise of CVS prevalence and sequelae in recent years. Therefore, we suggest that users should learn how they could rationalize the correct use of smartphones. Furthermore, we believe that contact lens wearing doubles the risk of CVS development and magnifies its related sequelae. In addition, according to our knowledge, reduced visual acuity is not a well-documented sign of CVS while visual blur is a common symptom of CVS. Nevertheless, we think that our mfERG findings could be considered as an objective clue for the CVS-induced visual blur due to the affection of macular integrity with screen-induced foveal dysfunction. Furthermore, we recommend performing future large-sized randomized studies with comprehensive eye examinations, tests, and investigations, including mfERG, visual field, and retinal-macular imaging examinations. Finally, we also recommend changes in screen style by reducing screen hours and shifting screen time from night to day time.
LIST OF ABBREVIATIONS
| CVS | = Computer Vision Syndrome |
| CVS-F1 | = Computer Vision Syndrome questionnaire form 1 |
| CVS-F3 | = Computer Vision Syndrome questionnaire form 3 |
| mfERG | = multifocal electroretinography |
| DED | = Dry Eye Disease |
| UDVA | = Uncorrected Distance Visual Acuity |
| CDVA | = Corrected Distance Visual Acuity |
| logMAR | = logarithm of the Minimum Angle of Resolution |
| TBUT | = the Tear Film Break-up Time Test |
| SE | = Spherical Equivalent |
| ISCEV | = International Society for Clinical Electrophysiology of Vision |
ETHICS APPROVAL AND CONSENT TO PARTICIPATE
This study was approved by the Institutional Review Board of the Sohag Faculty of Medicine, Sohag University, Egypt. under ethical approval no. (IRB-4-10/4/2018).
HUMAN AND ANIMAL RIGHTS
No Animals were used in this research. All human research procedures followed were in accordance with the ethical standards of the committee responsible for human experimentation (institutional and national), and with the Helsinki Declaration of 1975, as revised in 2013.
CONSENT FOR PUBLICATION
Informed consent was obtained from the patients prior to data collection.
AVAILABILITY OF DATA AND MATERIALS
The data supporting the results of the study are available from the corresponding author [M.I] upon reasonable request.
FUNDING
None.
CONFLICT OF INTEREST
The authors declare no conflict of interest, financial or otherwise.
ACKNOWLEDGEMENTS
The authors would like to thank Dr. Mona Abo-Ali, Mr. Hamza Mohammed, Seif Mohammed, Lina Mohammed, and the EPK Group for providing their help and support throughout this study. The authors would also like to thank Prof. Fouad Metry Yosef, the expert statistician who performed all statistical analyses, Dr. Asma Fouad, who was responsible for the mfERG examination of the students at Minia University, and Prof. Youssef Waheeb, professor of community medicine at Suez Canal University, for his advice and guidance.
SUPPLEMENTARY MATERIAL
Supplementary material is available on the publishers web site along with the published article.

