All published articles of this journal are available on ScienceDirect.

Long-Term Visual, Refractive and Topographic Outcomes of KeraRings Combined with Accelerated Transepithelial Crosslinking for Management of Different Grades of Progressive Keratoconus: A Retrospective Cohort Study
Authors Info & Affiliations
Abstract
Purpose:
To evaluate long-term visual, refractive, and topographic outcomes of KeraRings intrastromal implantation combined with accelerated transepithelial cross-linking for management of different stages of progressive keratoconus.
Materials and Methods:
This retrospective cohort study included 70 eyes of 70 patients with Amsler-Krumeich grades 1 to 4 keratoconus. They were divided into two groups: group-A included 37 eyes with grades 1-2 keratoconus, and group-B included 33 eyes with grades 3-4 keratoconus. Both groups underwent combined Keraring implantation with TCXL treatment. The main outcome measures included the preoperative and postoperative visual acuity, refraction, keratometry readings, and pachymetry.
Results:
At postoperative month 60, group-B exhibited significantly higher values of all mean uncorrected distance visual acuity (UDVA), corrected distance visual acuity (CDVA), sphere/cylinder/spherical equivalent/defocus equivalent (DEQ), and K1/K2/Kaverages/Kmax parameters compared to that of group A. However, group-A exhibited better stability of postoperative improvements. Keratoconus progression (KCP) was greater in group-B (45.5%) than group-A (10.8%). Two eyes revealed segments' migration while one eye showed tunnel vascularization and opacification with segments' migration.
Conclusion:
The diagnostic criteria of preoperative-KCP are not adequate for the diagnosis of postoperative-KCP following ICRS implantation. UDVA and K average posterior seemed to be more sensitive parameters than K max in documenting early postoperative-KCP. We suggest that deterioration of UDVA≥0.10 log MAR and/or K average posterior ≥0.25 D are highly suspicious of post-ring implantation keratoconus progression (PR-KCP). The occurrence of two of the following parameters: Kmax≥0.50 D, Kaverageanterior≥0.50 D, K average posterior ≥0.25 D, or pachymetry≥1.5% thinning, is diagnostic of PR-KCP. The occurrence of two or more of the following parameters: Kmax≥0.50 D, Kaverageanterior≥0.50 D, Kaverageposterior ≥0.25 D, pachymetry≥ 1.5% thinning or UDVA≥0.10 logMAR, is diagnostic of PR-KCP. We also suggest that Kmax≥0.75 D alone is diagnostic of PR-KCP.
1. INTRODUCTION
Keratoconus (KC) is a bilateral progressive asymmetrical ectatic disease of the cornea with multifactorial etiological factors lead to stromal thinning and corneal protrusion [1]. Vernal keratoconjunctivitis [2], chronic eye rubbing [3], thyroid disease [4, 5], pregnancy, and lactation [6] are known risk factors that could promote keratoconus progression (KCP) [7, 8].
The first known effective treatment that halts KCP is the corneal collagen standard cross-linking (SCXL) that was introduced by Wollensak et al. in 2003 [9]. Accelerated epithe- lium-off CXL (ACXL) and accelerated epithelium-on, also known as transepithelial CXL (TCXL), are the two major modifications aimed to achieve the previously mentioned objectives [10-15]. However, several other studies proved the superiority of SCXL versus both ACXL and TCXL in adult and pediatric KC patients [16-23].
Intracorneal ring segments (ICRS) are introduced as a refractive device that helps to support the cone, flatten the corneal surface, and improve the spherical and astigmatic status, thus improving the patients’ visual acuity and quality [24, 25]. The ICRS advantages, disadvantages, timing, indications, evolving nomograms, and their ability to stabilize the ectatic cornea, thus preventing KCP, are still being debated [26, 27]. Meanwhile, combination procedures known as cross-linking plus (CXL-Plus) have become popular among corneal surgeons [28-35]. Keraring segments (Mediphacos Inc., Belo Horizonte, Brazil) are common ring segments that are used as corneal implants worldwide [35, 37].
Over the last decade, several studies recommended the use of Kmax as the main parameter besides other parameters for documentation of KCP, i.e., KCP is documented when Kmax≥1 D [38-42]. However, in 2015, based on the global consensus on keratoconus and ectatic diseases, the panel defined keratoconus progression as the occurrence of 2 of the 3 identified parameters of KCP, which causes an increase in the steepening of the anterior corneal curvature, the posterior corneal curvature, and the corneal thinning [43]. Belin ABCD progression display and the Belin-Ambrosio Enhanced Ectasia Display (BAD) are recently introduced as new accurate topographic tools for screening and documenting KC progression [44-47].
The primary aim of this study was to compare the effectiveness of Keraring segments implantation combined with TCXL in low-grade (grades 1 and 2 Amsler-Krumeich) versus high-grade keratoconus (grades 3 and 4 Amsler-Krumeich). The secondary aim was to evaluate the long-term stability in both groups with the demonstration of the prognostic and diagnostic parameters of post-ring implantation keratoconus progression (PR-KCP).
2. METHODS
2.1. Study Design
This retrospective cohort study is approved by the Institutional Review Board of the Sohag Faculty of Medicine, Sohag University, Egypt, and adhered to the tenets of the Declaration of Helsinki. All surgeries were performed in private eye centres in Sohag city (Future Femtolaser Center) and Giza city (Rowad Correction Center), Egypt.
This study included 70 eyes of 70 KC patients. The nature of the disease, its manifestations, treatment plans, and potential sequelae were properly explained in detail to all patients who signed informed consent before surgery. We obtained the preoperative and postoperative data from the patients’ medical files.
Inclusion criteria are as follows: documented KC progression (Kmax>1 D); grades 1, 2, 3 or 4 keratoconus (Kaverageanterior [mean keratometry on anterior corneal surface] value <48 D, 48–53 D, >53-55 D and >55 D, respectively) based on the Amsler-Krumeich classification (AK). On the other hand, our exclusion criteria are as follows: <46 D Kaverageanterior; <350 μm corneal thickness at the thinnest location (CTT); previous or concomitant eye rubbing; vernal keratoconjunctivitis (VKC); ocular surgery; opacities; or dry eye disease.
All eyes were subjected to preoperative and postoperative assessments of visual acuity, subjective refraction, slit-lamp and fundus examinations, and corneal topography. Our primary outcome measures are as follows: UDVA; CDVA; subjective refractive sphere, cylinder and Spherical Equivalent (SE); defocus equivalent (DEQ) pachymetry (CTT), keratometry (K readings) including K1, K2, Kaverageanterior, and Kmax on the anterior corneal surface and Kaverageposterior on the posterior corneal surface. Our secondary outcome measures were to discover the most reliable parameters and measure their values to document PR-KCP.
2.2. Grouping of Study Participants
The eyes were divided into one of two groups. Patients in each group were subjected to TCXL combined with Keraring implantation. Group A included eyes with AK grades 1 and 2 keratoconus that represented the low-grade keratoconus group. Group B included eyes with AK grades 3 and 4 keratoconus represented the high-grade keratoconus group.
In addition, we planned to conduct additional subgroup analyses of the entire 70 eyes. Therefore, the 70 eyes were also subdivided into 3 subgroups according to their final postoperative status at postoperative 60 months. The first subgroup was the stability subgroup (S-subgroup), which included eyes with almost stable postoperative visual, refractive and topographic outcomes during 60 months follow-up period. The second subgroup was the improvement subgroup (I-subgroup), which included eyes with regression and improved postoperative visual, refractive and topographic outcomes during 60 months follow-up period. The third subgroup was the progression subgroup (P-subgroup), which included eyes with progression and deteriorated postoperative visual, refractive and topographic outcomes during 60 months follow-up period. Postoperative KCP was documented when Kmax exceeded 1 D. Comparisons were made between groups and subgroups to document their effectiveness and related stability.
The devices used in this study are as follows: CSO SIRIUS Topographer (CSO, Florence, Italy), the iFS advanced femtosecond laser (Abbott Laboratories Inc., Abbott Park, IL, USA), the KXL System (Avedro Inc., Burlington, MA, USA). All Keraring segments (SI-5 model, a triangular cross-sectional design with a 5 mm optical zone) were chosen based on the manufacturer’s standard nomogram (Keraring Calculation Guidelines 2009, version 5.2; Mediphacos Inc.), which determined the number, thickness, and arc-length of implanted Keraring segments.
2.3. Surgical Procedure
The corneal tunnel creation parameters were inner diameter 5.00 mm, outer diameter 5.90 mm, entry cut length 1.40 mm, and entry cut thickness 1 mm. The depth of the tunnel was 80% of thinnest corneal thickness, provided that at least 100 µm existed between the tunnel and the corneal endothelium. The site of the incision was created at the steepest axis.
Topical 0.4% benoxinate hydrochloride anesthetic eye drops (BENOX Sterile Ophthalmic Solution, EIPICO, Tenth of Ramadan City, Egypt) were instilled 3 times with 5 minutes intervals. All patients were instructed to look at the flashing light to mark the corneal centre accurately. The eye was fixated by a suction ring during the iFS tunnelling of the cornea. Then, the patency of the tunnel was checked by using a spatula. Thereafter, we implanted one or two Keraring segments as determined by the standard nomogram.
2.3.1. Transepithelial CXL
The next step was to perform TCXL. We instilled 0.25% riboflavin solution supplemented with BAC, EDTA, trometamol, hydroxypropyl-methylcellulose (ParaCell, Avedro) onto the corneal surface every 1.5 minutes for 4.50 minutes soaking time. Thereafter, we instilled 0.25% riboflavin solution (VibeX Extra, Avedro) every 1.5 minutes for 6 minutes soaking time. The surgeon had checked the stroma riboflavin loading after instillation by slit-lamp examination. TCXL parameters are as follows: 45 mW/cm2 power, 7.2 J/cm2 energy, pulsed mode (one second on and one second off), 2.40 minutes UV treatment time, and 5.20 total treatment time.
2.3.2. Postoperative Treatment and Follow-up
The postoperative topical treatment are as follows: prednisolone acetate 1% eye drops (Pred Forte, Allergan, Inc, Jersey City, USA), gatifloxacin 0.3% eye drops (Zymar, Allergan, Inc, Jersey City, USA), and sodium hyaluronate 0.15% eye drops (Hyabak, THEA laboratories, Clermont-Ferrand, France). The eye drops were instilled 4 times daily for the first 5 days and twice daily for the next 10 days. At the first postoperative follow-up visit, we removed the bandage contact lenses. The postoperative follow-up visits were scheduled at postoperative day 1, week 1, as well as months 1, 6, 12 then annually. However, corneal topography was, unfortunately, available for all eyes only at postoperative first, fourth, and fifth years.
2.4. Statistical Analysis
Data were analyzed using STATA version 14.2 (Stata Statistical Software: Release 14.2 College Station, TX: StataCorp LP.). Quantitative data were represented as mean, standard deviation, median, and range. Data were analyzed using student t-test to compare means of two groups and ANOVA for comparison of the means of three groups or more. When the data were not normally distributed, the Kruskal Wallis test for comparison of three or more groups and Mann-Whitney test was used to compare two groups. Qualitative data were presented as numbers and percentages and compared using either the Chi-square test or Fisher exact test. A comparison was made between preoperative and postoperative follow-up data at 12, 48, and 60 months using the RM ANOVA test. Sphericity was examined using Mauchly's Test of Sphericity. Bonferroni post hoc test was used to examine the difference at each time point. P-value was considered significant if it was less than 0.05.
3. RESULTS
This study included 70 eyes of 70 keratoconus patients (51% male, 49% female). The mean age of patients in group A (n=37) was 26.35±5.83 years, and in group B (n=33) was 28.55±6.06 years. Table 1 shows the characteristics of the studied patients and their eyes descriptive statistics. We recorded no statistically significant differences between both groups regarding these values; however, there were significant differences between S, I, and P subgroups (p=0.004).
| Variable |
Group A N=37 eyes of 37 patients |
Group B N=33 eyes of 33 patients |
P-value |
|---|---|---|---|
|
Age/years Mean ± SD Median (range) |
26.35±5.83 28 (15:36) |
28.55±6.06 29 (16:45) |
0.12 |
|
Gender Total Patients (70) Males (36) Females (34) |
37 17 (55%) 20 (45%) |
33 19 (58%) 14 (42%) |
0.39 |
|
Preoperative KC grading Eyes (70) A1 (Grade 1, mean K <48 D) A2 (Grade 2, mean K 48-53 D) A3 (Grade 3, mean K 53-55 D) A4 (Grade 4, mean K >55D) |
37 8 (22%) 29 (78%) - - |
33 - - 16 (48%) 17 (52%) |
0.39 |
|
Postoperative subgrouping: Stability subgroup (S-subgroup) Improvement subgroup (I-subgroup) Progression subgroup (P-subgroup) |
24 (65%) 9 (24%) 4 (11%) |
11 (33%) 7 (21%) 15 (46%) |
0.004 |
| Parameters |
Preoperative Mean ± SD Median (Range) |
Postoperative 12th month Mean ± SD Median (Range) |
Postoperative 48th month Mean ± SD Median (Range) |
Postoperative 60th month Mean ± SD Median (Range) |
Difference (post-60m-pre) Mean ± SD (95% CI) |
P-value |
|---|---|---|---|---|---|---|
| UDVA | 1.21±0.28 1.2 (0.7:1.7) |
0.49±0.20 0.5 (0.1:1.0) |
0.54±0.23 0.5 (0.1:1.1) |
0.63±0.29 0.6 (0.2:1.4) |
-0.59±0.28 (1.14:1.28) |
<0.0001 |
| P1<0.0001, P2<0.0001, P3<0.0001,P4=0.004,P5<0.0001,P6<0.0001 | ||||||
| CDVA | 0.46±0.19 0.5 (0:0.9) |
0.19±0.11 0.2 (0:0.7) |
0.18±0.11 0.2 (0:0.6) |
0.19±0.12 0.2 (0:0.6) |
-0.27±0.12 (-0.30:-0.24) |
<0.0001 |
| P1<0.0001, P2<0.0001, P3<0.0001,P4=0.004, P5=0.90,P6=0.05 | ||||||
| Sphere | -6.46±3.02 -5.5 (-13.25:-1.5) |
-2.92±2.06 -2.88 (-7.75:0.25) |
-3.13±2.10 -2.75 (-7.5:0) |
-3.26±2.17 -2.88 (-8.25:-0.25) |
3.20±1.54 (2.84:3.57) |
<0.0001 |
| P1<0.0001, P2<0.0001, P3<0.0001,P4,0.0001,P5<0.0001,P6=0.02 | ||||||
| Cylinder | -4.78±1.80 -4.63 (-8.85:-1) |
-2.73±1.16 -2.75 (-7.0:0.5) |
-2.89±1.16 -3 (-6.75:0.25) |
-3.0±1.38 -3.0 (-6.5:0.25) |
1.78±1.35 (1.46:2.11) |
<0.0001 |
| P1<0.0001, P2<0.0001, P3<0.0001,P4=0.001,P5=0.008,P6=0.15 | ||||||
| SE | -8.85±3.50 -7.81 (-16:-3.25) |
-4.29±2.26 -3.88 (-9.5:-0.13) |
-4.58±2.31 -4.0 (-9.0:-0.5) |
-4.76±2.54 -4.13 (-10.0:-0.5) |
4.1±1.78 (3.67:4.52) |
<0.0001 |
| P1<0.0001, P2<0.0001, P3<0.0001,P4<0.0001,P5<0.0001,P6=0.3 | ||||||
| DEQ | -6.46±3.02 -5.5 (-13:-1.5) |
-2.94±2.07 -3 (-7.75:-0.25) |
-3.13±2.11 -2.75 (-7.5:0) |
-3.25±2.18 -2.88 (-8.25:-0.25) |
3.21±1.55 (2.85:3.61) |
<0.0001 |
| P1<0.0001, P2<0.0001, P3<0.0001,P4<0.0001,P5=0.0001,P6=0.7 | ||||||
| K1 | 49.76±4.00 49.23 (43:64.7) |
45.14±3.09 44.51 (39.45:52.09) |
45.27±3.13 44.77 (39.33:52.6) |
45.78±3.10 45.13 (40.16:53.43) |
-3.98±3.30 (-4.76:-3.19) |
<0.0001 |
| P1<0.0001, P2<0.0001, P3<0.0001,P4=0.003,P5<0.0001,P6<0.0001 | ||||||
| K2 | 54.90±4.26 55.26 (47.86:68.3) |
49.16±3.34 49.06 (42:55.76) |
49.41±3.35 49.27 (42.5:56.51) |
49.77±3.40 49.8 (42.49:57.15) |
-5.13±3.65 (-6.00:-4.26) |
<0.0001 |
| P1<0.0001, P2<0.0001, P3<0.0001,P4<0.0001,P5<0.0001,P6<0.0001 | ||||||
| Kaverageanterior | 52.33±3.92 52.07 (46.59:66.5) |
47.15±2.84 46.39 (42:53.80) |
47.34±2.85 46.57 (42.03:54.17) |
47.78±2.91 47.16 (42.16:54.45) |
-4.55±3.20 (-5.32:-3.79) |
<0.0001 |
| P1<0.0001, P2<0.0001, P3<0.0001,P4<0.0001,P5<0.0001,P6<0.0001 | ||||||
| K max | 58.55±4.92 58.69 (49.78:72.93) |
53.19±4.02 52.34 (47.5:71.56) |
53.42±4.02 52.65 (47.7:71.99) |
83.92±4.11 53.30 (48.0:72.21) |
-4.63±3.11 (-5.37:-3.89) |
<0.0001 |
| P1<0.0001, P2<0.0001, P3<0.0001,P4=0.002,P5<0.0001,P6<0.0001 | ||||||
| Kaverageposterior | -8.95±1.36 -8.1 (-11.3:-6.8) |
-7.82±1.14 -7.4(-10.1:-6.5) |
-7.89±1.22 -7.3 (-10.4:-6.4) |
-7.93±1.26 -7.4 (-10.6:-6.4) |
0.66±0.23 (0.48:0.76) |
<0.0001 |
| P1<0.0001, P2<0.0001, P3<0.0001,P4=0.12,P5=0.06,P6=0.07 | ||||||
| Pachymetry | 417.8±37.38 400 (370:517) |
415.1±37.05 396.5 (368:510) |
408.9±38.49 392 (350:506) |
401.4±43.23 387.5 (334:491) |
-16.34±19.87 (-21.08:-11.61) |
<0.0001 |
| P1<0.0001, P2<0.0001, P3<0.0001,P4<0.0001,P5<0.0001,P6<0.0001 | ||||||
3.1. Visual, Refractive and Topographic Outcomes
3.1.1. Analysis of Total Studied Eyes (n=70)
Table 2 summarises the preoperative and postoperative data analysis of a total of 70 studied eyes. In general, at postoperative month 60, all studied eyes showed statistically significant improvements in mean UDVA, CDVA, sphere, cylinder, SE, K1, K2, Kaverages (i.e., Kaverageanterior and Kaverageposterior), Kmax, and pachymetry in comparison to their preoperative baseline values (all p<0.0001; p3 in Table 2). However, if we compared 3 postoperative time zones with each other (i.e., postoperative month 12 versus month 48 versus month 60), we simply exhibited that the postoperative month 12 had better outcomes than both postoperative months,48 and 60, in all parameters. In addition, the postoperative month 48 had better outcomes than postoperative month 60 in all para- meters. Eventually, both groups exhibited significant deterio- ration in previous parameters between their values at posto- perative months 12, 48, and 60 (p4, p5, and p6 in Table 2).
3.1.2. Analysis of Group A and B Studied Eyes
Tables 3 and 4 summarise the preoperative and postope- rative data analysis of group A and B studied eyes (n=37 and 33, respectively). At postoperative month 60, the studied eyes revealed statistically significant improvements in all mean parameters in case we compared every postoperative time zone separately (i.e., postoperative month 12, 48, or 60) with the preoperative baseline values (all p<0.0001; p3 in Tables 3 and 4). However, if we compared the 3 postoperative time zones with each other (i.e., postoperative month 12 versus month 48 versus month 60), we simply exhibited that the postoperative month 12 had better outcomes than both postoperative months, 48 and 60, in all parameters. In addition, the postoperative month 48 had better outcomes than postope- rative month 60 in all para- meters. Eventually, both groups exhibited significant deterioration in previous parame- ters between their values at postoperative months 12, 48, and 60 (p4, p5, and p6 in Tables 3 and 4).
| Parameters |
Preoperative Mean ± SD Median (Range) |
Postoperative 12th month Mean ± SD Median (Range) |
Postoperative 48th month Mean ± SD Median (Range) |
Postoperative 60th month Mean ± SD Median (Range) |
Difference (post 60m-pre) Mean ± SD (95% CI) |
P-value |
|---|---|---|---|---|---|---|
| UDVA | 1.0±0.16 1.0 (0.7:1.3) |
0.39±0.17 0.4 (0.1:0.8) |
0.41±0.17 0.4 (0.1:0.7) |
0.46±0.20 0.5 (0.2:1.0) |
-0.54±0.18 (-0.59:-0.48) |
<0.0001 |
| P1<0.0001, P2<0.0001, P3<0.0001,P4=1.00,P5=0.24,P6=0.06 | ||||||
| CDVA | 0.37±0.17 0.4 (0:0.7) |
0.15±0.10 0.1 (0:0.4) |
0.13±0.09 0.1 (0:0.3) |
0.14±0.09 0.1 (0:0.3) |
-0.24±0.11 (-0.27:-0.20) |
<0.0001 |
| P1<0.0001, P2<0.0001, P3<0.0001,P4=0.02,P5=1.00,P6=1.00 | ||||||
| Sphere | -4.16±1.18 -4.25 (-6.75:-1.5) |
-1.55±1.06 -1.5 (-3.5:0.25) |
-1.72±1.07 -1.5 (-4:0) |
-1.82±1.14 -1.5 (-4.5:-0.25) |
2.34±1.04 (2.0:2.69) |
<0.0001 |
| P1<0.0001, P2<0.0001, P3<0.0001,P4=0.001,P5=0.06,P6=0.97 | ||||||
| Cylinder | -3.79±1.40 -4 (-6.25:-1) |
-2.36±0.95 -2.5 (-3.75:0.5) |
-2.53±0.98 -2.75 (-4:0.25) |
-2.41±1.07 -2.5 (-4.5:0.25) |
1.39±1.40 (0.92:1.85) |
<0.0001 |
| P1<0.0001, P2<0.0001, P3<0.0001,P4=0.03,P5=1.00,P6=0.38 | ||||||
| SE | -6.06±1.35 -6.13 (-8:-3.25) |
-2.73±1.13 -2.75 (-5:-0.13) |
-2.98±1.15 -3 (-5.38:-0.5) |
-3.02±1.32 -3 (-6.13:-0.5) |
3.04±1.15 (2.65:3.42) |
<0.0001 |
| P1<0.0001, P2<0.0001, P3<0.0001,P4=0.001,P5=0.25, P6=1.00 | ||||||
| DEQ | -4.16±1.18 -4.25 (-6.75:-1.5) |
-1.56±1.10 -1.5 (-3.5:-0.25) |
-1.71±1.08 -1.5 (-4:-0) |
-1.81±1.14 -1.5 (-4.5:-0.25) |
2.35±1.06 (1.79:2.56) |
<0.0001 |
| P1<0.0001, P2<0.0001, P3<0.0001,P4=0.006,P5=0.48, P6=0.12 | ||||||
| K1 | 47.06±1.98 46.92 (43:51.28) |
43.97±2.11 43.79 (40.29:49.24) |
44.08±2.12 44.04 (40.44:49.19) |
44.56±2.10 44.5 (40.36:49.38) |
-2.50±1.81 (-3.10:-1.89) |
<0.0001 |
| P1<0.0001, P2<0.0001, P3<0.0001,P4=0.46,P5<0.0001,P6<0.0001 | ||||||
| K2 | 51.64±2.35 51.36 (47.86:56.86) |
47.86±2.70 47.19 (42:53.5) |
48.07±2.70 47.54 (42.5:54) |
48.35±2.66 47.79 (42.49:54.12) |
-3.29±2.44 (-4.1:-2.47) |
<0.0001 |
| P1<0.0001, P2<0.0001, P3<0.0001,P4=0.008,P5<0.0001,P6<0.0001 | ||||||
| Kaverageanterior | 49.35±1.76 48.95 (46.59:53.01) |
45.92±2.00 45.65 (42:50.90) |
46.07±1.98 45.99 (42.03:50.81) |
46.46±1.97 46.25 (42.16:50.82) |
-2.89±1.69 (-3.46:-2.33) |
<0.0001 |
| P1<0.0001, P2<0.0001, P3<0.0001,P4=0.02,P5<0.0001,P6<0.0001 | ||||||
| K max | 56.34±4.76 55.45 (49.78:72.18) |
52.77±4.52 51.74 (47.5:71.56) |
52.89±4.50 51.66 (47.77:71.99) |
53.18±4.58 52.05 (48:72.21) |
-3.16±2.44 (-3.97:-2.34) |
<0.0001 |
| P1<0.0001, P2<0.0001, P3<0.0001,P4=1.00,P5=0.07,P6=0.02 | ||||||
| Kaverageposterior | -7.56±0.51 -7.5 (-9.1:-6.8) |
-6.97±0.41 -6.9 (-8.2:-6.5) |
-6.99±0.44 -6.9 (-8.3:-6.4) |
-7±0.46 -6.8 (-8.4:-6.4) |
0.56±0.18 (0.44:0.70) |
<0.0001 |
| P1<0.0001, P2<0.0001, P3<0.0001,P4=0.46,P5=0.18,P6=1.00 | ||||||
| Pachymetry | 440.5±38.07 445 (372:517) |
437.8±37.45 437 (370:510) |
431.86±39.26 431 (365:506) |
425.6±41.2 427 (339:486) |
-14.86±14.77 (-19.79:-9.94) |
<0.0001 |
| P1=0.11, P2<0.0001, P3<0.0001,P4<0.0001,P5<0.0001,P6=0.01 | ||||||
| Parameters |
Preoperative Mean ± SD Median (Range) |
Postoperative 12th month Mean ± SD Median (Range) |
Postoperative 48th month Mean ± SD Median (Range) |
Postoperative 60th month Mean ± SD Median (Range) |
Difference (post-60m-pre) Mean ± SD (95% CI) |
P-value |
|---|---|---|---|---|---|---|
| UDVA | 1.45±0.19 1.5 (1:1.7) |
0.61±0.18 0.6 (0.3:1.0) |
0.68±0.20 0.6 (0.4:1.1) |
0.81±0.26 0.8 (0.3:1.4) |
-0.64±0.20 (-0.71:-0.57) |
<0.0001 |
| P1<0.0001, P2<0.0001, P3<0.0001,P4=0.02,P5<0.0001,P6<0.0001 | ||||||
| CDVA | 0.56±0.15 0.5 (0.3:0.9) |
0.24±0.11 0.2 (0.1:0.7) |
0.23±0.11 0.2 (0.1:0.6) |
0.25±0.12 0.3 (0.1:0.6) |
-0.31±0.11 (-0.35:-0.27) |
<0.0001 |
| P1<0.0001, P2<0.0001, P3<0.0001,P4=1.00,P5=1.00,P6=0.16 | ||||||
| Sphere | -9.04±2.27 -9.25 (-13.25:-4) |
-4.46±1.80 -4.75 (-7.75:-0.5) |
-4.71±1.84 -5 (-7.5:-0.75) |
-4.87±1.91 -5 (-8.25:-1) |
4.17±1.45 (3.65:4.68) |
<0.0001 |
| P1<0.0001, P2<0.0001, P3<0.0001,P4=0.03,P5=0.049,P6=0.33 | ||||||
| Cylinder | -5.90±1.54 -5.75 (-8.85:-3) |
-3.15±1.25 -3 (-7:-0.25) |
-3.30±1.23 -3 (-6.75:-1) |
-3.67±1.40 -3.5 (-6.5:-0.5) |
2.23±1.15 (1.82:2.64) |
<0.0001 |
| P1<0.0001, P2<0.0001, P3<0.0001,P4=0.36,P5=0.03,P6=0.03 | ||||||
| SE | -11.99±2.29 -12.5 (-16:-6.75) |
-6.04±1.89 -6.25 (-9.5:-1.75) |
-6.36±1.95 -6.5 (-9.0:-1.75) |
-6.70±2.12 -6.88 (-10:-2.38) |
5.28±1.62 (4.71:5.85) |
<0.0001 |
| P1<0.0001, P2<0.0001, P3<0.0001,P4=0.02,P5=0.02,P6=0.06 | ||||||
| DEQ | -9.04±2.26 -9.25 (-13.25:-4) |
-4.48±1.80 -4.75 (-7.75:-0.5) |
-4.71±1.84 -5 (-7.5:-0.75) |
-4.87±1.91 -5 (-8.25:-1) |
4.17±1.45 (3.49:5.06) |
<0.0001 |
| P1<0.0001, P2<0.0001, P3<0.0001,P4=0.04,P5=0.03,P6=0.09 | ||||||
| K1 | 52.78±3.51 52.25 (47.57:64.7) |
46.45±3.49 46.78 (39.45:52.09) |
46.61±3.54 46.88 (39.33:52.6) |
47.15±3.48 46.7 (40.16:53.43) |
-5.63±3.80 (-6.98:-4.29) |
<0.0001 |
| P1<0.0001, P2<0.0001, P3<0.0001,P4=0.11,P5<0.0001,P6<0.0001 | ||||||
| K2 | 58.56±2.63 58.23 (55.2:68.3) |
50.62±3.43 51.24 (44.19:55.76) |
50.91±3.40 51.43 (44.65:56.51) |
51.37±3.47 52.14 (44.13:57.15) |
-7.19±3.69 (-8.50:-5.88) |
<0.0001 |
| P1<0.0001, P2<0.0001, P3<0.0001,P4=0.01,P5<0.0001,P6<0.0001 | ||||||
| Kaverageanterior | 55.67±2.80 55.19 (53.06:66.5) |
48.53±3.03 49.03 (42.15:53.80) |
48.76±3.03 49.21 (42.48:54.17) |
49.26±3.10 49.54 (42.96:54.45) |
-6.41±3.49 (-7.65:-5.18) |
<0.0001 |
| P1<0.0001, P2<0.0001, P3<0.0001,P4=0.003,P5<0.0001,P6<0.0001 | ||||||
| K max | 61.03±3.83 60.15 (52.78:72.93) |
53.66±3.39 53.2 (47.58:60.72) |
54.02±3.38 53.81 (47.7:60.97) |
54.75±3.40 54.26 (48.04:61.27) |
-6.28±2.97 (-7.33:-5.22) |
<0.0001 |
| P1<0.0001, P2<0.0001, P3<0.0001,P4=0.004,P5<0.0001,P6<0.0001 | ||||||
| Kaverageposterior | -9.74±1.05 -9.9 (-11.3:-8) |
-8.78±0.92 -9 (-10.1:-7.2) |
-8.91±0.99 -9.1 (-10.4:-7) |
-8.98±1.03 -9.1 (-10.6:-7) |
0.76±0.24 (0.52:0.98) |
<0.0001 |
| P1<0.0001, P2<0.0001, P3<0.0001,P4=0.03,P5=0.008,P6=0.01 | ||||||
| Pachymetry | 392.4±11.00 394 (370:433) |
389.58±10.71 389 (368:431) |
383.2±12.98 384 (350:426) |
374.4±26.3 374 (334:491) |
-18±24.51 (-26.69:-9.31) |
<0.0001 |
| P1=0.001, P2<0.0001, P3=0.001,P4<0.0001,P5=0.004,P6=0.11 | ||||||
3.1.2.1. Between-group Comparisons
Table 5 summarises the postoperative mean differences between both groups at postoperative month 60. We recorded between-group significant differences in all of the mean refractive, visual and topographic parameters at baseline, except for pachymetry (p=0.06; Table 5). Furthermore, we discovered that group B had greater postoperative improve- ments with higher mean UDVA, CDVA, sphere, cylinder (p=0.04, 0.02, p<0.0001, 0.01, respectively; Table 5), SE, K1, K2, Kaverageanterior, Kmax, and Kaverageposterior than in group A (all p<0.0001, Table 5).
3.1.2.2. Between-subgroup Comparisons
Table 6 shows the preoperative and postoperative between-subgroup comparisons based on the postoperative stability status at postoperative month 60. Eventually, the stability, improvement, and progression subgroups included 35, 16, and 19 eyes, respectively, at 60m. Nevertheless, here, we present only the preoperative and postoperative differences at 60m among the three subgroups (i.e., pall in Table 6). We observed no statistically significant differences regarding mean values of all parameters except UDVA, cylinder, Kaverageposterior, and pachymetry. We observed a higher mean UDVA and Kaverageposterior differences value of -0.75±0.16 logMAR and 0.83±0.24 D, respectively, in the I-subgroup than other subgroups (pall=0.0001 and 0.003 respectively). In addition, the I-subgroup revealed a higher mean cylinder difference value of 2.29±0.96 D than other subgroups (pall=0.03). However, we observed a higher mean pachymetry difference value of -34.74±7.32 µm in the P-subgroup than other subgroups (pall=0.0001).
3.1.3. Progression-subgroup Outcomes (n=19)
Table 7 summarises the postoperative differences at postoperative months 12, 48, and 60. The diagnosis of KCP was confirmed only when Kmax deteriorated more than 1 D (Kmax>1 D). All values at postoperative month 12 were considered as the baseline for calculating any postoperative changes, whether improvement or progression. At postope- rative 48m, the Kmax differences values (postoperative 48m-postoperative 12m values) in all 70 studied eyes ranged from -1.89 to 0.87 D, and no case revealed Kmax>1 D; thus, postoperative KCP was excluded at this time-point of the follow-up. Unfortunately, at postoperative 60m, 19 out of these 70 studied eyes revealed definite progression as Kmax differences values (postoperative 60m-postoperative 12m values) ranged from 1.13 to 4.42 D (i.e., Kmax>1 D, Table 7), and we finally documented postoperative KCP in these 19 eyes (1,3,5 and 10 eyes in grades 1, 2, 3 and 4 KC respectively) identified as P-subgroup. Eventually, the P-subgroup included 19 eyes with documented PR-KCP at 60m, 4 eyes from group A (11% progression rate in group A), and 15 eyes from group B (45% progression rate in group B).
| Variable |
Group A Mean ± SD Median (range) |
Group B Mean ± SD Median (range) |
P-value |
|---|---|---|---|
| UDVA: Preoperative Post 60ms-Preoperative |
1.0±0.16 1 (0.7:1.3) -0.54±0.18 -0.5 (-0.8:-0.2) |
1.45±0.19 1.5 (1:1.7) -0.64±0.20 -0.6 (-1.0:-0.3) |
<0.0001 0.04 |
|
CDVA: Preoperative Post 60ms-Preoperative |
0.37±0.17 0.4 (0:0.7) -0.24±0.11 -0.3 (-0.4:0) |
0.56±0.15 0.5 (0.3:0.9) -0.31±0.11 -0.3 (-0.5:-0.1) |
<0.0001 0.02 |
|
Sphere: Preoperative Post 60ms-Preoperative |
-4.16±1.18 -4.25 (-6.75:-1.5) 2.34±1.04 2.25 (0.75:4.5) |
-9.04±2.27 -9.25 (-13.25:-4) 4.17±1.45 4 (2:9) |
<0.0001 <0.0001 |
|
Refractive Cylinder: Preoperative Post 60ms-Preoperative |
-3.79±1.40 -4 (-6.25:-1.0) 1.39±1.40 1.25 (-2.5:4.25) |
-5.90±1.5 -5.75 (-8.85:-3) 2.23±1.16 2.25 (0:4.5) |
<0.0001 0.01 |
|
SE: Preoperative Post 60ms-Preoperative |
-6.06±1.35 -6.13 (-8.0:-3.25) 3.04±1.16 3.13 (1.0:5.13) |
-11.99±2.29 -12.5 (-16:-6.75) 5.28±1.62 5.13 (2.63:10.13) |
<0.0001 <0.0001 |
|
DEQ: Preoperative Post 60ms-Preoperative |
-4.16±1.18 -4.25 (-6.75:-1.5) -1.81±1.14 -1.5 (-4.5:-0.25) |
-9.04±2.26 -9.25 (-13.25:-4) -4.87±1.91 -5 (-8.25:-1) |
<0.0001 <0.0001 |
|
K1: Preoperative Post 60ms-Preoperative |
47.06±1.98 46.92 (43:51.28) -2.50±1.81 -2.75 (-7.63:1.41) |
52.78±3.51 52.25 (47.57:64.7) -5.63±3.80 -4.63 (-15.25:0.32) |
<0.0001 <0.0001 |
|
K2: Preoperative Post 60ms-Preoperative |
51.64±2.35 51.36 (47.86:56.86) -3.29±2.44 -3.17 (-11:1.81) |
58.56±2.63 58.23 (55.2:68.3) -7.19±3.70 -6.1 (-14.06:-1.96) |
<0.0001 <0.0001 |
|
Kaverageanterior: Preoperative Post 60ms-Preoperative |
49.35±1.76 48.95 (46.59:53.01) -2.89±1.69 -2.51 (-6.77:0.79) |
55.67±2.80 55.19 (53.06:66.5) -6.41±3.48 -5.97 (-14.21:-1.68) |
<0.0001 <0.0001 |
|
K max: Preoperative Post 60ms-Preoperative |
56.34±4.76 55.45 (49.78:72.18) -3.16±2.44 -3.18 (-12.09:0.61) |
61.03±3.83 60.15 (52.78:72.93) -6.28±2.97 -6.21 (-13.51:-0.33) |
<0.0001 <0.0001 |
|
Kaverageposterior: Preoperative Post 60ms-Preoperative |
-7.56±0.51 -7.5 (-9.1:-6.8) 0.56±0.18 0.50 (0.30:1.00) |
-9.74±1.05 -9.9 (-11.3:-8) 0.76±0.24 0.70 (0.40:1.2) |
<0.0001 <0.0001 |
|
Pachymetry: Preoperative Post 60ms-Preoperative |
440.5±38.07 445 (372:517) -14.86±14.77 -10 (-76:-4) |
392.4±11.01 394 (370:433) -18±24.51 -13 (-51:91) |
<0.0001 0.06 |
|
Variables Mean ± SD Median (range) |
S-subgroup N=35 eyes |
I-subgroup N=16 eyes |
P-subgroup N=19 eyes |
P all | P1 | P2 | P3 | |
|---|---|---|---|---|---|---|---|---|
| UDVA | Preoperative | 1.11±0.27 1 (0.7:1.7) |
1.21±0.25 1.15 (0.8:1.7) |
1.4±0.26 1.5 (1.0:1.7) |
0.002 | 0.21 | 0.001 | 0.04 |
| Post 60ms | 0.54±0.22 0.5 (0.2:1.0) |
0.45±0.19 0.45 (0.2:0.9) |
0.93±0.22 0.9 (0.5:1.4) |
0.0001 | 0.15 | 0.0001 | 0.0001 | |
| Post 60ms-Preop | -0.57±0.17 -0.6 (-0.9:-0.3) |
-0.75±0.16 -0.8 (-1:-0.4) |
-0.47±-0.16 -0.5 (-0.9:-0.2) |
0.0001 | 0.001 | 0.048 | 0.0001 | |
| CVDA | Preoperative | 0.42±0.18 0.4 (0:0.7) |
0.44±0.17 0.45 (0.2:0.9) |
0.55±0.20 0.06 (0.1:0.9) |
0.05 | 0.94 | 0.02 | 0.06 |
| Post 60ms | 0.16±0.10 0.2 (0:0.3) |
0.13±0.12 0.1 (0:0.5) |
0.29±0.10 0.3 (0.1:0.6) |
0.0001 | 0.17 | 0.0001 | 0.0001 | |
| Post 60ms-Preop | -0.26±0.11 -0.3 (-0.5:0) |
-0.31±0.08 -0.3 (-0.4:-0.2) |
-0.26±0.15 -0.3 (-0.5:0) |
0.25 | 0.09 | 0.97 | 0.25 | |
| Sphere | Preoperative | -5.35±2.41 -4.75 (-11.5:-1.5) |
-6.14±3.07 -4.88 (-11.5:-2.5) |
-8.78±2.82 -9 (-13.25:-3.5) |
0.001 | 0.59 | 0.0002 | 0.02 |
| Post 60ms | -2.61±1.89 -2 (-7.25:-0.25) |
-2.59±1.70 -2 (-6:-0.25) |
-5±2.14 -5 (-8.25:-1.25) |
0.0001 | 0.68 | 0.0003 | 0.003 | |
| Post 6ms-Preop | 2.73±1.28 2.75 (0.75:5.25) |
3.54±1.63 2.75 (1.75:7.0) |
3.78±1.71 3.75 (0.75:0.9) |
0.05 | 0.15 | 0.02 | 0.44 | |
| Ref Cyl | Preoperative | -4.58±1.77 -4.5 (-8.25:-1) |
-4.49±2.11 -4 (-8.85:-1.5) |
-5.41±1.51 -5.5 (-8.25:-2.25) |
0.14 | 0.56 | 0.10 | 0.08 |
| Post 60ms | -2.7±1.10 -3 (-5.5:0.25) |
-2.20±1.14 -2 (-6:-0.5) |
-4.20±1.08 -4.25 (-6.5:-2.25) |
0.0001 | 0.04 | 0.0001 | 0.0001 | |
| Post 60ms-Preop | 1.86±1.55 1.5 (-2.5:4.25) |
2.29±0.96 2.13 (1:4.5) |
1.21±1.06 1 (-1.25:2.75) |
0.03 | 0.26 | 0.09 | 0.007 | |
| SE | Preoperative | -7.64±2.84 -7.25 (-14.25:-3.25) |
-8.39±3.67 -6.69 (-15.25:-4.25) |
-11.48±3.20 -12.5 (-16:-4.63) |
0.001 | 0.69 | 0.0003 | 0.02 |
| Post 60ms | -3.97±2.01 -3.25 (-8.88:-0.75) |
-3.70±2.08 -3 (-7.5:-0.5) |
-7.10±2.33 -7.75 (-10:-2.38) |
0.0001 | 0.55 | 0.0001 | 0.0003 | |
| Post 60ms-Preop | 3.67±1.58 3.5 (1.13:7.13) |
4.69±1.80 4.06 (2.38:8.75) |
4.38±2.00 4.5 (1:10.13) |
0.16 | 0.08 | 0.19 | 0.86 | |
| K1 | Preoperative | 49.01±3.80 48.65 (43.75:64.7) |
49.05±3.40 48.59 (43:54.63) |
51.73±4.35 51.69 (44:59.75) |
0.04 | 1.00 | 0.049 | 0.14 |
| Post 60ms | 45.36±2.47 45 (41:52.8) |
45.70±3.26 45.88 (40.16:50.56) |
46.63±3.93 45.19 (41.12:53.43) |
0.36 | 1.00 | 0.47 | 1.00 | |
| Post 60ms-Preop | -3.65±3.00 -3.06 (-11.9:0.05) |
-3.35±2.79 -3.97 (-8.09:1.41) |
-5.1±4.05 -4.25 (-15.25:-0.65) |
0.38 | 0.94 | 0.21 | 0.22 | |
| K2 | Preoperative | 53.93±4.17 53.42 (48.11:68.3) |
54.27±4.14 54.25 (49.1:61.18) |
57.23±3.81 58.11 (47.86:63.12) |
0.02 | 1.00 | 0.02 | 0.11 |
| Post 60ms | 49.35±3.12 48.15 (44.79:56.1) |
49.15±3.88 50.05 (42.49:55.17) |
51.08±3.33 52 (46.11:57.15) |
0.15 | 1.00 | 0.23 | 0.29 | |
| Post 60ms-Preop | -4.58±3.73 -3.76 (-14.06:1.81) |
-5.12±2.98 -4.94 (-12.37:0.17) |
-6.15±3.93 -4.94 (-13.17:-0.32) |
0.20 | 0.24 | 0.11 | 0.53 | |
| K averageanterior | Preoperative | 51.47±3.78 50.90 (46.81:66.5) |
51.66±3.50 52.01 (46.59:57.91) |
54.48±3.86 55.19 (46.88:60.16) |
0.02 | 1.00 | 0.02 | 0.09 |
| Post 60ms | 47.36±2.53 46.84 (42.96:54.45) |
47.43±3.16 47.15 (42.16:51.87) |
48.85±3.23 47.71 (44.3:54.20) |
0.17 | 1.00 | 0.22 | 0.45 | |
| Post 60ms-Preop | -4.11±3.03 -3.02 (-12.29:-0.56) |
-4.23±2.63 -4.35 (-9.06:0.79) |
-5.63±3.80 -4.64 (-14.21:-1.25) |
0.26 | 0.45 | 0.12 | 0.37 | |
| K max | Preoperative | 58.10±5.39 57.35 (50.26:72.93) |
58.06±5.22 57.83 (49.78:69.25) |
59.79±3.59 59.78 (52.95:67.17) |
0.44 | 1.00 | 0.70 | 0.91 |
| Post 60ms | 53.54±4.63 4.63 (48.04:72.21) |
53.19±3.82 52.31 (48:60.11) |
55.24±3.09 54.37 (50.86:61.21) |
0.26 | 1.00 | 0.45 | 0.44 | |
| Post 60ms-Preop | -4.56±3.44 -4.13 (-13.51:0.61) |
-4.87±3.27 -3.57 (-12.27:-1.18) |
-4.56±2.38 -5 (-8.33:-0.1) |
0.90 | 0.75 | 0.66 | 0.97 | |
| K averageposterior | Preoperative | -8.2±1.2 -7.7 (-10.9:-6.8) |
-8.21±1.22 -7.85 (-11.2:-6.9) |
-9.63±1.24 -9.7 (-11.3:-7.6) |
0.009 | 1.00 | 0.03 | 0.02 |
| Post 60ms | -7.6±1.08 -7.1 (-10.2:-6.5) |
-7.38±1.06 -7.05 (-10.1:-6.4) |
-9.01±1.13 -9.1 (-10.6:-7.1) |
0.002 | 1.00 | 0.01 | 0.008 | |
| Post 60ms-Preop | 0.60±0.21 0.6 (0.3:1.2) |
0.83±0.24 0.8 (0.5:1.2) |
0.62±0.18 0.6 (0.4:1.1) |
0.003 | 0.03 | 0.45 | 0.005 | |
| Pachynetry | Preoperative | 422.7±39.91 415 (370:494) |
418.1±36.60 401 (374:494) |
408.6±33.09 398 (374:517) |
0.42 | 1.00 | 0.58 | 1.00 |
| Post 60ms | 411.7±42.63 405 (339:485) |
401.8±40.83 392 (364:491) |
373.8±35.18 361 (334:482) |
0.004 | 1.00 | 0.005 | 0.02 | |
| Post 60ms-Preop | -10.94±11.65 -9 (-76:-4) |
-16.31±28.98 -8.5 (-53:91) |
-34.74±7.32 -33 (-51:-26) |
0.0001 | 0.66 | 0.0001 | 0.0001 | |
| Parameters |
Postoperative 12m - Preoperative Mean ± SD Median (Range) |
Postoperative 48m - Postop 12m Mean ± SD Median (Range) |
Postoperative 60m - Postop 48m Mean ± SD Median (Range) |
Postoperative 60m - Postop 12m Mean ± SD Median (Range) |
Difference (post 60m-pre) Mean ± SD Median (Range) |
P-value |
|---|---|---|---|---|---|---|
| UDVA | -0.88±0.16 -0.9 (-1.3:-0.7) |
0.11±0.03 0.1 (0.1:0.2) |
0.31±0.12 0.3 (0.1:0.6) |
0.42±0.12 0.4 (0.2:0.7) |
-0.47±0.16 -0.5 (-0.9:-0.2) |
<0.0001 |
| P1=0.0001, P2=0.0001, P3=0.002 | ||||||
| CDVA | -0.36±0.13 -0.4 (-0.6:-0.1) |
0.01±0.05 0 (0:0.2) |
0.09±0.05 0.1 (0:0.2) |
0.11±0.07 0.1 (0:0.3) |
-0.26±0.15 -0.3 (-0.5:0) |
<0.0001 |
| P1=0.0001, P2=0.0001, P3=0.0001 | ||||||
| Sphere | 4.70±1.71 4.75 (2.25:9.5) |
-0.20±0.20 -0.25 (-0.5:0.25) |
-0.72±0.43 -0.75 (-1.5:-0.25) |
-0.92±0.46 -0.75 (-1.75:-0.5) |
3.78±1.71 3.75 (0.75:9) |
<0.0001 |
| P1=0.0001, P2=0.0001, P3=0.59 | ||||||
| Cylinder | 2.52±1.03 2.5 (0.25:4) |
-0.43±0.45 -0.5 (-1:0.5) |
-0.88±0.50 -0.75 (-1.75:0) |
-1.32±0.67 -1.5 (-2.5:-0.25) |
1.21±1.06 1 (-1.25:2.75) |
<0.0001 |
| P1=0.0001, P2=0.0001, P3=0.01 | ||||||
| SE | 5.9±1.93 5.88 (2.88:10.75) |
-0.41±0.29 -0.50 (-1:0) |
-1.16±0.56 -1.13 (-2.25:-0.5) |
-1.58±0.57 -1.5 (-2.63:-0.63) |
4.38±2.00 4.5 (1:10.13) |
<0.0001 |
| P1=0.0001, P2=0.0001, P3=0.19 | ||||||
| K1 | -6.12±4.00 -5.48 (-16.22:-1.7) |
0.53±0.28 0.45 (0.18:1.04) |
0.50±0.29 0.58 (-0.05:0.83) |
1.02±0.20 0.99 (0.71:1.53) |
-5.1±4.05 -4.25 (-15.25:-0.65) |
<0.0001 |
| P1=0.0001, P2=0.0001, P3=0.02 | ||||||
| K2 | -7.49±4.00 -6.22 (-14.57:-1.62) |
0.59±0.43 0.75 (-0.95:0.94) |
0.76±0.44 0.65 (0.04:1.72) |
1.34±0.39 1.36 (0.6:2.49) |
-6.15±3.93 -4.94 (-13.17:-0.32) |
<0.0001 |
| P1=0.0001, P2=0.0001, P3=0.84 | ||||||
| Kaverageanterior | -6.81±3.78 -5.87 (-14.99:-2.45) |
0.56±0.19 0.52 (0.05:0.95) |
0.63±0.24 0.63 (0.1:1.06) |
1.18±0.21 1.2 (0.79:1.63) |
-5.63±3.80 -4.64 (-14.21:-1.25) |
<0.0001 |
| P1=0.0001, P2=0.0001, P3=0.003 | ||||||
| K max | -6.58±2.68 -9.36 (-12.65:-1.53) |
0.71±0.09 0.70 (0.46:0.87) |
1.31±1.10 0.76 (0.46:3.77) |
2.02±1.13 1.45 (1.13:4.42) |
-4.56±2.38 -5 (-8.33:-0.1) |
<0.0001 |
| P1=0.0001, P2=0.0001, P3=0.10 | ||||||
| Kaverageposterior | 1.1±0.26 0.9 (0.6:1.5) |
-0.27±0.09 -0.3 (-0.4:-0.1) |
-0.11±0.07 -0.1 (-0.2:0) |
-0.38±0.13 -0.4 (-0.6:-0.1) |
0.62±0.18 0.6 (0.4:1.1) |
<0.0001 |
| P1=0.0001, P2=0.0001, P3=0.003 | ||||||
| Pachymetry | -4.26±3.12 -3 (-11:1) |
-6.58±5.81 -5 (-23:-2) |
-23.58±10.05 -23 (-42:-4) |
-30.47±7.22 -29 (-48:-19) |
-34.74±7.32 -33 (-51:-26) |
<0.0001 |
| P1=0.002, P2=0.0001, P3=0.001 | ||||||
Table 8 summarizes the postoperative differences between groups A and B regarding outcomes of the eyes in the P-subgroup. At postoperative month 60, we recorded that the B group revealed statistically significant differences with greater deterioration in its P-subgroup eyes than in group A in all parameters except CDVA and pachymetry (p=0.13 and 0.19 respectively, Table 8).
3.1.4. Statistical Outcomes of Suggested New Values to Document PR-KCP
All eyes in P-subgroup showed a mean deterioration of 0.71 D in Kmax at 48m. Furthermore, all eyes revealed a loss of one line or more of UDVA with a mean deterioration of 0.18 logMAR at 48m at a time when Kmax deterioration ranged from 0.46 D to 0.87 D, i.e., Kmax did not exceed 1 D (Table 7). Therefore, we did not document KCP at 48m. In addition, all eyes revealed deterioration in a mean sphere, cylinder, SE, K1, K2, Kaverageanterior, and Kaverageposterior of -0.20, -0.43, -0.41, 0.39, 0.59, 0.49, and -0.27 D, respectively, at 48m (Table 7). Moreover, CCT showed a mean loss of 6.58 µm (1.6% of baseline postoperative thickness) at 48 months (Table 7).
|
Variable Mean ± SD Median (range) |
P-subgroup in group A n=4 eyes (21.05%) |
P-subgroup in group B n=15 eyes (78.95%) |
P-value |
|---|---|---|---|
| UDVA: Preoperative Post 60m-Preoperative |
1.08±0.10 1.05 (1.0:1.2) -0.33±0.15 -0.3 (-0.5:-0.2) |
1.49±0.21 1.5 (1.0:1.7) -0.51±0.14 -0.5 (-0.9:-0.3) |
0.002 0.08 |
| CDVA: Preoperative Post 60m-Preoperative |
0.38±0.25 0.35 (0.1:0.7) -0.15±0.17 -0.1 (-0.4:0) |
0.6±0.16 0.6 (0.3:0.9) -0.29±0.13 -0.3 (-0.5:-0.1) |
0.09 0.13 |
| Sphere: Preoperative Post 60m-Preoperative |
-4.44±0.72 -4.5 (-5.25:-3.5) 1.88±0.85 2 (0.75:2.75) |
-9.93±1.81 -10.25 (-13.25:-7.25) 4.28±1.52 3.75 (2.75:9) |
0.003 0.003 |
| Refractive Cylinder: Preoperative Post 60m-Preoperative |
-3.63±1.25 -3.5 (-5.25:-2.25) 0.06±0.90 0.38 (-1.25:0.75) |
-5.88±1.19 -5.5 (-8.25:-4.25) 1.51±0.89 1.5 (0:2.75) |
0.01 0.02 |
| SE Preoperative Post 60m-Preoperative |
-6.25±1.18 -6.63 (-7.13:-4.63) 1.91±0.89 1.75 (1.0:3.13) |
-12.88±1.72 -12.88 (-16:-9.75) 5.04±1.67 4.63 (3.25:10.13) |
<0.0001 0.003 |
| K1: Preoperative Post 60m-Preoperative |
45.37±1.00 45.59 (44:46.28) -2.21±1.14 -2.43 (-3.31:-0.65) |
53.42±3.09 53.25 (48.89:59.75) -5.87±4.21 -4.63 (-15.25:-1.2) |
0.0001 0.09 |
| K2: Preoperative Post 60m-Preoperative |
51.40±3.06 51.21 (47.86:55.34) -2.29±1.57 -2.45 (-3.74:-0.32) |
58.78±2.09 59.13 (55.7:63.12) -7.18±3.73 -6.1 (-13.17:-2.33) |
<0.0001 0.01 |
| Kaverageanterior: Preoperative Post 60m-Preoperative |
48.38±1.16 48.50 (46.88:49.67) -2.25±0.74 -2.36 (-3.01:-1.25) |
56.10±2.33 56.21 (53.1:60.16) -6.53±3.79 -5.97 (-14.21:-1.77) |
<0.0001 0.01 |
| K max: Preoperative Post 60m-Preoperative |
55.56±2.72 55.15 (52.95:58.99) -1.97±2.19 -1.39 (-5:-0.1) |
60.92±2.92 60.42 (54.4:67.17) -5.25±1.95 -5.2 (-8.33:-1.91) |
0.004 0.02 |
| Kaverageposterior Preoperative Post 60m-Preoperative |
-8±0.34 -8 (-8.4:-7.6) 0.5±0.08 0.5 (0.4:0.6) |
-10.6±0.99 -10.4 (-11.3:-8.5) 0.65±0.19 0.6(0.4:1.1) |
<0.0001 0.008 |
| Pachymetry: Preoperative Post 60m-Preoperative |
458.8±39.57 422.5 (433:517) -30.5±3.70 -30 (-35:-27) |
395.2±12.69 394 (374:433) -35.87±7.70 -35 (-51:-26) |
<0.0001 0.19 |
| Parameters | The known published progression values in the literature | The new suggested values for PR-KCP |
|---|---|---|
| Kmax | ≥1 D [38, 40, 41] | ≥0.75 D |
| Kaverage anterior | ≥0.75 D | ≥0.50 D |
| Kaverageposterior | - | ≥0.25 D |
| Pachymetry | ≥2% reduction in central corneal thickness [41] | ≥1.5% reduction in thinnest corneal point (CCT) |
| Cylinder | ≥1 D [40, 41] | ≥0.50 D |
| SE | ≥0.50 D [40, 41] | ≥0.40 D |
| UDVA | loss of one line or more [27] | ≥0.10 logMAR (loss of one line or more) |
| CDVA | loss of one line or more [27, 48] | ≥0.10 logMAR (loss of one line or more) |
Table 9 shows the comparison between known prior parameters' values for keratoconus progression and the suggested new values for post-ring implantation keratoconus progression (PR-KCP) depending on our statistical data analysis of the postoperative differences in-between the 3 follow-up time-points at postoperative months 12, 48, and 60 which are recorded in Table 7.
In summary, At postoperative month 60, group-B exhibited significantly higher values of all mean uncorrected distance visual acuity (UDVA), corrected distance visual acuity (CDVA), sphere/cylinder/spherical equivalent/defocus equival- ent(DEQ), and K1/K2/Kaverages/Kmax parameters compared to that of group A. However, group-A exhibited better stability of postoperative improvements. Keratoconus progression (KCP) was greater in group-B (45.5%) than group-A (10.8%)
3.2. Complications
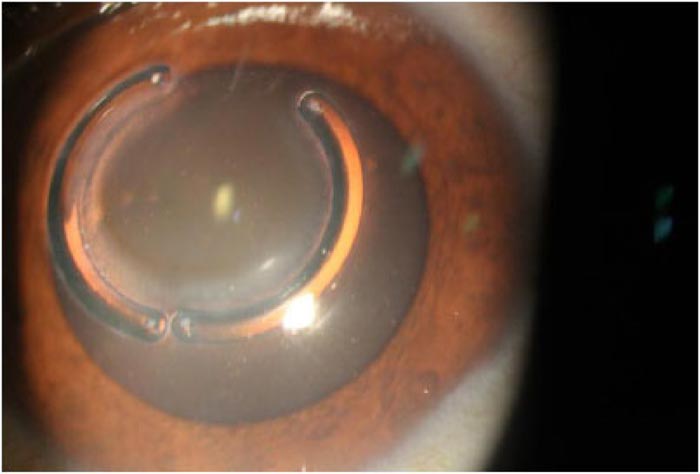
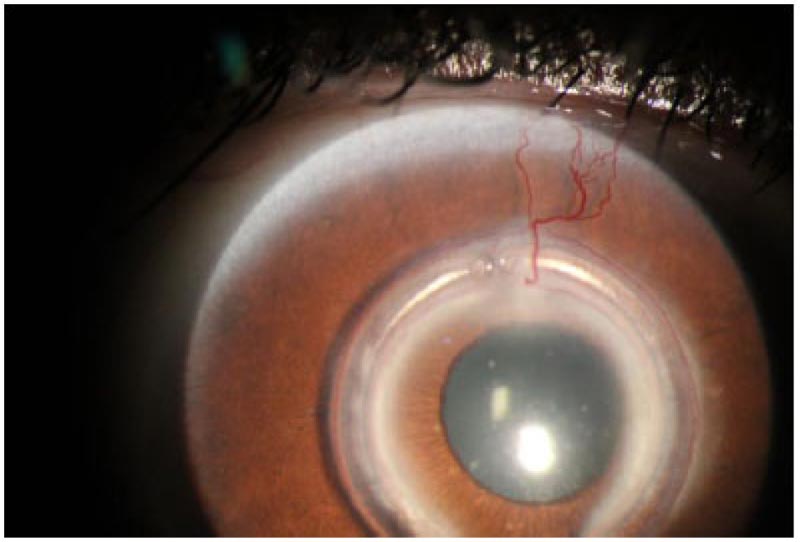
Table 10 summarises the recorded postoperative complications at postoperative month 60 and how we managed these complications. Fig. (1) shows one eye with Keraring segments' migration, while Fig. (2) shows the tunnel vascularization, opacification, and scarring of one eye with Keraring segments' migration.
4. DISCUSSION
This study included 70 eyes 70 keratoconus patients that underwent TCXL combined with Keraring segment implantation. All eyes completed at least 5 years of follow-up to be included in this study. We exhibited a high rate of complications in 20 eyes at the end of this study. Nineteen eyes with KCP, two of these 19 eyes were also complicated with additional segments' migration. Meanwhile, the twentieth eye was complicated with vascularization, opacification of the tunnel, and also segments' migration.
| Complications |
Group A N=37 eyes |
Group B N=33 eyes |
Management | Fate |
|---|---|---|---|---|
| KC progression rate | 4 (11%) |
15 (45%) |
After the end of the study: - 5 eyes in group A (CTT>400 µm) were scheduled for accelerated epithelium-off CXL retreatment. - 10 eyes in group B (CTT 350-400 µm with Kmax<2 D) were scheduled for accelerated epithelium-off CXL retreatment using hypoosmolar riboflavin solution. - 4 eyes in group B (grade 4 KC, CTT<350 µm with Kmax>3 D) were scheduled for deep anterior lamellar keratoplasty (DALK). |
The 19 eyes retreated as scheduled after the end of the study. The patients were requested to continue regular follow-up visits every 6 months. |
| Segments' migration | 1 (2.7%) |
1 (3%) |
- Both eyes with Segments' migration were also documented with postoperative KCP and were actually part of the P-subgroup - One eye in group A exhibited visual and topographic deterioration. We explanted these segments and retreated this eye with repeat epithelium off CXL. - The other eye in group B suffered from visual distortion, haloes, and glare with patient discomfort. Finally, we explanted these segments, and the patient was scheduled for DALK. |
Both eyes received their scheduled treatments after the end of the study. The patients were requested to continue regular follow-up visits every 6 months. |
| Vascularization, opacification and scarring of the tunnel associated with segments' migration | 1 (2.7%) |
- The patient data shows visual and topographic stability despite segments’ migration. - We decided to avoid surgical interference as long as this stability continues. |
Follow-up every 6 months. |
Our study demonstrated that high-grade keratoconus (grades 3 and 4 AK) yielded better postoperative outcomes in all parameters than the low-grade keratoconus (grades 1 and 2 AK). However, the high-grade keratoconus exhibited a higher rate of postoperative progression than the low-grade keratoconus (45% versus 11% respectively, P<0.0001). In particular, grades 1, 2, 3, and 4 revealed 1, 3, 5, and 10 cases of postoperative progression, respectively. Therefore, we recommend avoiding implantation of ICRS in grade 4 AK keratoconus as it has a high tendency to continue its progression postoperatively. Alternatively, if the surgeon's decision was to implant ICRS, we recommend avoiding TCXL and perform epithelium off CXL considering the use of hypotonic riboflavin solution in high-grade keratoconus.
Our findings suggest that the values regularly used to document preoperative KCP were not ideal to document postoperative KCP, especially in eyes implanted with ICRS. We could possibly have earlier documentation of PR-KCP with earlier surgical interference if the parameters were diagnostic at lower postoperative values than preoperative ones. It was discovered that all eyes that exhibited deterioration of Kmax≥0.71 D finally revealed more deterioration to exceed 1D within a few months later. Therefore, we suggested that if Kmax increases ≥0.75 D, then postoperative KCP should be documented at this level, and another retreatment option should be performed.
Furthermore, we also suggest that PR-KCP should be documented by one of two methods. The first method to document PR-KCP is based on one sole parameter only, which is either Kmax if deteriorated ≥0.75 D. The second method to document PR-KCP is based on the existence of two or more of the following parameters: Kmax≥0.50 D, Kaverageanterior≥0.50 D, Kaverageposterior ≥0.25 D, CTT ≥ 1.5% thickness reduction and UDVA or CDVA ≥0.10 logMAR (loss of one or more lines on acuity chart).
Nevertheless, at 48m, we failed to expect early PR-KCP as we depended on prior known parameters and criteria published in the literature to document progression. Unfortunately, none of the values of the current study had achieved the already known prior criteria to document KCP at 48m. Therefore, an early chance was missed to diagnose and retreat KCP. In short, UDVA showed early significant changes in P-subgroup eyes at 48m when the other known parameters did not achieve the known values that were used to document KCP. In other words, patients presented with a postoperative deterioration of UDVA should be scheduled for close follow-up on a 6-monthly basis to avoid missing early postoperative KC progression.
Alio et al. [27] reported the 5-year outcomes of their patients in a retrospective study. They determined their own criteria of success, including UDVA or CDVA gain of one or more lines, while their failure criteria included UDVA or CDVA loss of one or more lines. They concluded ICRS that revealed good results in advanced KC. However, they believed that early KC with good UDVA is a contraindication to ICRS implantation to avoid losing lines of visual acuity. They also recommended avoiding ICRS implantation in progressive KC cases and shifting to other treatment options. Their outcomes were close to ours as we also demonstrated better outcomes in high-grade than in low-grade KC. Furthermore, we demonstrated that UDVA was an early sensitive parameter to document KCP. The main difference between both studies was simply that they implanted Keraring segments in stable and progressive KC cases while we implanted Keraring segments in progressive KC cases only. In addition, we performed TCXL for all our studied eyes, which was not the case in their studied eyes.
As regards the efficacy of combined treatment with TCXL, although postoperative stability is achieved in the first few years, we demonstrated that nineteen eyes (27%) showed definite KCP at the fifth postoperative year. The only explanation of these results is the use of TCXL in our study, which maintains stability for a shorter period of time than standard Cxl.
On the other hand, in a previous study, we (Iqbal et al.) [8] documented no KCP cases for complete postoperative five years following SCXL. This significant difference in the postoperative rate of KCP in both studies proves that SCXL is more effective in the stabilization of ectatic cornea and halting KCP.
Several studies reported different rates of KCP following ICRS implantation. Saleem et al. [31] documented a 14% postoperative rate of KCP. They also reported that 2% of cases revealed spontaneous ring exposure. Our team, in previous research [37], demonstrated a 6% progression rate and 3% segments' migration rate in pediatric patients in postoperative month 18. In a couple of studies of Mounir et al. [48, 49], they reported lower segments' migration rate of 1.5% but documented no cases of postoperative progression in one study; however, their second study revealed 2% segments' extrusion rate but also documented no cases with postoperative progression. On the contrary, to our outcomes, Wild et al. [50] concluded the outcomes of implanting Keraring segments in 70 eyes. They concluded that their implantation outcomes were better in mild KC (mean K<48 D) than in severe KC (mean K>55 D). In their series eyes, they reported that 4% of cases underwent segments explantation because of corneal vascularization; however, they reported no KCP cases in 12 months follow-up period. Nevertheless, 3% of our studied eyes underwent segment explantation, while 27% of the studied eyes were documented with KCP in 60 months follow-up period.
Moreover, Elsaftawy et al. [51] compared Keraring implantation alone versus implantation of Keraring combined with TCXL in a short-term 6 months study. They finally concluded that the addition of TCXL was superior and more advantageous in postoperative improvements and halting KCP. On the contrary, we concluded that TCXL is not effective in halting KCP on long-term follow-up
An important question remains. Why did we choose TCXL instead of SXCL in this present study? The answer is simply related to the time when we operated the studied eyes. Actually, Keratoconus disease is being treated in our localities in Egypt for more than 15 years, and we now have reasonable experience in this field [8, 18, 29, 30, 35]. We started the cross-linking procedures in 2009 using SCXL alone that showed the best CXL outcomes ever in halting KCP. Unfortunately, TCXL was our main CXL procedure for almost 3 years (years 2012 to 2015) because we thought that TCXL was an equivalent procedure to SCXL in efficacy, thus avoiding the potential SCXL postoperative complications. . We acknowledge that we were wrong, and TCXL is less efficient than SCXL. The studied eyes were operated during this time-period shift and discovered that the main disadvantage of TCXL was its weak ability to halt KCP for long-term postoperative periods despite its apparent good outcomes in the early short-term postoperative period. Therefore, the SCXL treatment was again used for patients as the main CXL procedure, especially in young and pediatric patients [18].
Another important question remains. Was KCP the cause of the segments' migration in the current study? Or did the segments' migration accelerate KCP? In other words, Can the cone protrusion and displacement cause migration of the segments? Is the reverse correct? We are not sure if the postoperative progression was responsible for the segments’ migration in this study. Nevertheless, It was believed that the nature of preoperative KCP is different from postoperative one. It was observed that ICRS implantation somehow affects postoperative KCP by either slowing, masking, or accelerating it; however, the underlying mechanism of action of ICRS in the active postoperative progression is not fully understood. Several studies [27, 52, 53] demonstrated that ICRS actually induced corneal remodelling. Alio et al. [27] explained this action by the reduction in the optical aberrations due to improvement of optical properties following ICRS implantation. In addition, Ly et al. [52] used the in vivo confocal microscopy in their study and concluded that ICRSs caused the migration of the fibroblasts with lipid deposition in the extracellular matrix due to their mechanical stresses, thus inducing corneal remodelling. Moreover, Samimi et al. [53] reported that ICRS was associated with keratocyte apoptosis that might be reversible after removal of the implants. The previously reported findings also suggest fibrosis of the tunnel during the wound healing process that could partially induce corneal remodelling. However, we believe that ICRS can help either to stabilize the ectatic cornea or to accelerate postoperative KCP depending on two main factors. The first factor is associated with CXL, while the second is the accurate site and depth of ICRS implantation. TCXL had been found to be effective in halting keratoconus by many studies. This technique overcomes the limitations of a conventional protocol with higher safety and acceptable efficacy [54-56].
On the other hand, Flecha-Lescún et al. [57] theoretically hypothesized that implantation of the segments in the posterior corneal stroma could halt KCP while their implantation in the anterior corneal stroma could properly accelerate KCP. On the contrary, to this theory, Abd Elaziz et al. [58] evaluated the implantation of 355° Keraring segment in the treatment of advanced KC with central cones. They concluded that this type of segment was effective and revealed marked visual and refractive improvements. However, they stated that the actual mean 61% tunnel depth of segment insertion was superficial to their primary intension, 80% tunnel depth. Their findings oppose the theory introduced by Flecha-Lescún et al. [57], as discussed earlier.
The main limitation of our study was the unavailability of patients’ topographic data for the second and third postoperative years. Another limitation was the small number of the studied eyes. Unfortunately, both Belin [59] ABCD grading system 2016 and the new manufacturer’s Keraring nomogram version 2018 were not available when studied eyes operated before 2016. Therefore, an older Amsler-Krumeich grading system and the manufacturer’s Keraring nomogram version 2009 were used. In addition, several studies [44-47], [60-64] recommended the use of the recent Belin ABCD progression display and the BAD for diagnosis of KC progression. We actually did not test the BAD tool as it is unfortunately incorporated only in Pentacam HR (Oculus Inc., Wetzlar, Germany) while we used other types of topographers in our study.
CONCLUSION
We believe that TCXL should not be the first choice for the treatment of progressive KC. In addition, we think that ICRS implantation should not be a basic choice for the treatment of progressive KC until the condition becomes stable for a long period. We also recommend that the indication of ICRS implantation in KC is better to be limited in cases with contact lens intolerability. Furthermore, we believe that ICRS could be considered as supporting implants if the segments’ size and thickness were properly chosen and appropriately implanted. On the other hand, we think that ICRS can act as traumatising implants if not properly selected or perfectly implanted. In the two previous conditions, ICRS could help to stabilize or accelerate KCP; thus the ideal ICRS implants do not exist. Moreover, we think that grade 4 KC should be considered as a contraindication to ICRS implantation as we documented 52.6% of KCP eyes (10 out of 19 eyes) in this grade 4 alone in comparison to other grades. We now believe that the prior known values of the parameters determining preoperative KCP are actually underestimating the real postoperative progression. Therefore, we recommend lowering these values for documenting postoperative KCP to start an early second intervention to halt such progression.
ETHICS APPROVAL AND CONSENT TO PARTICIPATE
This retrospective cohort study is approved by the Institutional Review Board of the Sohag Faculty of Medicine, Sohag University, Egypt. under ethical approval no. (IRB-8-8/4/2019).
HUMAN AND ANIMAL RIGHTS
No Animals were used in this research. All human research procedures followed were in accordance with the ethical standards of the committee responsible for human experimentation (institutional and national), and with the Helsinki Declaration of 1975, as revised in 2013.
CONSENT FOR PUBLICATION
Informed consent was taken from all the patients when they were enrolled.
AVAILABILITY OF DATA AND MATERIALS
The patients’ data used to support the findings of this study are available from the corresponding author [A.M] upon request.
FUNDING
None.
CONFLICT OF INTEREST
The authors declare no conflict of interest, financial or otherwise.
ACKNOWLEDGEMENTS
We would like to thank Dr. Mona Abo-Ali, Mr. Hamza Mohammed, Mr. Seif Mohammed, and Ms. Lina Mohammed for the assistance in this research. We are grateful for Prof. Fouad Metry Yosef, the expert statistician who performed all statistical analyses. We are also grateful for the help and support of the EPK Group.

