All published articles of this journal are available on ScienceDirect.

Comparison of Four Intraocular Power Calculation Formulas in Keratoconus Eyes
Authors Info & Affiliations
Abstract
Introduction:
This study aimed to evaluate the differences in Intraocular Lens (IOL) power in keratoconus (KC) eyes between calculations obtained clinically with the most commonly used formulas in healthy eyes (SRK T, Holladay 1, Hoffer Q and Haigis) as well as to define predictive factors for such differences.
Methods:
This retrospective study comprised 43 keratoconus eyes of 22 patients with no previous ocular surgery. IOL powers were calculated with SRK T, Holladay 1, Hoffer Q, and Haigis formulas, considering the Effective Lens Position (ELP) of each formula and the desired refraction of 0 D (Rdes=0 D).
Results:
All differences between formulas were statistically significant and clinically relevant. Haigis formula always provided higher values compared to the rest of the formulas, with the highest differences observed when comparing Haigis with Hoffer (0.84 D) and Hoffer Q (1.17 D) formulas. The lowest difference was obtained for the comparison between SRK-T and Holladay 1 formulas (0.22 D). Differences of the Haigis formula compared to the rest were higher as the magnitude of the IOL power calculated decreased, becoming the patient more myopic. Increased differences between Haigis and Hoffer formulas were observed in eyes with deep anterior chambers, steeper anterior and posterior corneal surfaces, and high axial lengths.
Conclusion:
The most comparable results in IOL power in keratoconus are provided by the Holladay 1 and SRK T formulas, whereas the Haigis formula provides the most discrepant outcome. The consideration of the curvature of the second corneal surface in IOL power calculations in keratoconus may decrease the variability between calculation methods. However, other factors as anterior chamber depth or axial length are also relevant.
1. INTRODUCTION
The calculation of the power of the Intraocular Lens (IOL) to implant in keratoconus (KC) eyes is still a challenge for cataract surgeons. Corneal power has been found to be a critical factor for an accurate calculation of the IOL power in such cases [1-4]. Leccisotti et al. [2] showed that 26% of eyes with KC required an immediate IOL exchange intraoperatively due to the presence of a residual refractive error of more than 1.5 D and 6% of eyes required IOL exchange postoperatively because of the difficulty in obtaining a predictable correction due to difficulties in IOL power calculation. These inaccurate calculations may be due to the longer axial length and deeper anterior chamber of KC eyes [4-7] or even to a potentially more relevant contribution of the second corneal surface [8, 9]. Some solutions have been considered for avoiding these inaccuracies. Watson et al. [3] proposed to introduce target refraction between −1.0 D and −1.5 D when performing calculations with the SRK T formula in eyes with mild and moderate KC, respectively. However, this modification of target refraction in severe KC, despite using a mean value of −5.4 D, was shown to provide a mean postoperative hyperopic refraction of +6.8 D. The authors concluded that the use of keratometry (K) values in IOL power calculations in severe KC can induce a large residual hyperopic error [3]. This confirms that corneal power in keratoconus is a key point in IOL power calculations in keratoconus. Although the optical contribution of the second corneal surface has been demonstrated to be relevant [10], most of the commercial formulas for IOL power calculation are still currently using only anterior corneal radius to estimate total corneal power. Our research group has published several articles evaluating the errors introduced when the keratometric corneal power approach is used in KC [10-12], demonstrating that these errors can lead to significant errors in keratoconus classifications [13] and the estimation of IOL power [14].
Differences between formulas to determine the power of an IOL in keratoconus have not been extensively studied. Thebpatiphat et al. [1] compared the SRK, SRK II, and SRK T formulas, reporting a more accurate IOL power calculation in patients with mild keratoconus using the SRK II formula, but they did not find significant differences between formulas in patients with moderate-to-severe KC. Hashemi et al. [15] compared the outcomes with SRK II, SRK/T, Holladay 1, and Hoffer Q formulas in KC, indicating that the SRK/T formula for mild and moderate KCN groups and the SRK/T and SRK II formulas for severe KCN groups led to the most predictable IOL power calculations. Savini and coauthors [16] reported in another comparative study that the SRK/T was the most accurate formula in KC, with worse results in advanced stages of the disease. Recently, Kane and coauthors [17] found in a comparative study that the lower mean absolute prediction error (MAE) in keratoconus was obtained when using the Kane formula (0.81 D) compared to SRK/T (1.00 D), Barrett Universal 2 (1.03 D), unmodified Kane (1.05 D), Holladay 1 (1.18 D), unmodified Holladay 2 (1.19 D), Haigis (1.22 D), Hoffer Q (1.30 D), and Holladay 2 with keratoconus adjustment (1.32 D). The aim of the current study was to analyse the differences in IOL power between different conventional formulas commonly used for healthy eyes in a large sample of KC eyes and to define predictive factors for such differences.
2. METHODS
2.1. Subjects
A total of 43 eyes of 22 patients, 16 men and 27 women, were enrolled in this retrospective study. Keratoconus eyes were classified using the Rabinowitz criteria that considered the presence of an asymmetric bowtie corneal topography with or without skewed combined with at least one of the following biomicroscopic signs: significant corneal thinning, apex conical protrusion, Fleischer ring, or Vogt striae [10]. Eyes with any type of previous eye surgery, corneal opacity and/or active ocular diseases were excluded from the study. This study was conducted following the tenets of the Declaration of Helsinki, being approved by the Ethics Committee of the University of Alicante, and all patients signed a consent allowing the use of their data for this retrospective analysis.
In all patients, the same eye exam was conducted that included manifest refraction (SE, spherical equivalent), Distance Visual Acuity (CDVA), Goldman tonometry, slit-lamp biomicroscopy, evaluation of eye fundus, optical biometry (IOL Master 500, software 7.08, Carl Zeiss, Meditec AG, Jena, Germany) and the study of the corneal structure using a Scheimpflug photography-based tomographer, the Pentacam HR system (Oculyzer II, Wavelight, Erlangen, Germany). The following parameters were extracted from the tomography measurement and used for our analyses: first (r1c) and second corneal radius (r2c) in central 3-mm corneal area, Axial Length (AL), anterior (ACA) and posterior corneal astigmatism (PCA), minimum (MCT) and central corneal thickness (CCT), keratometric corneal power calculated using the keratometric index of 1.3375 (Pk(1,335)), and Anterior Chamber Depth (ACD). In addition, first surface corneal power (P1c), second surface corneal power (P2c), and the total Gaussian corneal power (
2.2. IOL Power Calculation
IOL powers were calculated using four conventional formulas (SRK T [18, 19], Haigis [20], Hoffer Q [21], and Holladay 1 [22]) using the ELP estimation defined for each formula and considering the desired refraction of 0 D (Rdes=0 D). All IOL power formulas calculations were implemented in an Excel sheet (Excel, version 2016 for Windows).
2.3. Statistical Analysis
The SPSS statistics software package version 21.0.0.0 for Windows (IBM, Armonk, NY, USA) was used in all cases. The Kolmogorov-Smirnov test was used to assess the normality of data samples. The student t-test for paired data was used to compare the normally distributed data obtained with different IOL power calculation formulas. In contrast, the Wilcoxon rank-sum test was used for the comparative analysis of non-normally distributed data. Differences were considered statistically significant when the associated p-value was less than 0.05. The Bland-Altman analysis was used for assessing the interchangeability of IOL power calculations obtained with different pairs of formulas. Correlations between differences among IOL power formulas and clinical parameters were investigated using the Pearson or Spearman correlation coefficients depending if the data used were normally distributed or not.
3. RESULTS
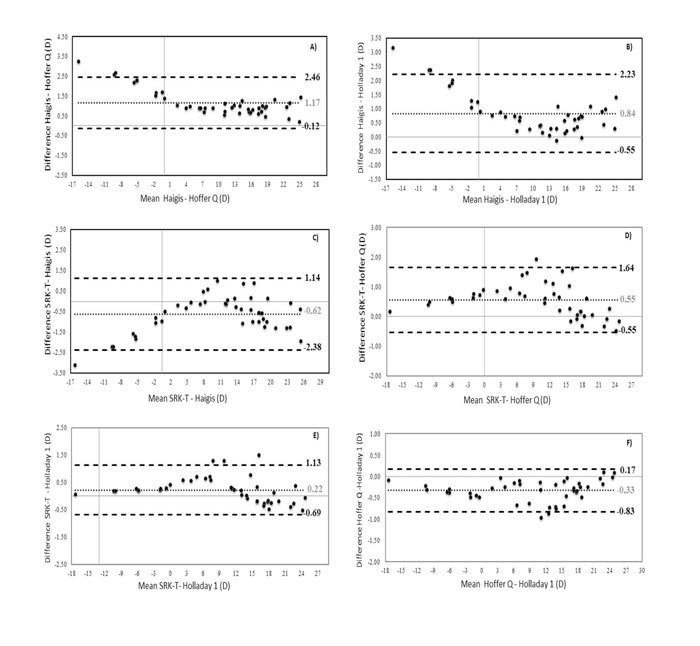
Table 1 shows the mean ocular features of the sample of 43 keratoconus eyes considered in the current study. According to the Amsler-Krumeich grading system, a total of 27 eyes (62.8%) had a KC grade I, 7 eyes (16.3%) had a grade II KC, 2 eyes (4.7%) had a grade III KC, and 7 eyes (16.3) had a grade IV KC. The mean value and standard deviation of the IOL power calculated with the different formulas used are shown in Table 2. The interval corresponding to the minimum and maximum values is also presented. The differences between the formulas and standard deviation with their corresponding p-values are shown in Table 3. As shown in Table 3, all differences between formulas were statistically significant. The highest differences were obtained for the Haigis formula when compared to the rest of the formulas. Specifically, the Haigis formula always provided an overestimation compared to the rest of the formulas, with the highest difference found when comparing Haigis with Holladay (0.84±0.71, range -0.1, 3.2 D) and Hoffer Q formulas (1.17±0.66 D, range 0.2, 3.3 D). The lowest differences were obtained for the comparison between Holladay 1 and Hoffer Q formulas (-0.33±0.25 D, range -1.0, 0.1 D) as well as between SRK T and Holladay 1 (0.22 ±0.46 D, range -0.5, 1.5 D).
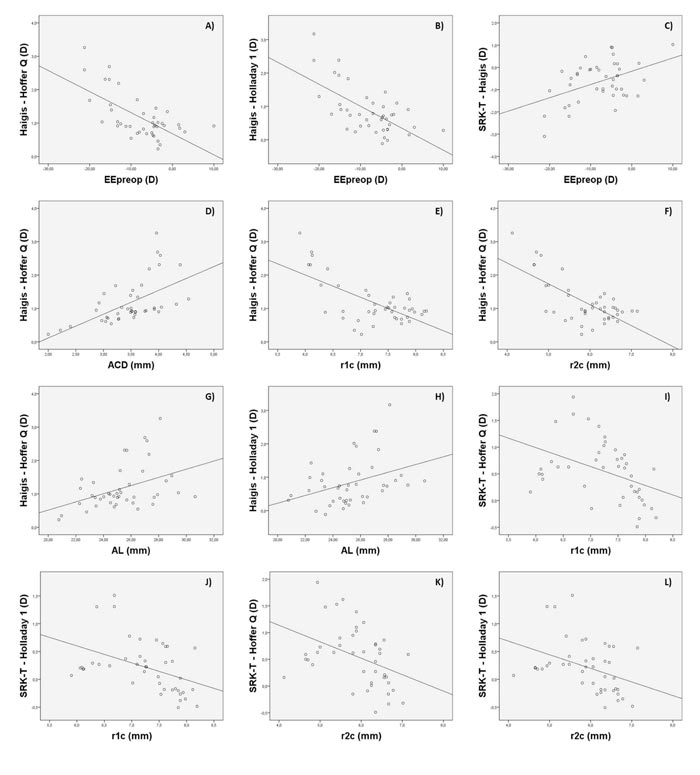
The Bland-Altman plots were calculated in order to know if these differences were clinically significant as well. As shown in Figs. (1A-1F), all ranges of the agreement were higher than 0.5 D and can be considered clinically significant. In figures 1A, 1B, and 1C, the Haigis formula is shown to overestimate the IOL power compared to the results obtained with the Hoffer Q, Holladay 1, and SRK T formulas, obtaining higher overestimations as the calculated IOL power decreased. In fact, differences between IOL power calculations with these formulas were found to be correlated with the magnitude of IOL power (r=-0.57, r=-0.45, r=0.44; p<0.001, respectively). Likewise, these differences were also found to be correlated with SE (r=-0.54 and r=-0.54, r=-0.45; p<0.001, respectively). These correlations indicate that lower SE (myopic eyes) was associated with higher levels of IOL power overestimation (Figs. 2A-C).
| Parameter | Mean (SD) | [Min, Max] |
|---|---|---|
| Age (years) | 47.72 (14.23) | [20, 76] |
| Pk (1.3375) (D) | 46.97 (4.5) | [41.2, 57.2] |
| P1c (D) | 52.33 (5.03) | [45.9, 63.7] |
| P2c (D) | -6.88 (0.94) | [-9.7, -5.6] |
| PcGauss (D) | 45.57 (4.16) | [40.3. 54.2] |
| SE (D) | -7.80 (6.83) | [-21.25, 10.0] |
| ACA (D) | 3.33 (2.59) | [0.3, 14.7] |
| PCA (D) | 0.75 (0.65) | [0.1, 4.1] |
| MCT (µm) | 454 (58.99) | [295, 547] |
| CCT (µm) | 475 (52.77) | [309, 570] |
| AL (mm) | 25.35 (2.21) | [20.8, 30.6] |
| ACD (mm) | 3.48 (0.54) | [2, 4.5] |
| r1c (mm) | 7.3 (0.65 | [5.9, 8.2] |
| r2c (mm) | 5.9 (0.73) | [4.1, 7.1] |
| Keratometric corneal power measured for nk=1,3375 (Pk (1.3375) ); Anterior corneal power (P1c); Posterior corneal power (P2c); Gaussian corneal power (PcGauss); Spherical equivalent (SE); Anterior corneal astigmatism (ACA); Posterior corneal astigmatism (PCA); Minimum corneal thickness (MCT); Central corneal thickness /CCT); Axial length (AL); Anterior corneal depth (ACD); anterior corneal radius (r1c); posterior corneal radius (r2c). | ||
| IOL formula | Mean (SD) | [Min, Max] | Median (D) |
|---|---|---|---|
| SRK T | 9.78 (10.53) D | [-17.3, 24.7] D | 11.08 D |
| Haigis | 10.41 (10.17) D | [-14.2, 25.8] D | 11.34 D |
| Hoffer Q | 9.37 (10.68) D | [-17.5, 24.8] D | 10.58 D |
| Holladay 1 | 9.60 (10.55) D | [-17.4, 24.7] D | 10.94 D |
| Differences | Mean (SD) | [Min, Max] | 95 CI | p-value |
|---|---|---|---|---|
| Haigis-Hoffer (D) | 1.17 (0.66) D | [0.2, 3.3] D | [0.76, 1,38] | <0.001 |
| Haigis-Holladay 1 (D) | 0.84 (0.71) D | [-0.1, 3.2] D | [0.62, 1,06] | <0.001 |
| Hoffer-Holladay 1 (D) | -0.33 (0.25) D | [-1.0, 0.1] D | [-0.44, -0.01] | 0.037 |
| SRK T – Haigis (D) | -0.62 (0.90) D | [-3.1, 1.0] D | --- | <0.001 |
| SRK T – Hoffer (D) | 0.55 (0.56) D | [-0.5, 1.9] D | --- | <0.001 |
| SRK T – Holladay 1 (D) | 0.22 (0.46) D | [-0.5, 1.5] D | --- | <0.001 |
In addition, differences between Haigis and Hoffer Q formulas also correlated with ACD (r=0.62, p<0.001), showing that for higher ACD values, the increase in the difference between these two formulas was higher (Fig. 2D). Likewise, these differences between formulas also correlated with r1c and r2c (r=0.48 and r=-0.44; p<0.001, respectively), showing that for lower values of r1c and r2c (steepest corneal radius), and therefore higher values of P1c and P2c, the trend to overestimation of Haigis compared to Hoffer Q was also higher (Figs. 2E and 2F). Differences of Haigis with Holladay 1 and Hoffer Q formulas were also correlated with AL (r=0.42 and r=0.40; p<0.001, respectively), indicating that higher levels of discrepancy were expected in longer eyes (Figs. 2G and 2H). Likewise, differences of Haigis with Holladay 1 and Hoffer Q formulas were also correlated with the level of severity of KC (Amsler-Krumeich grade) (r=0.69 and r=0.44; p<0.001, respectively), with more significant differences between formulas in the most advanced KC cases.
The SRK T formula provided a higher IOL power compared to the Hoffer Q and Holladay 1 formulas. These differences were found to be correlated with IOL power (r=-0.50, p<0.001) and the ocular parameters r1c (r=-0.42 and r=-0.43; p<0.001, respectively) and r2c (r=-0.40 and r=-0.39; p<0.001, respectively). Therefore, the steepest corneas were associated with higher levels of difference between these two formulas (Figs. 2I-2L). Differences of Holladay 1 with SRK T and Hoffer Q formulas were the lowest, barely exceeding 1 D (see Fig. 1F). No significant correlations of these differences with other clinical parameters were found.
4. DISCUSSION
This study was aimed at comparing four IOL power calculation formulas in KC eyes, with an analysis of the predictive factors for the differences between them, including the evaluation of the impact of the second corneal surface. The SRK T, Hoffer Q, Holladay 1, and Haigis formulas were selected for this retrospective study because they are widely available, commonly used in clinical practice, and implementable in any calculation program. Our results indicate that there are differences in using one or another formula that can become clinically significant. Differences up to 3 D in IOL power have been found between the Haigis formula and the rest of the formulas used. Specifically, the Haigis formula was found to provide higher IOL power values in comparison with Holladay 1, Hoffer Q, and SRK T formulas. In contrast, differences between SRK T, Holladay 1, and Hoffer Q were of less magnitude, with the minimal difference between formulas observed when comparing the Holladay 1 and Hoffer Q formulas (mean difference of -0.33±0.25 D). Savini et al. [16] have recently demonstrated that the SRK T formula provides the lowest prediction error in KC compared with the Barrett Universal II, Haigis, Hoffer Q, Holladay 1, and SRK T formulas. However, Thebpatiphat et al. [1] found in another comparative study that a more accurate IOL power calculation was present in patients with mild KC using the SRK II formula, with no significant differences between SRK, SRK II, and SRK T formulas in patients with moderate-to-severe KC. Hashemi et al. [11], in another retrospective study, concluded that the SRK T formula provided the lowest error compared with Hoffer Q. These contradictory results suggest that more studies, including larger sample sizes, are still needed to define which factors allow the prediction of those cases associated with significant differences between IOL power formulas and, therefore, which are more susceptible to residual refractive errors after cataract surgery.
Several factors seem to be involved in differences between formulas, with no clear trend or variability depending on the formulas compared. In our study, an overestimation of the Haigis formula compared to the rest of the formulas was observed, with more difference, as the magnitude of the IOL power calculated was lower, and the patient was then more myopic. The difference in the IOL power of Haigis compared to Holladay 1 and Hoffer Q formulas was larger in eyes with more advanced KC. In addition, increased differences between Haigis and Hoffer formulas were observed in eyes with deep anterior chambers, steeper anterior and posterior corneal surfaces, and high axial lengths (this last trend was also seen in the difference between Haigis and Holladay 1 formulas). It should be considered that in the most advanced stages of KC, both corneal surfaces have a steeper curvature, the ACD is wider, and the ratio anterior/posterior curvature is completely anomalous [23]. For this reason, the higher variability between formulas was observed for advanced KC cases, as found by Savini et al. [16] also. For example, in our sample, the SRK T formula was found to overestimate the IOL power up to 2 D compared to the values obtained with the Hoffer Q formula in the range between 6 and 15 D. This is clinically unacceptable and remarks the challenge of IOL power calculations in KC. Savini et al. [16] found in their comparative study that the median absolute prediction error was higher than 2.50 D with all formulas used in eyes with KC grade III. Therefore, in moderate to advanced KC, the selection of the formula to use for IOL power calculation when cataract surgery is planned is critical, and possibly a more detailed calculation using ray-tracing analysis may be the better solution [24]. This is something that should be investigated in future studies. Recently, Schröder et al. [24] have demonstrated that custom freeform IOL-optics-design may become a promising option for the correction of advanced aberrations in eyes with non-progressive keratoconic corneal topography pattern. A similar conclusion was reported by Wadbro et al. [25] according to the results of numerical 3D ray tracing. Likewise, big data may also be a good option to improve IOL power calculations in keratoconus, as has been demonstrated in a recent comparative trial [17]. The Kane formula, which is an IOL power formula created using several large data sets from selected high-volume surgeons that use a combination of theoretical optics, thin lens formulas, and ‘big data’ techniques to make its predictions, has shown promising results. It should be considered that this formula uses axial length, keratometry, anterior chamber depth, lens thickness, central corneal thickness, and gender of the patient to make its predictions [17].
Besides all these correlations, the correlation between differences among the IOL power obtained with different formulas and r2c indicates that the inclusion of this factor in IOL power calculations in KC may decrease the variability between calculation methods, especially in advanced cases. This is something previously reported confirming that the keratometric approach in KC cannot be used in any case for IOL power calculations [11, 12, 14]. This is especially significant in those eyes with posterior KC because the corneal geometry alteration is only located on the posterior corneal surface [26]. Another important factor is to study the impact of this aspect on the calculation of ELP, as most of the algorithms estimating this parameter are based on the use of corneal power. As differences between IOL formulas in our samples have been found to be correlated with factors such as ACD or AL, variability in the estimation error of ELP is expected. This is something that should also be investigated further in future studies.
CONCLUSION
In conclusion, the selection of the IOL power formula to be used in keratoconus eyes requiring cataract surgery is crucial as there are statistically and clinically significant differences between commonly used vergence formulas, especially in eyes with advanced keratoconus. The most comparable results are provided by the Hoffer Q and Holladay formulas, whereas the Haigis formula provides the most discrepant outcome. In moderate to severe keratoconus, the use of total corneal power and assessing the contribution of the posterior corneal surface may be an adequate option for a more accurate and less variable between formulas outcome. More research on IOL power calculation in keratoconus is still needed to optimize the selection and use of formulas in this type of eyes.
ETHICS APPROVAL AND CONSENT TO PARTICIPATE
This study was approved by the ethics ethics committee of the University of Alicante, Spain (BioEye, EXP-20161017).
HUMAN AND ANIMAL RIGHTS
No animals were used in this research. All human research procedures followed were in accordance with the ethical standards of the committee responsible for human experimentation (institutional and national), and with the Helsinki Declaration of 1975, as revised in 2013.
CONSENT FOR PUBLICATION
Informed consent was obtained from all individual participants included in the study.
AVAILABILITY OF DATA AND MATERIALS
Not applicable.
FUNDING
The author David P Piñero has been supported by the Ministry of Economy, Industry, and Competitiveness of Spain within the program Ramón y Cajal, RYC-2016-20471.
CONFLICT OF INTEREST
Dr. David Pinero is the editorial board member of The Open Ophthalmology Journal.
ACKNOWLEDGEMENTS
Declared none.

