All published articles of this journal are available on ScienceDirect.
Relationship Between the Prevalence of Glaucoma (Estimated Through Prescribed Antiglaucomatous Medication) And Access to Ophthalmologists in Norway
Abstract
Purpose:
The relationship between supply and demand in health care is a challenge. The present study aims to evaluate to what extent glaucoma prevalence is influenced by local access to eye health care services in Norway.
Methods:
Population-based cross-sectional study. Data from The Norwegian Prescription Database was used to find the number of users of topical glaucoma medication, grouped by age and county, giving an estimate of glaucoma prevalence. The number of registered ophthalmologists and opticians was obtained from The Norwegian Society of Ophthalmologists and The Norwegian Directorate of Health.
Results:
In total, 75733 persons were treated with IOP-lowering drugs in Norway in 2018, suggesting an overall glaucoma prevalence of 1.43%. In the age group 70-89 years, the nationwide prevalence was 7.60%, the lowest prevalence being in Oppland (5.98%) and highest in Aust-Agder (9.28%) counties. The number of ophthalmologists per 100000 inhabitants varied from 2.63 to 14.65 in the various counties. A statistically significant correlation was found between glaucoma prevalence in the age group 70-89 years and access to ophthalmological services. Furthermore, the increase in glaucoma prevalence plateaus at roughly 10 ophthalmologists per 100000 inhabitants, indicating that this could cover population demands. This relationship did not apply to opticians.
Conclusion:
There is a clear correlation between glaucoma prevalence and the availability of ophthalmologists in various counties in Norway. Our study indicates a direct relationship between the number of ophthalmologists in the area and the number of people being treated for glaucoma, with prevalence plateauing once a threshold of approximately 10 ophthalmologists per 100000 inhabitants is reached. This finding suggests that low glaucoma prevalence in some regions could be due to limited access to ophthalmological services.
1. INTRODUCTION
Glaucoma is a common eye disease characterized by progressive optic nerve atrophy and corresponding visual field loss. The condition is treated with topical eye medication lowering the intraocular pressure (IOP), and in Norway a physician’s prescription is needed to claim these drugs from the pharmacy. In Northern Europe, the most common subtypes of glaucoma are primary open angle glaucoma (POAG) and pseudoexfoliation glaucoma (PEG). The latter is classified as secondary glaucoma. However, the medical treatment is as for POAG. Narrow-angle glaucoma is comparatively rare in Norway [1], and the treatment is usually laser iridotomy or lens extraction, often in combination with long-term medical treatment.
In most individuals, glaucoma is a bilateral disease. If medication and laser treatment are insufficient to prevent disease progression, all types of glaucoma can be treated with an IOP-lowering operation. Many patients will, however, need IOP-lowering medication, even following surgery. In short, nearly all glaucoma patients use topical eye medication to control the disease. Thus, given the number of treated people, glaucoma prevalence in a defined area can be estimated.
Treatment of glaucoma is carried out according to national and international guidelines, and the five classes of IOP-lowering drugs (beta blockers, prostaglandin analogues, carboanhydrase inhibitors, adrenergic agonists, and miotics) have all been available since the 1990’s. Accordingly, similar treatment across the country makes the comparison between Norwegian counties possible. The decision to commence treatment is made by an ophthalmologist based on clinical examination with measurement of IOP, automatic perimetry, ocular tomography of the retina and optic disc, and risk assessment of each patient. Opticians refer customers with findings (IOP, examination, family history) suspicious of glaucoma to ophthalmologists, however, cannot commence treatment unilaterally.
Previous studies based on estimates of medication sales have been used to evaluate geographic differences in glaucoma prevalence in Scandinavia [2]. Cohort studies have shown remarkable differences in glaucoma prevalence between municipalities and counties [3, 4]. Furthermore, a Danish report indicated higher glaucoma prevalence in urban areas [5].
In the present study, estimates of glaucoma prevalence on a county-by-county basis in Norway have been correlated with access to health services in the same area. This information is useful for the planning of future health services and research on glaucoma-care.
2. MATERIAL AND METHODS
The Norwegian Prescription Registry was used to obtain data concerning glaucoma drug consumption (http://www.norpd.no/). A person (identified through their social security number) was registered as a user of glaucoma medication if an IOP-lowering eye medication had been claimed at a pharmacy one or more times during a year. Given that prescription by a doctor is mandatory for all glaucoma therapeutics in Norway, it is suggested that glaucoma prevalence is closely related to the number of persons using IOP-lowering drugs. These medications have practically no other use than to lower IOP and there is no abuse.
The total population in each age group and geographical area was collected from the Norwegian population register. Individuals with glaucoma were connected with a county according to their registered home address. All topical glaucoma medication was included (based on the ATC-number system, Anatomic Therapeutic Chemical classification), whereas acetazolamide for systemic use was excluded (ATC-number S01EC019).
To establish the relationship between glaucoma prevalence and access to ocular health care, the number of ophthalmologists (employed by or connected to the state health system) was obtained from registers at The Norwegian Directorate of Health and available publications, updated to 2018 [6]. A county-based distribution of authorized opticians was obtained from The Norwegian Directorate of Health. It was not possible to exclude retired opticians from the results.
Correlation analyses were performed with calculations of Pearson’s correlation coefficient with p-value. The study has been based on the age group 70-89 years as the majority of the glaucoma patients belong to this group, and the relevant information is available for this group in all counties [4]. Furthermore, by using a defined and limited age group that includes most glaucoma patients, comparison between different counties will be more accurate, as individual counties may have a different age distribution within their population. The age group over 90 years shows high glaucoma prevalence, though the absolute number of patients is rather low.
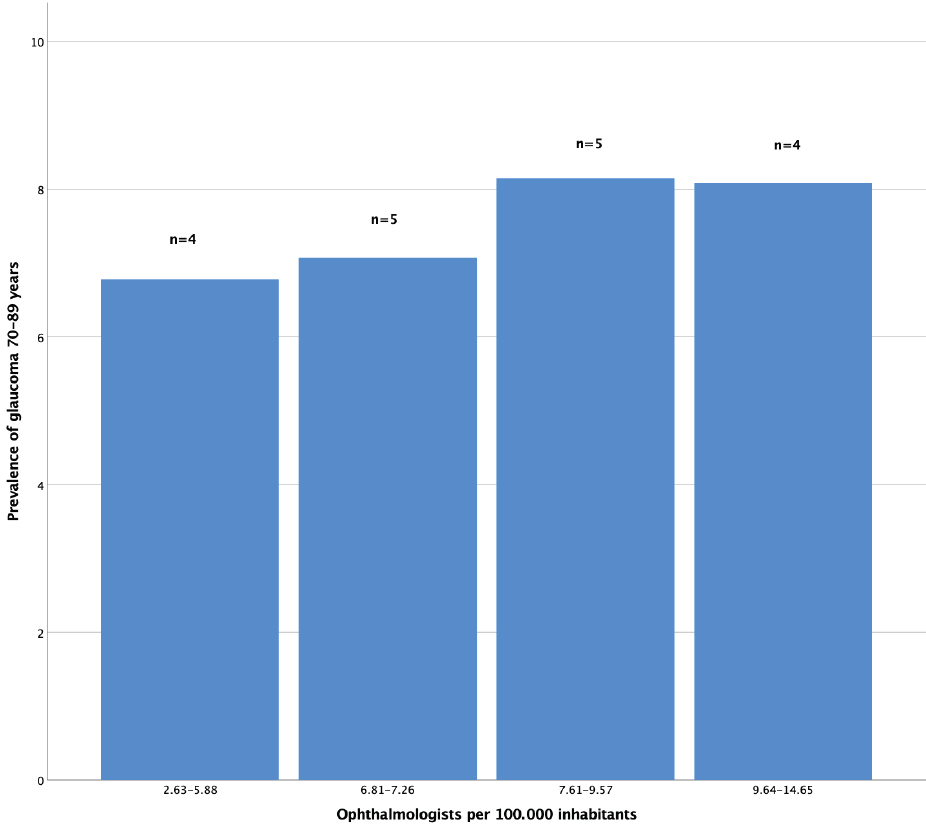
The 18 Norwegian counties were split into four subgroups according to ascending density of ophthalmologists.
Group 1 (n=4): Density 2.63-5.88.
Group 2 (n=5): Density 6.81-7.26.
Group 3 (n=5): Density 7.61-9.57.
Group 2 (n=4): Density 9.64-14.65.
The regional committee did not require ethical approval for medical and health research ethics, given this was a register-based study. All information received from the data registry had been deidentified. The study was conducted following the Declaration of Helsinki principles.
3. RESULTS
3.1. Glaucoma Prevalence in Norway and its Counties in 2018
In 2018, there were 75733 people nationwide claiming topical IOP-lowering drugs at pharmacies, indicating a glaucoma prevalence of 1.43% (total population of Norway 5311800 at the time). The prevalence rapidly increases with increasing age, and in the age group 70-89 years, 46476 persons received treatment, corresponding to a prevalence of 7.60%.
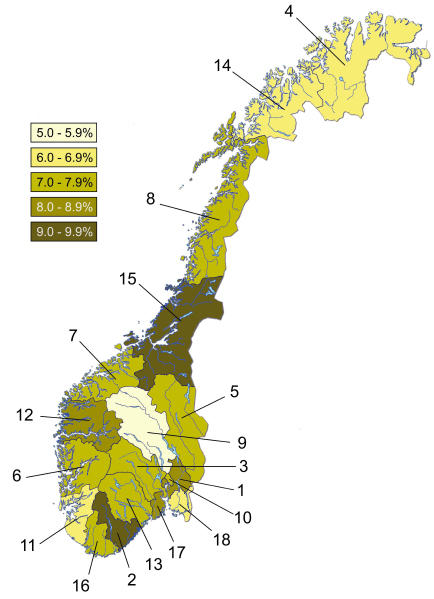
As seen in Table 1 and Fig. (1), the counties of Oppland (5.98%) and Aust-Agder (9.28%) have the lowest and highest glaucoma prevalence, respectively. It is noteworthy that the city of Oslo is 9th of 18 counties on the ranking from high to low glaucoma prevalence.
| Area | Population 70-89 Years | Number of Patients | Prevalence Glaucoma 70-89 years (%) |
| Norway | 611639 | 46476 | 7.60 |
| 1. Akershus | 66912 | 5717 | 8.54 |
| 2. Aust-Agder | 14346 | 1331 | 9.28 |
| 3. Buskerud | 34907 | 2628 | 7.53 |
| 4. Finnmark | 9056 | 595 | 6.57 |
| 5. Hedmark | 29147 | 2116 | 7.26 |
| 6. Hordaland | 57384 | 4332 | 7.55 |
| 7. Møre og R. | 33978 | 2594 | 7.63 |
| 8. Nordland | 33185 | 2341 | 7.05 |
| 9. Oppland | 27548 | 1648 | 5.98 |
| 10. Oslo | 55860 | 4210 | 7.54 |
| 11. Rogaland | 45417 | 2822 | 6.21 |
| 12. Sogn og Fj. | 14448 | 1268 | 8.78 |
| 13. Telemark | 23685 | 1822 | 7.69 |
| 14. Troms | 20058 | 1348 | 6.72 |
| 15. Trøndelag | 54078 | 4994 | 9.23 |
| 16. Vest-Agder | 20749 | 1457 | 7.02 |
| 17. Vestfold | 32266 | 2587 | 8.02 |
| 18. Østfold | 38620 | 2662 | 6.89 |
3.2. Access to Eye Health Care Services
Of the 167.33 private ophthalmologist positions in clinics throughout Norway in 2018 (Table 2), 134 of them were full-time positions, with the remaining in part-time employ. Public, hospital-based departments employed in total of 261.8 ophthalmologists in junior/trainee and senior/consultant positions.
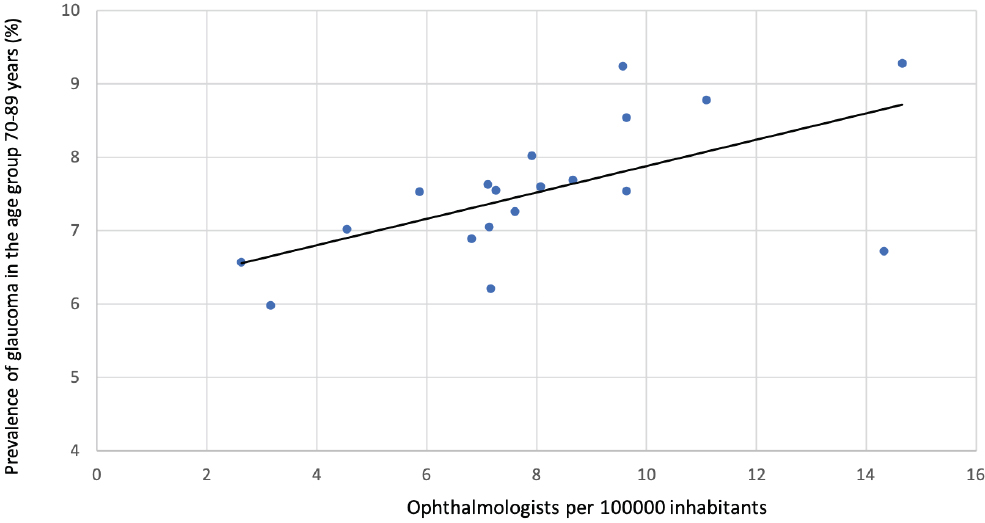
Calculations of the relationship between the availability of ophthalmological services and glaucoma prevalence in the various counties seemed to be linear with a correlation coefficient of r= 0.604 (p=0.008, Fig. 2a). Considering the limited ophthalmological service in the hospitals of 3 counties (Vest-Agder, Oppland, and Finnmark, see Table 2), and by adding the hospital ophthalmologists from the respective neighbour counties as indicated in the table text, r=0.596 (p=0.009) was obtained.
However, when glaucoma prevalence is divided into four subgroups, according to ascending density of ophthalmologists, glaucoma prevalence increases by increasing the density of ophthalmologists up to 9.57 ophthalmologists per 100000 population but did not increase beyond this limit (Fig. 3).
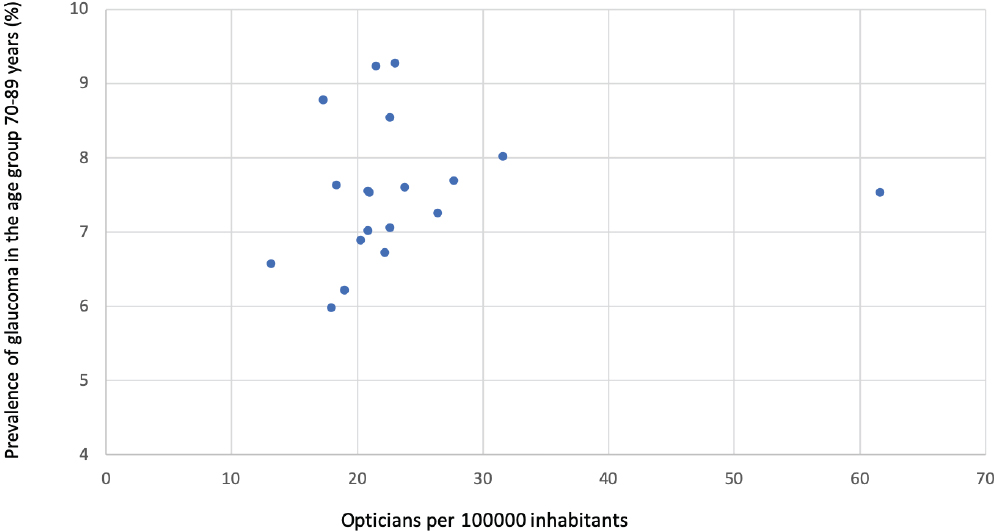
According to The Norwegian Directorate of Health 2383 authorized opticians were located in Norway in 2018. The number of opticians per 100000 inhabitants was highest in Buskerud (The optician school is located in Buskerud county) and lowest in Sogn og Fjordane county. Analysis of the correlation between the number of opticians per 100000 and the prevalence of glaucoma in the counties showed r=0.001 (p=0.998, Fig. 2b).
| Area | Population | Ophthal. outside hospitals | Hospital-based ophthal. | Ophthal, total | Ophthal / 100000 inhab. | Opticians | Opticians / 100000 inhab. |
| Norway | 5311800 | 167.33 | 261.8 | 429.13 | 8.08 | 2383 | 44.86 |
| Akershus | 619043 | 19.06 | 0 | 19.06 | 9.64* | 302 | 48.78 |
| Aust-Agder | 117440 | 4.2 | 13 | 17.2 | 14.65 (8.11) | 47 | 40.02 |
| Buskerud | 282454 | 5.75 | 18 | 23.75 | 5.88* | 338 | 119.67 |
| Finnmark | 76024 | 1 | 1 | 2.0 | 2.63 (6.97) | 24 | 31.57 |
| Hedmark | 197157 | 4.5 | 10.5 | 15.0 | 7.61 (5.25) | 85 | 43.11 |
| Hordaland | 523562 | 17 | 21 | 38.0 | 7.26 | 180 | 34.38 |
| Møre og R. | 267118 | 6 | 13 | 19 | 7.11 | 81 | 30.32 |
| Nordland | 243324 | 9.87 | 7.5 | 17.37 | 7.14 (8.12) | 90 | 36.99 |
| Oppland | 189710 | 5 | 1 | 6.0 | 3.26 (5.61) | 69 | 36.37 |
| Oslo | 677269 | 24.1 | 70 | 94.1 | 9.64* | 319 | 47.10 |
| Rogaland | 474611 | 11 | 23 | 34.0 | 7.16 | 190 | 40.03 |
| Sogn og Fj. | 109985 | 4.2 | 8 | 12.2 | 11.09 | 31 | 28.19 |
| Telemark | 173345 | 7 | 8 | 15.0 | 8.65 | 77 | 44.42 |
| Troms | 166855 | 4.9 | 19 | 23.9 | 14.32 (8.59) | 77 | 46.15 |
| Trøndelag | 460328 | 17.05 | 27 | 44.05 | 9.57 | 169 | 36.71 |
| Vest-Agder | 187044 | 7.7 | 0.8 | 8.5 | 4.54 (8.38) | 69 | 36.89 |
| Vestfold | 250060 | 7.8 | 12 | 19.8 | 7.92 | 123 | 49.19 |
| Østfold | 296471 | 11.2 | 9 | 20.2 | 6.81 | 112 | 37.78 |
3 counties (Finnmark, Oppland and Vest-Agder) had a very limited ophthalmological service at the county hospital and these counties have been combined with Troms and Nordland, Hedmark, and Aust-Agder, respectively. Numbers in brackets after adjustment for hospital area.
4. DISCUSSION
A study based on the Danish Prescription Registry indicated a nationwide glaucoma prevalence of 1.72% [5], which is higher than a comparable study from Norway (1.43%) [4]. Furthermore, the Danish study showed the highest glaucoma prevalence in urban areas, which is different from the present observations revealing accumulation of glaucoma neither in Oslo nor in other counties with big cities (Table 1). Thus, marked differences in glaucoma prevalence are seen both within and between Norway and Denmark.
In the present study, the age group 70-89 years has been given focus due to its high glaucoma prevalence. The age group 90+ still shows higher prevalence, though the total number of persons in this group is substantially lower. In addition, many of them reside in care facilities where the pharmaceuticals consumed are recorded collectively.
In total, 7.60% of the population age group 70-89 was on IOP-lowering medication in 2018, ranging from 5.98% in Oppland to 9.28% in Aust-Agder (Table 1). Several factors may have contributed to this difference throughout the country. First of all, it may, to some extent, reflect real variations in morbidity as indicated in previous reports [2, 7]. In our files Oppland, Rogaland, and Finnmark stand out with low glaucoma prevalence (Fig. 1, Table 1). A well-known risk factor for glaucoma is pseudoexfoliation syndrome showing marked differences in prevalence on the municipal basis in Middle Norway [8].
On the other hand, pseudovariations in glaucoma prevalence may also occur for various reasons. Observed differences in glaucoma prevalence could refer to ophthalmologists using different diagnostic criteria for glaucoma, or how laser therapy and surgical intervention are implemented in the treatment. For instance, initial treatment with laser-iridotomy in narrow-angle glaucoma or cataract extraction could postpone the use of IOP-lowering drops. However, as the ophthalmological clinics are rather uniformly equipped, and the patient-treatment follows national and international guidelines, these factors are unlikely to impart a significant impact.
Glaucoma is usually a slowly progressing disease with an asymptomatic initial phase. Not all glaucoma patients have a high IOP; some may have elevated IOP without developing glaucoma (ocular hypertension). Consequently, glaucoma as a disease is prone to be both under-diagnosed and over-treated. The decision when to start treatment is, therefore, always taken by an ophthalmologist, and accordingly, the outcome with regard to glaucoma prevalence is crucially dependent on adequate access to the eye-care system.
As seen in Fig. (2a), the relationship between glaucoma prevalence and the number of ophthalmologists in corresponding regions is apparently linear. However, by comparing subgroups of counties ranked according to the availability of ophthalmological services versus glaucoma prevalence, as shown in Fig. (3), it appears that the association is not linear. In fact, the lower-ranked subgroups have a steeper slope indicating that the low glaucoma prevalence in the corresponding counties may be due to inadequate ophthalmological service. On the other hand, the graph’s slope flattens at roughly 10 ophthalmologists per 100000 inhabitants. Thus, this ratio could be a reasonable balancing demand and supply limit. It is important, however, to highlight that the present study is focused on glaucoma care only, and so the conclusions do not necessarily apply to other ophthalmological disorders.
Glaucoma suspects observed by optometrists or opticians are always forwarded to an ophthalmologist and are thus included in their files. Interestingly, no correlation was found between glaucoma prevalence and optician-level eye care (Fig. 2b). One reason could be that the number of opticians in an area is regulated through commercial mechanisms (supply and demand) whereas the distribution of the publicly sponsored ophthalmological health care system is decided by the Norwegian Directorate of Health according to policy.
A shortcoming in the present study is that IOP-lowering drugs are sometimes used to stabilize the IOP also in some non-glaucomatous conditions like eye contusion, uveitis, and eye-operations. However, the number of patients in these groups is low, and some subsequently develop glaucoma.
Furthermore, some ophthalmologists work in private clinics in cities without any financial support from the government. However, this is a very small proportion of the total and includes refractive surgeons.
Finally, the impact of immigration should be addressed, - the exact distribution of immigrants on a county-basis is not available. This is of relevance as people from South-East Asia are prone to develop narrow-angle glaucoma, which may be primarily treated by laser iridotomy only, thus not appearing in our data. In addition, some of the immigrants may avoid contact with the health care system. However, it seems unlikely that our observations have been significantly influenced by these factors.
CONCLUSION
Thus, our main conclusions are: 1) Both glaucoma prevalence and the number of ophthalmologists per 100000 inhabitants vary significantly throughout Norway. 2) Low glaucoma prevalence in some counties may indicate limited access to the eye care system in the area rather than a true variance in prevalence. 3) Given the structure of the Norwegian health care system, 10 ophthalmologists per 100000 inhabitants would appear to be adequate to cover the population’s demands regarding glaucoma care.
ETHICS APPROVAL AND CONSENT TO PARTICIPATE
The regional committee did not require ethical approval for medical and health research ethics, given this was a register-based study.
HUMAN AND ANIMAL RIGHTS
No animals were used for studies that are the basis of this research. All the humans were used in accordance with the ethical standards of the committee responsible for human experimentation (institutional and national), and with the Helsinki Declaration of 1975, as revised in 2013 (http://ethics.iit.edu/ecodes/node/3931).
CONSENT FOR PUBLICATION
All information received from the data registry had been de-identified.
STANDARDS OF REPORTING
STROBE guidelines were followed.
AVAILABILITY OF DATA AND MATERIALS
Data are partly available in the manuscript, can be accessed from the Norwegian Prescription database (http://www.norpd.no/Prevalens.aspx) with an online search tool, and other data that support the findings of this study are available from the corresponding author upon reasonable request.
FUNDING
None.
CONFLICT OF INTEREST
The authors declare no conflict of interest, financial or otherwise.
ACKNOWLEDGEMENTS
Declared none.

