All published articles of this journal are available on ScienceDirect.
Normal Range of Ocular Biometry in Healthy Saudi Children
Abstract
Aim
This study aims too describe typical ocular component growth patterns in healthy Saudi children.
Background
Prior literature has explored ocular growth patterns in various populations, but there is a gap in understanding these patterns in Saudi Arabia.
Objectives
To establish normative values for ocular biometric parameters and understand correlations between age and ocular development.
Methods
This cross-sectional study involved 141 children aged 3–17 years. The participants were examined at the eye clinic at King Abdulaziz University Hospital, Jeddah, Saudi Arabia, between 2018 and 2023. Every participant underwent a comprehensive ophthalmological assessment, including ocular biometric data [axial length (AXL), corneal curvature, and anterior chamber depth (ACD)].
Results
The mean age of participants was 9.03 ± 3.5 years. The AXL and ACD were 22.49 ± 1.1 mm and 3.34 ± 0.3 mm, respectively. As expected, there was a significant myopic shift with increasing age (p < 0.030). Both the ACD and AXL grew deeper and longer as the children grew older (r = 0.595, p < 0.001 and r = 0.559, p < 0.001, respectively), but corneal curvatures and corneal astigmatism remained constant. AXL values were significantly longer in boys (p = 0.019), but corneal curvatures (K1 and K2) were significantly steeper in girls (p = 0.007 and <0.001, respectively).
Conclusion
This study presents a comprehensive pediatric normative database of ocular biometric parameters for healthy Saudi children. These data will serve as a foundation for tracking the development of refractive errors and may be used as normative values for the evaluation of eye growth in children from the Middle East.
1. INTRODUCTION
Image focus on the retina is influenced by ocular biometric components such as Anterior Chamber Depth (ACD), Axial Length (AXL), corneal power, and vitreous chamber depth [1]. The interaction between the ocular refractive components determines the refractive state of the eye [2]. Anthropometric parameters, genetics, and ethnicity have been shown to influence ocular biometric dimensions [3].
This research has shed light on the typical development pattern of the optical components of the eye in school-age children [4-7]. Others have investigated the connection between ocular dimensions and growth characteristics in children from Sweden and adults from Singapore and China [8-10]. However, age group and ethnic variations mean that the results cannot be generalized. A study that examined ocular biometric parameter distribution in children aged 11–15 years reported that the mean AXL was longer in East Asians, followed by that in South Asians. The mean AXL was shorter in the European, Caucasian, and Middle Eastern subgroups. The mean ACD was similar among European Caucasians, South Asians, and Middle Easterners. However, these mean ACDs were all deeper compared with those of East Asian children [11]. Sincegeographic variations are significant factors to consider when comparing ocular biometry data, it is important to establish population-specific normative data.
The objectives of the current study were to: 1) carry out a comprehensive prospective ocular examination on meticulously recruited healthy individuals to establish normative values for AXL, ACD, and corneal curvature in healthy full-term Saudi children; 2) investigate the relationship between ocular biometrics and Optical Coherence Tomography (OCT) optic nerve and macular parameters; and 3) to ascertain the effects of sex, age, and refraction on these parameters.
2. MATERIALS AND METHODS
2.1. Study Design
This cross-sectional study involved 141 children aged 3–17 years. The participants were recruited through surveys and as healthy relatives of staff and siblings of patients visiting the eye clinic at King Abdulaziz University Hospital (KAUH) in Jeddah, Saudi Arabia, between 2018 and 2023. Of the 150 children who were eligible to participate, 141 accepted and met the inclusion requirements. To achieve 80% power at a significance level of 0.05, the sample size of 141 participants was calculated to ensure adequate power to detect significant differences in ocular biometric parameters. The exclusion criteria were age >18 years, systemic or neurologic disease, retinal or optic disc abnormality upon dilated fundus exam, premature birth (<37 weeks), and non-Saudi nationality. Two children were excluded because of poor visual acuity (VA; worse than 20/70), and seven children were excluded because they had Spherical Equivalent (SE) outside the range “+5 and −5”. The astigmatic values of all included participants were <4.5. Corrective eyeglasses were prescribed to patients if refractive errors were detected during the examination. The population was divided into three age groups: 4–7, 8–12, and 13–17 years.
2.2. Ocular Examination
The participants underwent a comprehensive ocular examination that encompassed biometric data such as AXL, corneal curvature [flat (K1) and steep (K2) meridian of the anterior corneal surface], ACD, VA, cycloplegic refraction, and OCT. The Best Corrected VA (BCVA) at 6 m was measured using either the Snellen E chart or Allen’s picture chart. The distance VA was converted to logMAR units. An autorefractor (Topcon A6300, Topcon Corporation, Tokyo, Japan- Fig. 1) was used both before and after 1-h application of a combination of cyclopentolate (1%) and phenylephrine (2.5%). The SE was calculated (spherical error + ½ cylindrical error). Before cycloplegia, the AXL, corneal curvature, and ACD of each eye were assessed with an IOL Master 500 biometer (Carl Zeiss Meditec- Fig. 2). Five non-contact AXL readings were averaged and recorded. The measurement was repeated after values with poor signal quality and that varied by >0.1 mm had been eliminated. The greatest and least corneal curvatures were determined by measuring the corneal curvature along the primary meridians. The retinal and optic nerve thicknesses were measured using OCT (Carl Zeiss Meditec, Dublin, CA, USA- Fig. 3). Our goal was to reduce abnormal values and inaccurate data by standardizing the testing method across all participants. After entering the pupil, the device uses line scanning to enhance the view of the retina. The patient fixates on the internal fixation target to ensure accurate centration. The macular cube protocol was used to measure the Central Subfield Thickness (CST), Cube Volume (CV), mean Macular Retinal Thickness (MT), and Retinal Nerve Fiber Layer (RNFL). The macular thickness information is provided in each of the nine Early Treatment Diabetic Retinopathy Study (ETDRS) regions: A1 (central), A2 (inner superior), A3 (inner temporal), A4 (inner inferior), A5 (inner nasal), A6 (outer superior), A7 (outer temporal), A8 (outer inferior), and A9 (outer nasal area). The inner (A2–A5) and outer (A6–A9) subfields had diameters of 3 and 6 mm, respectively, while the diameter of the central subfield (A1) was 1 mm. In the same configuration, the mean RNFL thickness and RNFL thickness in each optic nerve quadrant were quantified using the optic disc cube 200 × 200 protocol. The Cirrus OCT Optic Disc Cube 200 × 200 software automatically identifies the optic disc center. We measured the mean RNFL thickness as well as RNFL thickness in the nasal, temporal, superior, and inferior quadrants. The best-centered optic disc image and signal strength of at least 7/10 were considered acceptable quality.
2.3. Statistical Analysis
IBM SPSS version 27 (IBM Corp., Armonk, NY, USA) was used to conduct the analysis. For categorical and nominal variables, the research variable characteristics were defined by percentages and counts. Continuous variables are presented as mean and standard deviation. A paired-sample t-test was used to compare the means of two variables within a single group, calculate the differences in the values of the two variables for each case, and evaluate whether the mean deviated from zero. Pearson’s correlation coefficient was used to correlate the variables represented by both means. The means of two or more groups were compared using an independent t-test and one-way analysis of variance, respectively, with the least significant difference (LSD) as a post-hoc test. The experiments were carried out assuming a normal distribution. Otherwise, the LSD test was replaced by Welch’s t-test for two-group means and the Games-Howell test for multiple groups. Finally, the null hypothesis was rejected if the conventional p-value was <0.05.
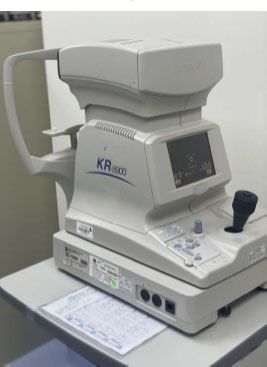
Auto Refractor Topcon A6300—an automated device used to measure refractive errors of the eye.
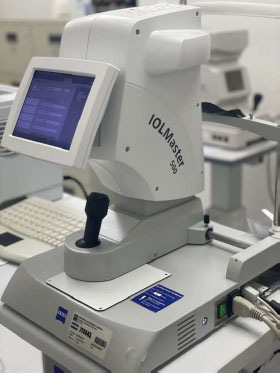
IOLMaster by Carl Zeiss Meditec—an advanced device used for precise measurements of the eye's axial length, corneal curvature, and anterior chamber depth.
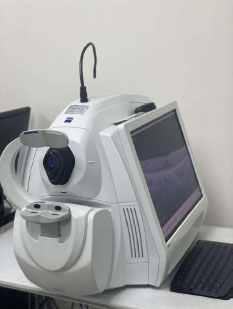
Optical Coherence Tomography (OCT) machine by Carl Zeiss Meditec, Dublin—used for high-resolution imaging of retinal structures.
3. RESULTS
3.1. Patient Demographics
This study involved 141 children (71 boys, 50.4%; 70 girls, 49.6%). The average age was 9.02 ± 3.5 years (ranging from 3 to 17 years). The participants were divided into three subgroups based on age: 3–7 years, 8–12 years, and 13–17 years. All participants were born at term. The average gestational age was 38.9 ± 0.6 weeks, and the birth weight was 2.88 ± 0.7 kg. Right (RE) and left eye (LE) data for all participants were recorded for analysis. The RE and LE were not different in terms of biometric and macular/optic nerve OCT parameters. The mean RE and LE SE refraction was 0.84 ± 1.7 and 0.89 ± 1.7, respectively. The best logMAR was 0.23 ± 0.1, and the best VA was 20/70 or better in both eyes.
3.2. Biometric and OCT Parameters
Table 1 presents the distribution of the ocular biometric data. The mean ACD was 3.35 ± 0.3 mm (range: 2.58–4.09 mm), and the mean AXL was 22.49 ± 1.1 mm (range: 19.25–25.51 mm). Mean corneal astigmatism was estimated to be 1.58 ± 0.9 D. The mean macular OCT values were: central subfield thickness, 238.84 ± 28.6 μm; CV, 10.05 ± 0.7 mm3; MT, 279.75 ± 20.5 μm; and foveal thickness, 253.11 ± 14.6 μm. The mean peripapillary RNFL (ppRNFL) thickness was 94.34 ± 12.6 μm.
3.3. Age and OCT/biometric Parameters
Table 2 lists the ocular biometric data divided by age group. As expected, there was a significant myopic shift with increasing age (p < 0.030). Both the ACD and AXL grew deeper and longer as the children grew older (r = 0.595, p < 0.001 and r = 0.559, p < 0.001, respectively). This was clearly demonstrated in ACD and AXL box plots divided by age group (Figs. 4 and 5). Corneal curvatures (K1 and K2) and corneal astigmatism did not show significant changes as the children grew older. The mean MT and CV were both positively correlated with age (r = 0.478, p < 0.001 and r = 0.471, p < 0.001, respectively). Both remained moderately positively correlated after adjustment for AXL (mean macular thickness: r = 0.4, p < 0.001; macular CV: r = 0.4, p < 0.001). However, no difference was observed for foveal or mean ppRNFL thickness with increasing age.
3.4. Sex and OCT/biometric Parameters
Table 3 demonstrates biometric values and SE analyses according to sex. The ACD measurements were unaffected by gender, while the AXL values were substantially longer in boys (p = 0.019). Girls had considerably steeper K1 and K2 values (p = 0.007 and <0.001, respectively). Girls had greater corneal astigmatism than boys (p = 0.046). There were no differences in macular/ppRNFL thickness or optic nerve parameters between sexes.
3.5. Correlations
The ACD had a negative correlation with SE (r = −0.416, p = 0.001) but a significant positive correlation with AXL (r = 0.635, p < 0.001). Pearson correlation analysis of AXL demonstrated a moderately negative association with K1 (r = −0.454, p < 0.001) and K2 (r = −0.514, p < 0.001). Only the superior RNFL thickness was correlated with SE (r = 0.322, p < 0.00; AXL adjusted). AXL was only positively correlated with the inferior inner macular sector (r = 0.41, p = 0.03) but not with the remaining eight ETDRS macular or ppRNFL sectors.
| Variable | Min | Max | Mean | SD | Median |
1st percentile |
5th percentile |
95th percentile |
|---|---|---|---|---|---|---|---|---|
| ACD (mm) | 2.58 | 4.09 | 3.35 | 0.3 | 3.34 | 2.58 | 2.92 | 3.80 |
| AXL (mm) | 19.25 | 25.51 | 22.49 | 1.1 | 22.48 | 19.25 | 20.74 | 24.48 |
| K1 (D) | 40.21 | 46.84 | 43.07 | 1.4 | 42.86 | 40.21 | 40.83 | 45.88 |
| K1 radius (mm) | 7.21 | 8.40 | 7.85 | 0.3 | 7.89 | 7.21 | 7.38 | 8.27 |
| K2 (D) | 41.49 | 50.95 | 44.65 | 1.7 | 44.34 | 41.49 | 42.25 | 47.84 |
| K2 radius (mm) | 7.02 | 8.14 | 7.58 | 0.3 | 7.61 | 7.02 | 7.09 | 8.05 |
| Cylinder (D) | 0.47 | 4.86 | 1.58 | 0.9 | 1.43 | 0.47 | 0.58 | 3.04 |
| Demographics | Age | 3–7 Years | 8–12 Years | 13–17 Years | p-value |
|---|---|---|---|---|---|
| - | Gender (M/F) | 54.4%/45.6% | 50.9%/49.1% | 42.9%/57.1% | 0.607 |
| - |
Spherical equivalent mean±SD range (minimum- maximum) |
1.26 ± 1.2A 1.38 (−1.3–3.8) |
0.97 ± 1.8A 0.75 (−3.5–5.3) |
0.07 ± 2.0B 0.31 (−5.0–4.0) |
0.024a,b |
| Biometric measurements |
ACD (mm) mean±SD range (minimum- maximum) |
3.19 ± 0.2A 3.18 (2.6–3.6) |
3.46 ± 0.3B 3.55 (2.9–3.9) |
3.61 ± 0.3B 3.59 (3.3–4.1) |
<0.001a,b |
|
AXL (mm) mean±SD range (minimum- maximum) |
22.11 ± 0.7A 22.08 (21.0–23.9) |
22.70 ± 1.2B 22.79 (20.0–24.6) |
23.89 ± 1.0C 23.79 (22.3–25.5) |
<0.001a,c | |
|
K1 (D) mean±SD range (minimum- maximum) |
43.13 ± 1.3 42.95 (40.2–46.8) |
43.19 ± 1.6 43.13 (40.3–46.0) |
42.32 ± 1.2 42.14 (40.8–44.4) |
0.227 | |
|
K 1 radius (mm) mean±SD range (minimum- maximum) |
7.83 ± 0.2 7.85 (7.2–8.4) |
7.85 ± 0.3 7.89 (7.3–8.4) |
7.98 ± 0.2 8.01 (7.6–8.3) |
0.253 | |
|
K2 (D) mean±SD range (minimum- maximum) |
44.84 ± 1.8 44.47 (41.5–51.0) |
44.65 ± 1.7 44.34 (41.7–48.1) |
43.67 ± 1.4 43.44 (41.5–46.2) |
0.153 | |
|
K2 radius (mm) mean±SD range (minimum- maximum) |
7.55 ± 0.3 7.60 (7.1–8.1) |
7.57 ± 0.3 7.59 (7.0–8.1) |
7.74 ± 0.2 7.77 (7.3–8.1) |
0.155 | |
|
Cylinder (D) mean±SD range (minimum- maximum) |
1.66 ± 0.9 1.56 (0.5–4.9) |
1.53 ± 0.9 1.41 (0.5–4.7) |
1.34 ± 0.6 1.27 (0.5–2.5) |
0.551 |
ACD = anterior chamber depth, AXL = axial length, K1 = flat meridian of anterior corneal surface, K2 = steep meridian of anterior corneal surface, D = diopter, mm = millimeter.
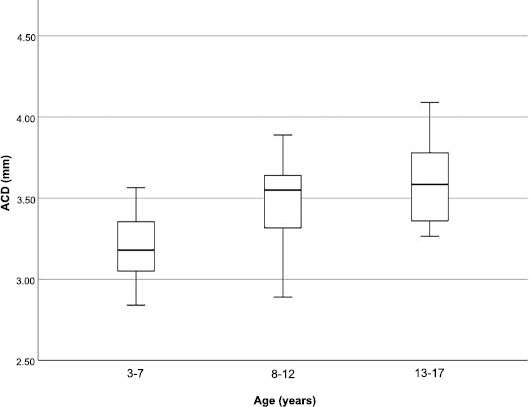
Box plots of anterior chamber depth (ACD) divided by age group.
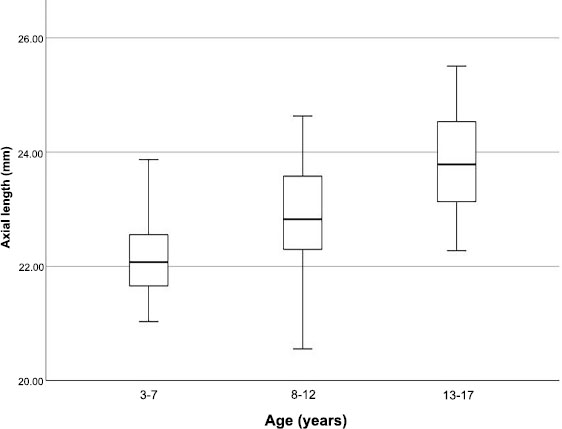
Box plots of axial length (AXL) divided by age group.
| - | Gender | Male | Female | p-value |
|---|---|---|---|---|
| - |
Spherical equivalent mean±SD range (minimum- maximum) |
0.99 ± 1.3 0.88 (−1.3–4.0) |
0.80 ± 2.1 0.75 (−5.0–5.3) |
0.589 |
| Biometric measurements |
ACD (mm) mean±SD range (minimum- maximum) |
3.40 ± 0.3 3.37 (3.0–4.1) |
3.28 ± 0.3 3.29 (2.6–4.0) |
0.052 |
|
AXL (mm) mean±SD range (minimum- maximum) |
22.72 ± 1.0 22.63 (20.6–25.2) |
22.19 ± 1.2 21.91 (19.3–25.5) |
0.019a | |
|
K1 (D) mean±SD range (minimum- maximum) |
42.68 ± 1.2 42.57 (40.3–46.0) |
43.53 ± 1.6 43.86 (40.2–46.8) |
0.007b | |
|
K1 radius (mm) mean±SD range (minimum- maximum) |
7.92 ± 0.2 7.93 (7.3–8.4) |
7.77 ± 0.3 7.71 (7.2–8.4) |
0.013b | |
|
K2 (D) mean±SD range (minimum- maximum) |
44.06 ± 1.4 43.93 (41.5–48.1) |
45.36 ± 1.9 45.34 (41.5–51.0) |
<0.001a | |
|
K2 radius (mm) mean±SD range (minimum- maximum) |
7.66 ± 0.2 7.68 (7.0–8.1) |
7.48 ± 0.3 7.45 (7.0–8.1) |
0.002a | |
|
Cylinder (D) mean±SD range (minimum- maximum) |
1.41 ± 0.7 1.35 (0.5–3.8) |
1.80 ± 1.0 1.46 (0.7–4.9) |
0.046a |
a Significant using independent t-test at <0.05 level.
b Significant using Welch’s t-test at <0.05 level.
4. DISCUSSION
We report normative data for ocular biometric measures in healthy, full-term Saudi children aged 3–17 years. A children’s biometric reference database for Saudi children will aid in the early diagnosis, monitoring, and management of pediatric ocular conditions.
In our study, the mean ACD was 3.35 ± 0.3 mm, and the mean AXL was 22.49 ± 1.1 mm. As expected, both ACD and AXL grew deeper and longer as the children grew older. The AXL increased by 1.78 mm between the older group (13–17 years) and the younger group (3–7 years). This difference was more than double that reported previously by Raffa et al. [8], where there was a 0.7-mm difference between 4–6- and 13–15-year-old groups. ACD measurements were not affected by sex grouping, whereas the AXL was significantly longer in boys. A study on Swedish children reported that the ACD was 0.14 mm deeper, and the AXL was 0.7 mm longer in boys compared with girls [8].
Our study demonstrated that corneal curvature (K1 and K2 values) was significantly steeper in girls (p = 0.007 and <0.001, respectively). However, no changes were observed in the whole group as the children grew older. This is in disagreement with Twelker et al. [6], who found no difference in corneal power between boys and girls between the ages of 6 and 14 years. In our study, corneal astigmatism was higher in girls than in boys but did not change with age. It has also been shown by Rauscher et al. [12] that the value of astigmatism is stable with age.
Similar to our findings, several studies have reported that age and RNFL thickness [13-15] or macular thickness [15-17] in the pediatric population were not significantly correlated. Several researchers hypothesized that the lack of a relationship between age and RNFL in children was due to the fact that nerve fiber layer losses begin to occur after the age of 50 years [18]. Additionally, AXL and RNFL were reported to be strongly correlated in children [19, 20]. However, the present investigation did not demonstrate this.
A strength of this study is that it included a large sample size of healthy Saudi children. Another strength is that ocular biometric parameters (ACD and AXL) were measured and considered, given the known influence on RNFL and macular thickness measurements [21, 22]. The exploration of the impact of such variables was not possible in the previous study on OCT parameters in Saudi children because of its retrospective study design [23]. In the study by Raffa et al. [23], the possible use of different OCT machines over time introduces variability in the imaging technology and parameters used, potentially impacting the consistency and reliability of the data collected. In contrast, the present study implemented a controlled approach to OCT imaging. By using a standardized OCT machine across all participants, this study ensured consistency in imaging technology and parameters. Furthermore, all participants were prospectively recruited and examined using a standardized examination protocol while following strict inclusion criteria to exclude those with systemic or ocular diseases. Conducting the project prospectively, enabled us to collect data in a more controlled manner, reducing the likelihood of biases that can arise in retrospective studies [23].
The predominantly homogeneous ethnic group is one of the study limitations, resulting in the inability to investigate the relationship between parameters and ethnicity. It is possible that due to the exclusion of eyes with severe refractive errors, no marked connections between AXL, macular thickness, and RNFL thickness were noted. Additionally, our study was hospital-based rather than population-based, which might affect its generalizability. Future studies should include the recruitment of a wider range of participants from different areas in Saudi Arabia to allow for better generalizability.
CONCLUSION
In this study, normal reference ranges were established for ocular biometric data in healthy Saudi children aged 3–17 years. Establishing normative reference ranges for ocular biometrics in children from diverse ethnic groups would enhance the capacity to diagnose juvenile conditions affecting ocular dimensions.
AUTHORS’ CONTRIBUTIONS
LR and NS contributed to the study’s concept and design, and TH, NB, and EB collected the dataAll authors reviewed the results and approved the final version of the manuscript.
LIST OF ABBREVIATIONS
| ACD | = Anterior chamber depth |
| AXL | = Axial length |
| CST | = Central subfield thickness |
| CV | = Cube volume |
| ETDRS | = Early Treatment Diabetic Retinopathy Study |
| K1 | = Flat meridian of anterior corneal surface |
| K2 | = Steep meridian of anterior corneal surface |
| LE | = Left eye |
| logMAR | = Logarithm of minimal angle of resolution |
| MT | = Macular retinal thickness |
| O.C.T | = Optical coherence tomography |
| ppRNFL | = Peripapillary RNFL |
| RNFL | = Retinal nerve fiber layer |
| RE | = Right eye |
| SE | = Spherical equivalent refraction |
| VA | = Visual acuity |
| VL | = Vitreous length |
ETHICS APPROVAL AND CONSENT TO PARTICIPATE
The KAU Institutional Review Board evaluated and approved this project. (reference no. 701-18).
HUMAN AND ANIMAL RIGHTS
. All procedures performed in studies involving human participants were in accordance with the ethical standards of institutional and/or research committees and with the 1975 Declaration of Helsinki, as revised in 2013.

