All published articles of this journal are available on ScienceDirect.

Retrospective Study of Modifications in Foveal Choroidal Vessel Diameter and Thickness as Indicators for Retreatment of Polypoidal Choroidal Vasculopathy
Abstract
Objective
This study aimed to optimize the retreatment strategy for Polypoidal Choroidal Vasculopathy (PCV) by evaluating changes in Choroidal Vessel Diameter (CVD) and thickness.
Methods
A retrospective study tracked PCV patients receiving antivascular endothelial growth factor conbercept injections with a 3+PRN regimen for 6 months. Key parameters were recorded at various intervals postinjection and at follow-up's end. Recurrence prediction was based on CVD and choroidal changes.
Results
52 patients (54 eyes) diagnosed with PCV were enrolled. 32 eyes (59.2%) showed exudation resolution, forming the resolution group, while 22 eyes (40.7%) formed the non-resolution group. In the resolution group, 18 patients (56.3%) experienced exudation recurrence and underwent retreatment. Best-corrected visual acuity, central retinal thickness, CVD, and CT significantly improved at the 6-month mark. In the resolution group, CVD and CT decreased continuously from baseline to endpoint (p < 0.05), indicating a significant relationship between resolution occurrence and CVD/CT changes. In the recurrence group, CVD and CT (nasal) significantly increased within 1 month before resolution.
Conclusion
In PCV patients treated with antivascular endothelial growth factor, increased CVD and CT during follow-up visits indicate a potential need for retreatment. Predicting retreatment risk based on CVD and CT changes is crucial for future research in determining retreatment necessity for PCV.
1. INTRODUCTION
Polypoidal Choroidal Vasculopathy (PCV) manifests as a polyp-like dilation of the terminal vascular network of the choroidal vasculature. Initially proposed by Yannzzi et al. in the 1980s, PCV exhibits polypoid lesions and a Branching Vessel Network (BVN) as its primary features, often accompanied by recurrent serous exudation. Recent studies suggest that PCV represents a focal structural manifestation of diseases related to Choroidal Thickness (CT) [1, 2]. PCV has diverse prognoses, with a significant percentage of patients experiencing vision loss or relapse within 3 years. It can lead to severe complications post-PDT or anti-VEGF treatment. Anti-VEGF treatment's efficacy is limited to Asian populations. Personalized treatment can enhance patient compliance and reduce poor visual prognosis risk. The PLANET study showed no statistical difference between monotherapy with abicipar pegol and the combined PDT group, suggesting the effectiveness of intravitreal injection. The LAPTOP study revealed that ranibizumab monotherapy achieved better visual gain than PDT after two years [2-6].
Despite the frequent recurrence of PCV, there is a lack of research on prognostic factors related to recurrence. Prognostic factors such as PCV baseline vision, BVN area, choroidal vascular network size, PDT treatment history, and cluster polyps have been previously analyzed [7]. However, their relationship with recurrence remains unclear. Another study highlighted that recurrence is linked to the area and volume of Pigment Epithelial Detachment (PED), larger and more polyps at baseline, genetic markers (such as the T risk allele of ARMS2 A69S), or persistent strong fluorescence in the late phase of Indocyanine Green Angiography (ICGA) after treatment [8-11]. Recurrence is also associated with a worse vision prognosis. However, translating these factors into the current treatment plan and applying them to the treatment strategy for patient follow-up remains challenging [12].
Anti-VEGF treatment efficacy in PCV patients is linked to the choroid's functional status. PCV patients exhibit a greater average CT than AMD patients. Freund et al. introduced thick choroid-related diseases characterized by choroidal thickening, increased permeability, and vessel dilation. Even in PCV patients with normal CT, there is dilation of large choroidal vessels. Asian patients, especially Japanese and Koreans, exhibit PCV clinical features despite having normal CT. Recent studies highlight the importance of Choroidal Vessel Diameter (CVD) in understanding PCV pathology. Pathological dilation of choroidal vessels may underlie PCV pathogenesis. Maximum CVD serves as a sensitive indicator for evaluating choroidal blood perfusion in PCV patients [13-19].
Recent studies have identified that CVD, particularly dynamic CVD changes, can serve as a biological marker for recurrent exudative changes in PCV [20]. However, there are limited reports globally on CVD predicting the treatment timing of PCV. This study aims to establish the correlation between CVD and CT changes and subsequent fluid recurrence (i.e., the appearance of new intraretinal/subretinal/subretinal pigment epithelial fluid after fluid resolution) and retreatment in patients with PCV undergoing anti-VEGF treatment when macular fluid resolves during follow-up [i.e., resolution of intraretinal/subretinal/subretinal pigment epithelial fluid detected by Optical Coherence Tomography (OCT).
2. DATA AND METHODS
2.1. Study Subjects
This retrospective longitudinal study received approval from the Ethics Committee of the First Affiliated Hospital of Dalian Medical University (Approval No.: PJ-KS-KY-2022-284) and adhered to the principles of the “Helsinki Declaration.” The study involved 52 patients (54 eyes) diagnosed with PCV who visited our ophthalmology department from March 2020 to February 2023. The analysis focused on examining the relationship between changes in CVD and CT and the need for retreatment following 3+PRN anti-VEGF treatment, with a minimum follow-up of 6 months.
The diagnosis of active PCV was based on the Japanese angiography standard guidelines, with fundus examination revealing orange-red subretinal elevation lesions and/or ICGA demonstrating characteristic polypoid lesions [21]. Confirmation was performed by the same experienced physician in the fundus disease department. Inclusion criteria included: meeting PCV criteria through FFA, ICGA, and OCT, receiving a 3+PRN strategy anti-VEGF intravitreal injection as a treatment plan, and a follow-up period of at least 6 months. Exclusion criteria included: coexistence of diseases impacting macular function, undergoing certain treatments during the study, CNV caused by other reasons, presence of other retinal diseases affecting vision or choroidal measurement, choroidal atrophy due to high myopia or poor imaging, and excessive Subretinal Fluid (SRF) area or poor image quality.
2.2. Data Collection
Patients underwent routine eye exams at baseline and follow-ups at various intervals posttreatment. Parameters like BCVA, intraocular pressure, and SD-OCT indicators were recorded. The number of injections, fluid resolution, recurrence frequency, and other metrics were tallied. Key SD-OCT indicators included Central Retinal Thickness (CRT), CVD, CT, subretinal pigment epithelium fluid area, and SRF area. BCVA was converted to Log MAR for statistical analysis. Choroidal Vascular Hyperpermeability (CVH) was defined as a high-fluorescence multifocal area with blurred edges in ICGA's late phase. Basic patient information and baseline eye exam results were collected. Follow-up data included BCVA, intraocular pressure, SD-OCT parameters, and eye B-ultrasound.
OCT images were obtained using Fast mode (768 A scan). The following parameters were measured:
2.2.1. CRT
CRT is the vertical distance from the inner limiting membrane to the retinal pigment epithelium Bruch membrane complex at the fovea. The OCT system uses automated identification and measurement of retinal thickness at the macular fovea. Advanced algorithms ensure the precise positioning of follow-up scans at the same location as the baseline, enabling accurate comparisons over time.
2.2.2. CT
CT is the vertical distance from the retinal pigment epithelium-Bruch membrane complex to the sclera's inner surface. We measured CT at three locations: under the fovea centralis and 1500 µm each on the temporal and nasal sides. These measurements are recorded as SFCT, CT temporal, and CT nasal. Choroidal veins, about 63% of the choroidal vasculature, are mainly outside the macular fovea [22, 23]. Assessing CT at specific locations provides a more detailed insight into CT distribution.
2.2.3. CVD
CVD is measured within a 1500 μm range of the macular area by the vertical scan, situated on the outer side of the Haller layer of the choroid. This measurement involves determining the low-reflection inner diameter perpendicular to the Bruch membrane [24].
To enhance clarity, adjustments to brightness and contrast are applied as necessary for accurate distinction of the choroidal vessel layer (Fig. 1A). Retinal PED, inclusive of hemorrhagic PED, serous PED, and serous hemorrhagic PED, as well as SRF, which includes retinal interlayer fluid, intraretinal fluid, SRF, and sub-retinal hemorrhage, are identified in the maximum cross-sectional areas of the plane captured by OCT B-scan. In instances where the area of PED or SRF was <0.01 mm2, it was calculated as 0.01 mm2 (Fig. 1B). Each measurement was independently performed by two experienced professionals, and the average of the two readings was utilized. If there was a difference of >15% or 30 µm in diameter between the two readings, a third person was involved in the measurement, and the average was determined. OCT was measured by Cirrus 5000 (Carl Zeiss Meditec, Germany). The Heidelberg Eye Explorer software (version 1.7.1.0) was used for viewing and measuring the obtained images.
2.3. Statistical Methods
In this study, patients were categorized into “fluid resolution” and “persistent exudation” groups based on fluid resolution during follow-up. The fluid resolution group was further divided into recurrence and control subgroups. Statistical differences between groups were assessed using appropriate tests for categorical and continuous variables. Categorical variables were presented as numbers and percentages, and continuous variables as mean and standard deviation. During the anti-VEGF treatment, time points “D” for fluid resolution and “R” for recurrence were considered. Analyses included both persistent exudation and non-recurrence groups, referencing average time points “D” and “R,” respectively. Statistical analyses focused on CVD and CT changes between “D-1”, “D,” and “R.” Regression analyses explored the correlation between CVD and CT changes and recurrence at “D+1”, assessing the relationship with retreatment demand. Adjustments were made for sex, age, refractive error, and injection number in the multivariate analysis.
Independent t-test was used for the measurement data subject to a normal distribution, while Mann Whitney U test and Friedman M test were used for comparison for those not subject to normal distribution. Count data were described by frequency (percentage), and chi-square test was used for comparison between groups. All statistical analyses were performed using IBM SPSS (IBM SPSS Statistics 24.0, New York, USA), and a significance level of p < 0.05 was considered statistically significant.
3. RESULTS
3.1. Comparison of Clinical Baseline Data between the SRF Regression Group and the Non-regression Group
In the observation of the 52 patients included (average age: 66 ± 12 years), a total of 54 eyes were assessed, with 38 right eyes (70.3%) and 30 eyes (55.6%) belonging to female patients. The average duration of illness was 12.6 ± 18.1 months, and the greatest linear dimension of the lesions was 2484 ± 978.2 μm. Characteristics included 26 eyes (48.2%) with CVH, 20 eyes (37.0%) with multiple polyps, and 36 eyes (66.7%) with branching vascular networks (BVN). The average area of choroidal neovascularization was 5.12 ± 2.81 mm2. The most common ocular adverse event was subconjunctival hemorrhage in 12 eyes (22.2%). At baseline, the mean CRT was 411.0 ± 193.6 μm. The choroidal parameters at baseline had mean values of SFCT at 263.2 ± 61.4 μm, CT (temporal) at 254.8 ± 68.0 μm, CT (nasal) at 243.2 ± 67.4 μm, CVD at 152.9 ± 21.9 μm, PED at 0.10 ± 0.12 μm2, and SRF at 0.24 ± 0.33 μm2. All eyes exhibited intraretinal or SRF on Optical Coherence Tomography (OCT) at baseline.
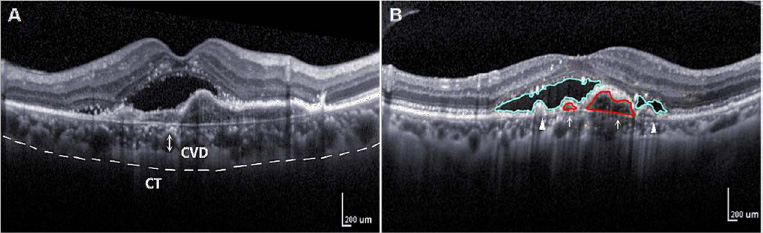
Schematic diagram of choroidal vascular indicators of OCT. A: Measurement of CVD (vertical diameter of the thickest external choroidal vessel in the foveal area, arrow) and CT by reference to a ruler in the OCT system. Dashed lines indicate choroid. B: PED (arrow), SRF (triangle).
During the treatment and follow-up of the 54 eyes, 22 eyes (40.7%) had persistent exudation in the macular area, while 32 eyes (59.2%) experienced regression of intraretinal and SRF for the first time after an average of 3.0 ± 1.3 follow-ups, qualifying them for the fluid regression group. Furthermore, 22 eyes (40.7%) were classified into the non-resolution group. Among the fluid regression group, 18 eyes (56.3%) experienced a recurrence of exudation during the follow-up, needed additional treatment and were thus classified as the recurrence group ('R' in the follow-up visit of recurrence). The remaining 14 eyes (43.4%) were included in the control group. In the recurrence group, six patients experienced fluid recurrence, which subsequently resolved after treatment.
No significant differences were noted between the fluid regression and persistent exudation groups regarding baseline demographics and treatment parameters, except for a significant difference in baseline CVD in the OCT parameters. The non-regression group had a significantly longer duration of illness and larger baseline CVD than the fluid regression group (p = 0.041; p = 0.012), whereas other parameters showed no significant differences (Table 1A).
3.2. Changes in OCT Parameters at various Postoperative Time Points in the SRF Regression Group and the Non-regression Group
Despite no differences in baseline BCVA and CRT between the regression and non-regression groups, the average injection frequency in eyes from the non-regression group was significantly higher than that in the SRF regression group (Table 1A). Eyes with persistent macular edema after an average of 2 months of treatment had a worse prognosis than eyes with fluid regression, with a prognosis related to the duration of illness and the baseline size of CVD.
| A. Baseline Characteristics of Patients with PCV | ||||
|---|---|---|---|---|
| Baseline, Mean (SD) | Total | Non-resolution (N=22) | Resolution (N=32) | p-value |
| Age, y | 66 (12) | 67 (12) | 65 (11) | 0.46 |
| Male, n(%) | 30 (55.6%) | 16 (53.3%) | 14 (46.7%) | 0.28 |
| DM, n(%) | 6 (11.1%) | 2 (33.3%) | 4 (66.7%) | 1.00 |
| HTN, n(%) | 18 (33.3%) | 12 (66.7%) | 6 (33.3%) | 0.11 |
| logMAR VA | 0.8 (0.4) | 0.7 (0.3) | 0.9 (0.5) | 0.07 |
| IOP, mmHg | 16 (3) | 16 (2) | 16 (2) | 0.14 |
| Refraction, SE (D) | 0.32 (1.1) | 0.39 (1.1) | 0.27 (0.9) | 0.08 |
| Onset time, m | 12.6 (18.1) | 17.5 (22.1) | 8.7 (15.1) | 0.04 |
| GLD, μm | 2484 (978.2) | 2846 (1175.2) | 2123 (785.2) | 0.31 |
| CVH, n(%) | 26 (48.2%) | 8 (66%) | 5 (31%) | 0.12 |
| Multiple polyps, n(%) | 20 (37.0%) | 6 (30.0%) | 14 (70.0%) | 0.43 |
| BVN, mm2 | 5.12 (2.81) | 5.57 (3.64) | 4.75 (2.13) | 1.00 |
| SD-OCT, Mean (SD) | - | - | - | - |
| PED, mm2 | 0.10 (0.12) | 0.15 (0.16) | 0.07 (0.09) | 0.15 |
| SRF, mm2 | 0.24 (0.33) | 0.26 (0.30) | 0.22 (0.36) | 0.75 |
| CRT, μm | 411.0 (193.6) | 393.3 (163.0) | 417.3 (208.3) | 0.74 |
| CVD, μm | 152.9 (21.9) | 163.0 (19.9) | 138.8 (20.8) | 0.01 |
| SFCT, μm | 263.2 (61.4) | 268.8 (51.5) | 256.1 (66.3) | 0.56 |
| CT (temporal), μm | 254.8 (68.0) | 258.9 (64.2) | 253.8 (77.6) | 0.89 |
| CT (nasal), μm | 243.2 (67.4) | 245.9 (27.9) | 239.6 (68.8) | 0.73 |
| Treatment | - | - | - | - |
| Average number of injections | 4.3 (1.0) | 5.5 (0.7) | 3.8 (1.1) | 0.03 |
| Baseline, Mean (SD) | Resolution (N=32) | Non-resolution | p-value |
|---|---|---|---|
| Baseline | - | - | - |
| CVD, μm | 138.8 ± 20.8 | 163.0 ± 19.9 | 0.01 |
| SFCT, μm | 256.1 ± 66.3 | 268.8 ± 51.5 | 0.56 |
| CT (temporal), μm | 253.8 ± 77.6 | 258.9 ± 64.2 | 0.89 |
| CT (nasal), μm | 239.6 ± 68.8 | 245.9 ± 27.9 | 0.73 |
| D-1 | - | - | - |
| CVD, μm | 130.7 ± 36.5 | 151.1 ± 41.3 | <0.01 |
| SFCT, μm | 239.8 ± 54.6 | 258.3 ± 46.9 | 0.42 |
| CT (temporal), μm | 230.3 ± 68.5 | 257.6 ± 63.5 | 0.90 |
| CT (nasal), μm | 235.0 ± 72.1 | 249.6 ± 28.6 | 0.81 |
| D | - | - | - |
| CVD, μm | 129.1 ± 45.7 | 149.9 ± 42.5 | 0.01 |
| SFCT, μm | 232.9 ± 71.4 | 242.8 ± 49.5 | 0.03 |
| CT (temporal), μm | 217.7 ± 58.0 | 240.1 ± 52.9 | <0.01 |
| CT (nasal), μm | 223.3 ± 67.5 | 248.3 ± 28.0 | <0.01 |
| Baseline to D*, p-value | - | - | - |
| CVD, μm | 0.03 | 0.34 | - |
| SFCT, μm | <0.01 | 0.07 | - |
| CT (temporal), μm | <0.01 | 0.16 | - |
| CT (nasal), μm | <0.01 | 0.13 | - |
| D-l to D**, p-value | - | - | - |
| CVD, μm | 0.70 | 0.80 | - |
| SFCT, μm | 0.28 | 0.05 | - |
| CT (temporal), μm | 0.69 | 0.19 | - |
| CT (nasal), μm | 0.08 | 0.30 | - |
With the progression of anti-VEGF treatment, the subretinal fluid regression group exhibited a continuous decrease in both CVD and SFCT from baseline to the D follow-up, reaching fluid regression (p = 0.03, p < 0.01). CT in the temporal and nasal regions also showed a similar trend (p < 0.01 for both), with no significant changes observed between D-1 and D follow-ups (Table 1B). However, in the persistent exudation group (non-regression group), there were no significant changes in CVD, SFCT, nasal choroidal thickness, and CCT between the two follow-ups. At the D follow-up time point, there was a significant decrease in relative CVD and choroidal thickness in the SRF regression group (p < 0.05 for both), indicating a substantial correlation between the occurrence of fluid regression and changes in CVD and CT.
3.3. Changes in CVD and CT between the Recurrence Group and the Control Group at Baseline, 1 month before Fluid Regression (D-1), Fluid Regression (D), and Recurrence (R)
To clarify whether choroidal parameters are involved in the pathogenesis of PCV exudation changes, eyes achieving fluid regression were divided into recurrence and non-recurrence groups, with the addition of the time point “R” indicating the follow-up time of recurrence. For eyes in the recurrence group (recurrence group), CVD and CT 1 month before fluid regression (“D-1”) were analyzed. In the recurrence group, the average time of recurrence was noted at the 4th follow-up visit, corresponding to the visit immediately after fluid regression at the time “D.” The control group (non-recurrence group) utilized the 4th follow-up visit of eyes without recurrence in the fluid regression group as control (Fig. 2).
3.4. Changes in some OCT Parameters at each Time Point in the Recurrence Group and the Control Group
In the control group (non-recurrence group), the CVD, SFCT, CT (temporal side), and CT (nasal side) continuously decreased from baseline to D-1 follow-up (p < 0.05), and there were no significant changes within one month before the disappearance of effusion (Table 2). In the recurrence group, the trends of each index from baseline to D-1 follow-up were similar to those of the control group (p < 0.05 for all). Between the D-1 and D follow-ups, the CVD increased significantly (p = 0.04), and the changes in CVD were not significant in the subsequent follow-ups (Table 2). Although there was no significant change in choroidal thickness in the former, it increased significantly within one month before the recurrence of R. In contrast, there were no significant differences in the changes in CVD and choroidal thickness between the two follow-ups in the control group. These changes in CVD and choroidal thickness were significantly different between the recurrence group and the non-recurrence group (p < 0.05).
3.5. Relationship between Changes in CVD and CT before and after Follow-up “D” and Subsequent Retreatment in Patients with Fluid Regression
In a multivariate model, multivariate binary logistic regression adjusting for sex and age was employed to analyze predictive factors for the presence of macular edema at the fluid regression time point “D” and recurrence time point “R”. Compared with eyes with a significant decrease in CVD from baseline to D, patients with a significant increase in CVD [odds ratio (OR): 3.8, [95% confidence interval (CI) 0.3–14.1; p = 0.01] and an increase in CT (SFCT OR: 4.4, 95% CI: 0.9–9.6; p < 0.01, CT (temporal) OR: 3.2, 95% CI: 0.5–5.1; p = 0.04, CT (nasal) OR 4.2, 95% CI: 1.4–13.2; p = 0.03) had a higher probability of macular edema, and the likelihood of retreatment significantly increased (Table 3).
Similarly, during the transition from D to R, compared with eyes with a significant decrease in CVD, patients with a significant increase in CVD (OR: 4.5, 95% CI: 0.9–32.1; p = 0.01) (Table 3) and an increase in CT (SFCT OR: 6.5, 95% CI: 1.8–32.1; p = 0.04) had a significantly increased probability of retreatment. Similar changes were observed in the temporal and nasal aspects (CT [temporal] OR: 1.7, 95% CI: 0.6–5.9; p = 0.03, CT [nasal] OR: 1.7, 95% CI: 0.3–11.5; p = 0.05) (Table 3).
4. DISCUSSION
Managing PCV poses significant challenges, often requiring repeated injections to prevent recurrence. Inadequate handling of recurrent exudation can lead to irreversible vision loss. This study shows that despite fluid resolution, the objectively measured CVD and CT significantly increased under OCT-EDI mode, predicting the possibility of retreatment. These results indicate that monitoring changes in CVD has potential practical value for improving the risk stratification of PCV.
The thickening of the choroid and abnormal dilation of choroidal vessels in patients with PCV have undergone extensive investigation [18-20, 14, 25-30]. Recently, scholars have introduced the concept of 'thick choroid-related disease' to encompass conditions such as Pachychoroid Pigment Epitheliopathy (PPE), Central Serous Chorioretinopathy (CSC), choroidal thickening-associated neovascularization, and PCV [14, 31]. These diseases not only share common characteristics like choroidal congestion, thickening, dilation of choroidal outer layer vessels, and excessive permeability but are also intricately interconnected, as evident in the association between the corresponding choroidal capillary layer and Sattler's layer [14, 32-34].
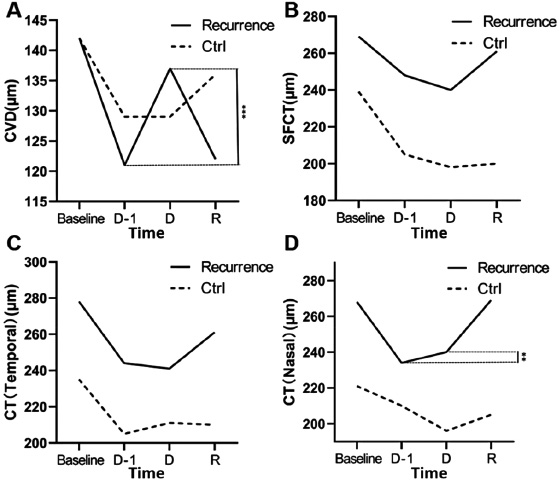
Changes in CVD and choroidal thickness between the recurrence group and the control group at baseline, the month before the appearance of fluid resolution (D-I), and between the resolution of fluid D and the recurrence R. A: CVD, B: SFCT, C: CT (temporal side), D: CT (nasal side). Time points D: fluid resolution, R: recurrence, CVD: choroidal vessel diameter, SFCT: subfoveal choroidal thickness, CT: choroidal thickness.
| Changes in OCT between the Recurrence Group and the Control Group | ||||
|---|---|---|---|---|
| Recurrence | CVD | SFCT | CT (temporal) | CT (nasal) |
| Baseline | 154.4 ± 18.8 | 266.6 ± 63.6 | 275.3 ± 79.2 | 265.7 ± 75.3 |
| D-1 | 122.9 ± 39.3 | 245.4 ± 59 | 244.0 ± 69.1 | 233.1 ± 69.6 |
| △ Change (%) | -12.7% | -8.5% | -12.7% | -13.7% |
| P* | 0.02 | 0.03 | 0.03 | 0.01 |
| D | 136.5 ± 47 | 239.2 ± 59.8 | 244.40 ± 68.5 | 239.7 ± 61.9 |
| △ Change (%) | 10.9% | -2.4% | -0.4% | 2.0% |
| P** | 0.04 | 0.81 | 0.87 | 0.51 |
| R | 136.7 ± 42.4 | 258.2 ± 52.6 | 258.3 ± 79.2 | 266.5 ± 58.4 |
| △ Change (%) | -0.1% | 7.9% | 6.5% | 11.2% |
| P# | 0.67 | 0.03 | 0.02 | <0.01 |
| Ctrl | CVD | SFCT | CT (temporal) | CT (nasal) |
| Baseline | 152.5 ± 19.2 | 247.2 ± 58.4 | 241.5 ± 85.0 | 216.1 ± 52.3 |
| D-1 | 138.9 ± 28.1 | 215.5 ± 65.1 | 214.3 ± 58.7 | 196.9 ± 54.1 |
| △ Change (%) | -10.9% | -12.8% | -9.9% | -9.2% |
| P* | 0.02 | 0.02 | 0.01 | 0.06 |
| D | 138.4 ± 47.6 | 216 ± 68.2 | 211.9 ± 69.5 | 196.6 ± 38.6 |
| △ Change (%) | -0.1% | 0.4% | -0.1% | 0.0% |
| P** | 0.97 | 0.58 | 0.93 | 0.11 |
| R | 132.5 ± 24.6 | 200.2 ± 67.8 | 225.7 ± 87.1 | 208.6 ± 42.8 |
| △ Change (%) | -3.6% | 7.4% | 6.6% | 6.1% |
| P# | 0.38 | 0.39 | 0.34 | 0.06 |
| Changes in CVD and CT before and after Follow-up "D" | |||||||
|---|---|---|---|---|---|---|---|
| Baseline-D* | Age | Male (%) | Total | D# (%) | OR (95%CI) | P | |
| CVD | decrease | 65 ± 12 | 16 (39.1%) | 41 | 20 (48.7%) | 3.8 (0.3-14.1) | 0.01 |
| up | 65 ± 6 | 11 (69.5%) | 15 | 5 (33.3%) | |||
| SFCT | decrease | 65 ± 10 | 21 (43.6%) | 46 | 20 (43.4%) | 4.4 (0.9-9.6) | <0.01 |
| up | 64 ± 4 | 6 (61.0%) | 11 | 8 (72.7%) | |||
| CT (temporal) |
decrease | 62 ± 11 | 23 (51.2%) | 43 | 20 (46.5%) | 3.2 (0.5-5.1) | 0.04 |
| up | 68 ± 8 | 5 (33.3%) | 12 | 6 (50.0%) | |||
| CT (nasal) |
decrease | 63 ± 14 | 19 (50.0%) | 40 | 22 (55.0%) | 4.2 (1.4-13.2) | 0.03 |
| up | 68 ± 9 | 7 (37.7%) | 18 | 8 (44.4%) | |||
| D-R** | Age | Male (%) | Total | D# (%) | OR (95%CI) | P | |
| CVD | decrease | 62 ± 8 | 6 (33.0%) | 12 | 4 (33.3%) | 4.5 (0.9-32.1) | 0.01 |
| up | 66 ± 12 | 13 (68.2%) | 21 | 14 (66.7%) | |||
| SFCT | decrease | 59 ± 12 | 13 (65.7%) | 19 | 12 (63.1%) | 6.5 (1.8-32.1) | 0.04 |
| up | 71 ± 8 | 6 (42.0%) | 15 | 6 (40.0%) | |||
| CT (temporal) |
decrease | 70 ± 7 | 7 (66.7%) | 13 | 8 (61.5%) | 1.7 (0.6-5.9) | 0.03 |
| up | 63 ± 12 | 10 (51.3%) | 20 | 10 (50.0%) | |||
| CT (nasal) |
decrease | 64 ± 3 | 5 (48.2%) | 9 | 6 (66.7%) | 1.7 (0.3-11.5) | 0.05 |
| up | 64 ± 13 | 14 (61.3%) | 24 | 12 (50.0%) | |||
As a retrospective observational study, there are inherent limitations, such as selection bias and confounding factors. In our study, the increase in CT aligns with the findings of Koizumi et al. [12], who measured the average SFCT in patients with PCV as 293 μm. We noted that CT was slightly thinner nasally compared with temporally, in line with other research results. Importantly, anti-VEGF treatment effectively regulates high CVD and CT, highlighting its significant efficacy. Kunbei Lai et al. [18, 19, 30] established a robust correlation between choroidal vessel dilation and changes in CT, mirroring our study's findings. In our study, the reduction in CVD and CT parameters following the commencement of injection, compared with baseline, aligns with these early observations.
The concept of a “thick choroid,” as proposed by Balaratnasingam et al. [2], encapsulates not only an absolute increase in thickness but also a relative decrease in the Sattler layer and choroidal capillary layer thickness, coupled with the pathological dilation of Haller layer vessel caliber [16]. Increased interstitial fluid content and alterations in choroidal matrix components may also contribute to increased CT, although current in vivo imaging techniques lack the precision to reliably assess these factors. Furthermore, Koizumi et al. [17] demonstrated that choroidal vascular permeability is notably elevated in PCV eyes, often resulting in a suboptimal response to ranibizumab treatment. In our study, patients in the non-regression group exhibiting persistent fluid during the follow-up period and a suboptimal response to anti-VEGF treatment may be attributed to excessively high choroidal venous pressure and permeability rather than VEGF dominance.
Additionally, repeat ICGA examinations were only performed in some cases to evaluate the status of polyps and BVN after treatment at the site of fluid regression. Although ICGA can provide more information regarding the relationship between polyps, BVN persistence or recurrence after treatment, CVD, CT changes, and fluid recurrence, its invasive nature and cost limitations restrict its routine use in clinical practice. Lastly, this study did not include eyes undergoing PDT combined treatment. Hence, future prospective studies should encompass a larger population, incorporating cases undergoing chronic anti-VEGF and PDT combination therapy. Additionally, a more in-depth evaluation of the neovascular condition using fluorescein angiography and ICGA is essential to address these limitations (Fig. 3).
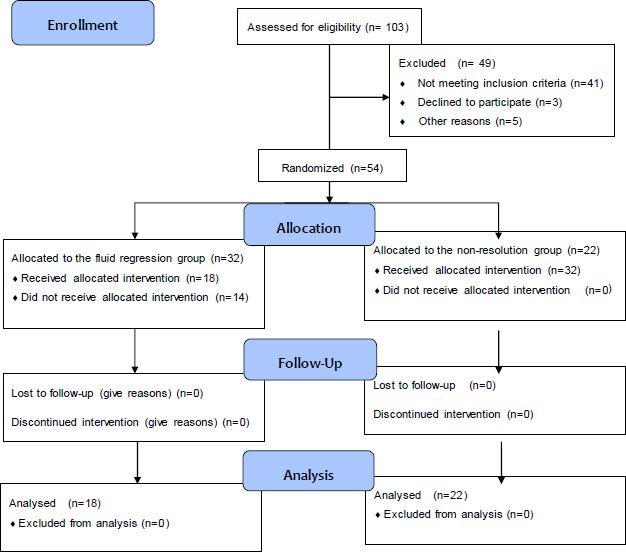
STROBE diagram.
CONCLUSION
In conclusion, this study underscores that, among patients with PCV undergoing a 3+PRN regimen of anti-VEGF therapy, eyes with persistent macular edema at an average of 2 months during the 6-month follow-up period exhibit a more unfavorable prognosis compared to eyes with fluid regression. The prognosis is intricately linked to disease duration and baseline CVD. Even after the regression of macular edema, the observed increase in CVD and CT during follow-up/re-examination signals a heightened risk of retreatment. Predicting the likelihood of retreatment based on changes in CVD and CT empowers ophthalmologists to make proactive decisions, allowing for the timely initiation or delay of retreatment at each follow-up rather than reactively addressing cases of exudative or hemorrhagic recurrence. This approach not only contributes to the tailored customization of PCV treatment strategies but also enhances long-term visual outcomes. Proposing an extension beyond retreatment criteria reliant on the recurrence of intra or SRF or new hemorrhage, incorporating changes in CVD and CT, is a crucial consideration. Subsequent research is imperative to assess whether monitoring and treatment decisions based on CVD and CT can effectively diminish the recurrence of PCV and ultimately preserve vision in affected individuals.
AUTHORS’ CONTRIBUTION
Y.W.: Conceptualization; X.M.: Data curation; C.M.: Formal analysis; X.M.: Funding acquisition; Y.W.: Investigation; Y.W.: Methodology; C.F. and X.M.: Project administration; Y.E.: Resources; C.M.: Software; Y.W.: Supervision; C.M.: Validation; C.M.: Visualization; C.F.: Writing - original draft; Y.W.: Writing - review and editing.
LIST OF ABBREVIATIONS
| CVD | = Choroidal Vessel Diameter |
| PCV | = Polypoidal Choroidal Vasculopathy |
| BVN | = Branching Vessel Network |
| CT | = Choroidal Thickness |
| PED | = Pigment Epithelial Detachment |
| ICGA | = Indocyanine Green Angiography |
| SRF | = Subretinal Fluid |
| CRT | = Central Retinal Thickness |
| CVH | = Choroidal Vascular Hyperpermeability |
| OCT | = Optical Coherence Tomography |
| PPE | = Pachychoroid Pigment Epitheliopathy |
ETHICS APPROVAL AND CONSENT TO PARTICIPATE
This retrospective longitudinal study received approval from the Ethics Committee of the First Affiliated Hospital of Dalian Medical University, China (Approval No.: PJ-KS-KY-2022-284).
HUMAN AND ANIMAL RIGHTS
All human research procedures followed were in accordance with the ethical standards of the committee responsible for human experimentation (institutional and national), and with the Helsinki Declaration of 1975, as revised in 2013.
AVAILABILITY OF DATA AND MATERIALS
The data supporting the findings of the article is available in the Zenodo Repository at https://zenodo.org/records/14831266.
FUNDING
This work was supported by the National Key Research and Development Program of China (No. 2022YFC2403002) and the National Natural Science Foundation of China (No. 81271022).
ACKNOWLEDGEMENTS
Declared none.

