All published articles of this journal are available on ScienceDirect.

Choroidal Thickness in Non-proliferative Diabetic Retinopathy vs Healthy Eyes using SS-OCT
Authors Info & Affiliations
Abstract
Background
The association between choroidal changes and diabetic retinopathy pathophysiology remains unclear.
Objective
We aimed to assess choroidal thickness (CT) in patients with Non-Proliferative Diabetic Retinopathy (NPDR) using swept-source optical coherence tomography (SS-OCT) and compare it with that of healthy individuals.
Methods
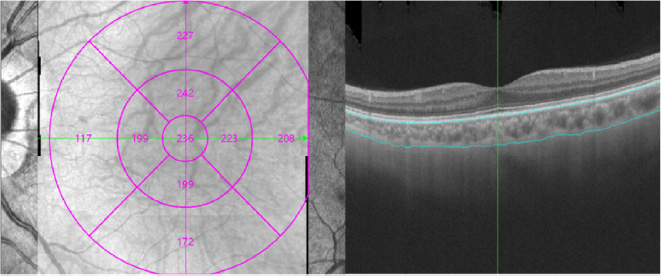
We included patients with NPDR (NPDR group) and healthy individuals (control group). All the enrolled eyes were examined using SS-OCT, and CT measurements were obtained within a 6×6 mm area centered on the macular fovea. The area was divided into three regions: the central foveal region (0–1 mm), inner ring (1–3 mm from the foveal center), and outer ring (3–6 mm from the foveal center). Furthermore, both the inner and outer rings were segmented into four quadrants (superior, inferior, nasal, and temporal).
Results
The mean CT in the central foveal region was higher in NPDR group than in control group (P < 0.001). The mean CT in the four quadrants in the inner ring was higher in NPDR group than in control group (superior: P = 0.023; inferior: P = 0.003; nasal: P = 0.001; temporal: P = 0.003). In the outer ring region, the mean CT in the inferior and nasal quadrants was higher in NPDR group than in control group (P = 0.037; P < 0.001). The mean CT in the superior and temporal quadrants in the outer ring was higher in the NPDR group, but the difference was not significant.
Conclusion
This study concludes that CT was greater in patients with NPDR than in healthy individuals.
1. INTRODUCTION
Type-two diabetes mellitus (T2DM) is prevalent globally, with diabetic retinopathy (DR) emerging as a leading cause of blindness among working-age adults [1]. With population aging and shifting dietary habits, DR has become a pressing public health concern. However, the precise mechanisms underlying DR remain somewhat elusive. The choroid is crucial for ocular health, receiving 95% of total ocular blood flow and providing essential nutrients to the outer retinal layers [2]. It is the only blood supply source for the avascular fovea [3]; therefore, any retinal vascular changes in DR, primarily due to ischemia, can lead to abnormalities such as microaneurysms, vascular tortuosity, edema, exudation, impaired perfusion, or retinal neovascularization, resulting in decreased visual acuity (VA). Remarkably, the choroid exhibits vascular impairments in thickness and volume [4-6], suggesting that it plays a role in the pathophysiological mechanisms of DR [7]. Choroidal thickness (CT) is a critical parameter for assessing choroidal structure. Historically, angiography involving indocyanine green injection into blood vessels was used to visualize choroidal vessels. However, this method was invasive and could not illustrate the choroid's three-dimensional structure [8, 9]. In addition, CT studies have yielded inconsistent results, with some reporting thickening, others thinning, and some finding no significant changes [10, 11]. In addition, although choroidal changes in diabetic retinopathy (DR) have been explored, most studies focused on advanced stages (proliferative DR) or combined NPDR/PDR populations, early-stage NPDR remains understudied, particularly regarding regional CT variations. Here, we utilized swept-source OCT (SS-OCT)—a technology with superior resolution (1,050 nm wavelength) and automated segmentation [12, 13]—to investigate CT in strictly defined NPDR patients without confounding treatments (anti-VEGF). Moreover, SS-OCT devices result in improved image penetration in retinal and choroidal tissues than the conventional spectral domain (SD)-OCT devices [14], it can automatically generate choroidal volume and thickness measurements [15]. The approach allows precise quadrant-based analysis, addressing a critical gap in understanding early choroidopathy mechanisms. Considering these advancements, we aimed to evaluate CT in patients with Non-proliferative Diabetic Retinopathy (NPDR) and compare these findings with those from healthy individuals using SS-OCT. Further exploring the pathogenesis of DR could provide valuable insights into the clinical diagnosis and treatment.
2. MATERIALS AND METHODS
2.1. Patient Enrollment
Patients diagnosed with T2DM with NPDR were recruited from a university hospital in Chengdu, China, from June 2022 to December 2023. The study adhered to the principles of the Declaration of Helsinki, and written consent for participation was obtained from the patients or their immediate family members. The study was approved by the Ethics Committee of the Affiliated Chengdu 363 Hospital of Southwest Medical University.
2.2. Inclusion and Exclusion Criteria
The inclusion criteria were: patients aged 45–75 years, diagnosed with NPDR by two professional ophthalmologists (work more than 10 years in retinal disease). The exclusion criteria were: having undergone ocular treatments, such as ocular surgery or retinal laser therapy, and those who had received ocular injections of medications, including anti-vascular endothelial growth factor (VEGF) or OZURDEX. Patients with systemic conditions affecting choroidal circulation (hypertension history: blood pressure >140/90 mmHg, diabetic nephropathy, or cardiovascular disease) were excluded. Meanwhile, patients with eye diseases (such as uveitis, glaucoma, corneal diseases, or retinal diseases) and those with media opacity affecting retinal image clarity were also excluded, as were individuals with refractive errors exceeding ± 6 diopters. The experimental group (the NPDR group) consisted of patients meeting these criteria. A control group was formed with healthy individuals without other ocular or systemic diseases.
2.3. Ophthalmic Examination
All patients underwent a comprehensive ophthalmic examination, including slit-lamp and fundus examinations, fundus photography, best-corrected VA assessment, and measurement of intraocular pressure (IOP). Additionally, the patients' medical history and duration of diabetes were recorded. Swept-source OCT (SS-OCT) (VG200S, SVision Imaging; Henan, China) was utilized to examine all included eyes. Compared to conventional SD-OCT, SS-OCT offers three key advantages for choroidal imaging: enhanced penetration, high-speed scanning and automated segmentation. These technical advancements ensure precise and objective CT measurements, particularly in diabetic eyes with potential edema or structural disruption. It also integrates eye tracking to generate thickness maps of the retina and choroid while maintaining central fixation. The macular region (6×6 mm) was evaluated.
2.4. Measurement of CT
CT was defined as the distance between the choro-scleral interface and the outer border of the retinal pigment epithelium (RPE). An automated built-in calibration software was employed to calculate CT for each sector. The examination grid was divided into nine sectors: the central foveal region (0–1 mm) and the inner ring extended 1–3 mm from the foveal center. The outer ring extended 3–6 mm from the foveal center. The inner and outer rings were further divided into four quadrants (superior, inferior, nasal, and temporal), as depicted in Fig. (1). All SS-OCT assessments were conducted by experienced technicians, and scans of poor image quality were excluded.
2.5. Statistical Analysis
Data normality was assessed using the Kolmogorov–Smirnov test and Q-Q plots. The independent t-test was employed to evaluate statistically significant differences in CT between the experimental and control groups. The statistical analysis was conducted using IBM SPSS Statistics 21.0; effect sizes and confidence intervals (CIs) were calculated with the threshold for statistical significance set at P < 0.05.
3. RESULTS
3.1. Patient Characteristics
This study included 52 patients with NPDR, ranging in age from 45 to 75 years, amounting to a total of 104 eyes for analysis. For the control group, 62 eyes from 31 healthy volunteers were selected. The NPDR group had 16 female and 36 male patients, while the control group had 16 female and 15 male patients. The average age of patients was 56.00 ± 9.08 group and 38.94 ± 10.92 years in the NPDR and control groups, respectively. The average duration of diabetes was 4.67 ± 1.41 years in the NPDR group. In both groups, the IOP values fell within the normal range. Table 1 presents a comprehensive overview of the demographic characteristics of both groups.
3.2. CT in the Central Foveal Region (0-1 mm)
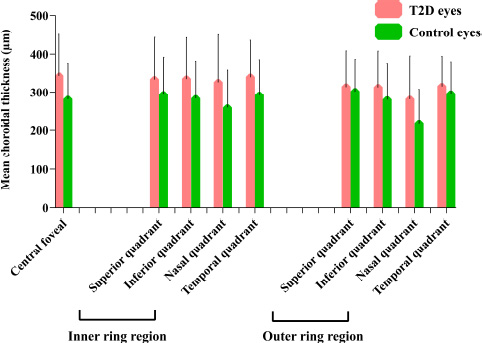
In the central foveal region (0-1 mm), the mean CT was 343.21 ± 107.84 µm and 282.56 ± 92.81 µm in the NPDR and control groups, respectively. The mean CT was significantly higher in the NPDR group than in the control group (P < 0.001) (Table 2 and Fig. 2).
3.3. CT in the Inner Ring Region (1-3 mm)
Within the inner ring spanning 1-3 mm from the foveal center, the mean CT in the superior quadrant was higher in the NPDR group (333.71 ± 110.01 µm) than that in the control group (294.98 ± 97.47 µm) (P = 0.023). Similarly, in the inferior quadrant, the mean CT was higher in the NPDR group (334.71 ± 107.92 µm) than in the control group (284.48 ± 97.40 µm) (P = 0.003). The mean CT was also higher in both the nasal (326.00 ± 124.51 µm) and temporal quadrants (339.75 ± 96.61 µm) in the NPDR group than in the control group (nasal: 261.16 ± 96.75 µm, temporal: 292.97 ± 92.12 µm) (P = 0.001, P = 0.003) (Table 2 and Fig. 2).
T2D, type two diabetes, inner ring region: 1–3 mm from the foveal center, outer ring region: 3–6 mm from the foveal center.
|
NPDR Group (n = 104) |
Control Group (n = 62) |
P value | |
|---|---|---|---|
| Age (years) | 56.00 ± 9.08 | 38.94 ± 10.92 | < 0.001 |
| IOP (mmHg) | 13.38 ± 2.72 | 13.45 ± 2.76 | 0.91 |
| BCVA (Snellen) | 0.81 ± 0.14 | 0.88 ± 0.17 | 0.005 |
| Duration of T2DM (y) | 4.67 ± 1.41 | - | - |
| Subfield/Quadrants |
NPDR Group |
Control Group | Mean Difference(95%CI) | P value |
|---|---|---|---|---|
| Central foveal | 343.21 ± 107.84 | 282.56 ± 92.81 | 28.17-93.12 | < 0.001 |
| Inner ring region (μm) | ||||
| Superior | 333.71 ± 110.01 | 294.98 ± 97.47 | 5.30-72.16 | 0.023 |
| Inferior | 334.71 ± 107.92 | 284.48 ± 97.40 | 17.24-83.22 | 0.003 |
| Nasal | 326.00 ± 124.51 | 261.16 ± 96.75 | 28.41-101.26 | 0.001 |
| Temporal | 339.75 ± 96.61 | 292.97 ± 92.12 | 16.70-76.87 | 0.003 |
| Outer ring region (μm) | ||||
| Superior | 314.71 ± 93.78 | 302.15 ± 84.81 | -16.12-41.25 | 0.388 |
| Inferior | 313.03 ± 94.87 | 281.31 ± 93.19 | 1.86-61.58 | 0.037 |
| Nasal | 282.10 ± 113.68 | 219.85 ± 88.94 | 28.94-95.57 | < 0.001 |
| Temporal | 315.77 ± 79.05 | 296.85 ± 83.16 | -6.62-44.45 | 0.146 |
| Subfield/Quadrants |
NPDR Group (Adj. Mean± SEM) |
Control Group (Adj. Mean± SEM) |
Mean Difference(95%CI) |
P value (ANCOVA) |
|---|---|---|---|---|
| Central foveal | 343.37±10.17 | 256.44±19.53 | 39.17-134.71 | < 0.001 |
| Inner ring region (μm) | ||||
| Superior | 342.05±10.28 | 255.16±19.74 | 38.62-135.17 | < 0.001 |
| Inferior | 342.27±10.13 | 241.98±19.45 | 52.73-147.84 | < 0.001 |
| Nasal | 327.68±11.41 | 229.00±21.90 | 45.11-152.24 | < 0.001 |
| Temporal | 343.22±9.37 | 263.42±17.99 | 35.80-123.79 | < 0.001 |
| Outer ring region (μm) | ||||
| Superior | 327.86±8.64 | 259.88±16.60 | 27.39-108.56 | 0.001 |
| Inferior | 322.64±9.08 | 240.85±17.43 | 39.16-124.42 | < 0.001 |
| Nasal | 280.80±10.50 | 197.18±20.17 | 34.30-132.95 | 0.001 |
| Temporal | 323.72±7.81 | 266.50±14.99 | 20.57-93.88 | 0.002 |
3.4. CT in the Outer Ring Region (3-6 mm)
The mean CT in the inferior quadrant (313.03 ± 94.87 µm) and nasal quadrant (282.10 ± 113.68 µm) were higher in the NPDR group than in the control group (281.31 ± 93.19 µm, 219.85 ± 88.94 µm) (P = 0.037, P < 0.001). However, while the NPDR group exhibited slightly higher mean CT in the superior and temporal quadrants, no significant differences were observed between the NPDR and control groups (Table 2 and Fig. 2).
3.5. CT in the all Regions with Age Adjustment
To account for the age disparity, an ANCOVA was performed with age as a covariate. After adjustment, the NPDR group maintained significantly thicker choroid in the central foveal region (P < 0.001), inner ring quadrants (P< 0.001), and outer ring quadrants (Superior: P <0.001, Inferior: P <0.001, Nasal: P <0.001; Temporal: P=0.003), confirming that CT differences are independent of age (Table 3).
4. DISCUSSION
DR has become a significant public health concern, with the increasing incidence posing a serious challenge. Choroidal changes are thought to play a role in the development of DR [16]. Previous invasive imaging tests for measuring choroidal thickness were highly inconvenient and often produced inaccurate data, making it difficult to study this parameter effectively. In our study, we utilized SS-OCT to compare CT in individuals with NPDR and healthy individuals. The aim was to explore potential associations between CT and T2DM. Various factors, such as autonomic dysfunction and microvascular damage, can cause CT to either increase or decrease, depending on the underlying pathology. T2DM is well-known to induce diffuse vascular dysfunction [17]. This vascular dysfunction can result in various fundus lesions, including hemorrhages, exudation, and even retinal detachment, all of which significantly impair vision. Despite these serious consequences, there have been relatively few studies investigating choroidal changes. In this study, we used advanced SS-OCT to assess CT in patients with NPDR. Our findings revealed a significant increase in CT across all quadrants in NPDR patients compared with that in healthy controls.
While several previous studies have explored CT in diabetic patients, research that focuses on CT in patients with the early stages of diabetes is limited. Our study addressed this research gap, shedding light on how CT is altered in patients with NPDR.
Previous studies reported conflicting CT changes in DR, likely due to differences in disease staging and imaging modalities. Kocasarac et al. [18] observed thinner CT in subfoveal, temporal, and nasal areas in patients with diabetic nephropathy and T2DM without nephropathy. Similarly, Querques et al. [16] observed generalized choroidal thinning in diabetes using enhanced-depth imaging OCT. However, they did not find significant differences among different diabetic groups. Meanwhile, both Adhi et al. [19] and Unsal et al. [20] indicated thinning of the subfoveal choroid in eyes with proliferative DR (PDR) and clinically significant macular edema. However, they reported no significant difference between the control and non-proliferative DR (NPDR) groups. In a study aimed at exploring the influence of microalbuminuria on the choroidal thickness in patients with diabetes, patients with T2DM exhibited a thinner CT than non-diabetic controls, as reported by Ashour et al. [21]. Meanwhile, Da Silva et al. noted that patients with T2DM exhibited a decrease in CT. Interestingly, the preservation of choriocapillaris density, essential for outer retina and RPE health, may be linked to the thinning of choroidal layers, such as Haller's and Sattler's layers [22]. Choroidal thinning may imply reduced blood flow, which could lead to retinal tissue hypoxia. Additional experimental studies are warranted to establish whether CT is a primary consequence or a secondary effect of retinal ischemia. Furthermore, previous studies included participants with conditions at various stages of DR, encompassing PDR, NPDR, and even mixed NPDR and PDR cases, potentially contributing to different results compared with our findings. The lack of participant stratification based on lesion severity could be another factor contributing to discrepancies in study results. Additionally, variations in sample sizes may also explain the observed differences.
Some studies have yielded results consistent with our findings. For instance, Yazici et al. demonstrated that 91 patients with diabetes, with or without diabetic polyneuropathy, exhibited an increase in CT compared to 42 healthy controls [23]. Wang et al. reported a rise in CT during the early stages of DR, followed by a decrease as DR progressed [24]. This study reached a conclusion similar to ours, although it did not include a non-diabetic control group. Kim et al. reported thicker choroids in diabetic patients [25]. Oliveira-Ferreira et al. compared patients with T2DM who did not exhibit apparent DR with healthy controls and found that the patients had a higher mean sub-foveal CT than the controls [26]. Tavares et al. [2] also noted increased CT among diabetic patients without DR.
The conflicting CT findings in diabetic retinopathy (DR) literature likely stem from two key factors:
4.1. Imaging Technology Heterogeneity
Studies using SD-OCT Querques et al. [16] reported generalized CT thinning, potentially due to limited choroidal visualization in diabetic eyes with edema or fibrosis. In contrast, SS-OCT’s deeper penetration (1,050 nm vs . 840 nm wavelength) and enhanced signal-to-noise ratio Copete et al. [13] enable precise CT measurement even in pathologic choroids, as demonstrated by our findings and Wang et al. [24]. Manual choroidal boundary delineation Unsal et al. [20] introduces inter-observer variability (±15–20 µm), whereas our automated software reduced the risk of human error and bias associated with manual measurements.
4.2. Participant Stratification
Studies with mixed DR stages Adhi et al. [19]: NPDR + PDR observed attenuated CT differences, whereas our strict focus on NPDR revealed pronounced thickening. Similarly, cohorts with longer diabetes duration Kim et al. [25]: 8.2 years showed thinning, suggesting CT dynamics shift from compensatory thickening to atrophy as DR progresses.
In summary, the apparent contradictions in CT literature arise from technological and population-level differences. Our use of SS-OCT, automated segmentation, and strict NPDR enrollment criteria provides a refined perspective on early choroidal changes, underscoring the need for standardized protocols in future studies.
The choroid, responsible for 95% of ocular blood flow, is under autonomic nervous system control and exhibits autoregulation patterns. In the initial stages of DR, sympathetic innervation activation leads to increased choroidal circulation, resulting in choroidal thickening. Improved repeatability of choroidal measurements can enhance our understanding of DR detection, progression, and response to treatment, as the choroid may play a crucial role. The thickening of the choroid in the stages of NPDR may be linked to choroidopathy secondary to T2DM, indicating a possible development of choroidopathy in diabetic patients [27]. Diabetic choroidopathy may contribute to RPE dysfunction and influence vascular permeability. The thickening of the choroidal layer might be attributed to overexpression of cytokines activated by inflammation, oxidative stress, and angiogenesis during the initial stages of DR. Studies have reported significant associations between choroidal thickening and cytokines such as monocyte chemotactic protein-1, platelet-derived growth factor, and VEGF [28]. Some authors suggest that microvasculopathy in the retina, choroid, and kidneys may share pathogenic mechanisms related to metabolic changes, inflammation, and endothelial dysfunction characteristic of diabetes [29]. Therefore, during the early stages of DR, preserving perfusion may exert a protective influence on photoreceptors and the RPE [22].
Our study has two key strengths that distinguish it from others in the field. First, we carefully selected participants at the early stage of NPDR, minimizing potential confounding factors that could skew our results. This approach strengthens the validity of our findings and enhances their relevance to the broader understanding of NPDR. Second, we utilized SS-OCT, a non-invasive imaging technology that provides high-resolution cross-sectional images of the retina and choroid for CT measurements. SS-OCT’s deeper penetration and automated segmentation enabled the detection of subtle CT changes in NPDR. This sensitivity is critical for early diagnosis, as choroidopathy may precede visible retinal lesions, reducing the risk of human error and bias associated with manual measurements.
Nevertheless, this study also has some limitations. First, we did not employ a longitudinal approach, which would be important for observing changes in choroidal blood flow in DR patients as the disease progresses from NPDR to PDR. Second, although the age distribution between the two groups was not perfectly matched, we regard age as a potential confounder and validate our conclusion through adjusted analyses. The result suggested that this age difference did not significantly impact our result. Future studies still should be designed to include two groups of age-matched patients to reduce the risk of such bias.
CONCLUSION
The study demonstrates excellent CT measurements using SS-OCT in healthy individuals and patients with NPDR. Notably, CT was greater in patients with NPDR than in healthy controls. Taken together, the results suggest that in patients with NPDR, the choroid has undergone corresponding changes, even without noticeable retinal lesions. These findings underscore the critical role played by the choroid in the pathogenesis of DR. Therefore, while paying adequate attention to the retinal changes, the importance of the choroid should also be recognized.
AUTHORS’ CONTRIBUTION
The authors confirm their contribution to the paper as follows: study conception and design: JK; data collection: JP, YZ, DW, TX, XB; visualization: ML. All authors reviewed the results and approved the final version of the manuscript.
LIST OF ABBREVIATIONS
| CT | = Choroidal thickness |
| DR | = Diabetic retinopathy |
| NPDR | = Non-proliferative diabetic retinopathy |
| RPE | = Retinal pigment epithelium |
| VA | = Visual acuity |
| VEGF | = Vascular endothelial growth factor |
| SS-OCT | = Swept-source optical coherence tomography |
| CIs | = Confidence intervals |
| IOP | = Intraocular pressure |
| BCVA | = Best corrected visual acuity |
| DM | = Diabetes mellitus |
ETHICS APPROVAL AND CONSENT TO PARTICIPATE
This study was approved by the Ethics Committee of Hospital 363 (Approval No. 202200012).
HUMAN AND ANIMAL RIGHTS
All human research procedures followed were in accordance with the ethical standards of the committee responsible for human experimentation (institutional and national), and with the Helsinki Declaration of 1975, as revised in 2013.
CONSENT FOR PUBLICATION
Written consent for participation was obtained from the patients or their immediate family members.
AVAILABILITY OF DATA AND MATERIALS
The data sets used and/or analysed during this study are available from the corresponding author [M.L] upon request.
ACKNOWLEDGEMENTS
Declared none.

