All published articles of this journal are available on ScienceDirect.

Exploration of Lactylation-related Genes and Potential Mechanism in Diabetic Retinopathy
Abstract
Introduction
Previous studies have suggested that Diabetic Retinopathy (DR) may be linked to disturbed lactate homeostasis, but the exact mechanism remains unclear. In this study, we explored biomarkers related to DR and provided insights into their mechanisms based on Lactylation-Related Genes (LRGs).
Methods
The GSE185011, GSE60436, and LRGs were employed in this study. Firstly, the differentially expressed genes 1 (DEGs 1) and DEGs 2 were obtained by differential analysis in two datasets, respectively. Then, the common DEGs (CO-DEGs) were selected by integrating the intersection of up-regulated genes from DEGs 1 and DEGs 2, and the down-regulated genes from DEGs 1 and DEGs 2. Next, the candidate biomarkers were identified by overlapping the CO-DEGs and LRGs. Importantly, the biomarkers were further identified using expression analysis. Eventually, based on the biomarkers, GeneMANIA, function enrichment, subcellular localization, and related network analyses of the biomarkers were performed, respectively.
Results
In this study, 7 candidate biomarkers were identified by overlapping the 262 CO-DEGs and 331 LRGs, all of which exhibited significantly consistent expression trends in GSE185011 and GSE60436. Therefore, they (RECQL, NOC3L, SSB, DDX18, ARID3B, LSP1, TKT) were defined as biomarkers. In GeneMANIA analysis, 20 genes with similar functions were predicted, such as DDX18-GNL2 and SSB-CDC27, which were mainly involved in ribosomal biosynthesis, rRNA metabolic process, etc. Later, function enrichment analysis revealed that biomarkers, except for RECQL, were enriched in ribosome, complement, and coagulation cascade pathways in GSE185011. Additionally, all biomarkers were rich in oxidative phosphorylation, Butanoate metabolism, and other pathways in GSE60436. For subcellular location analysis, ARID3B, DDX18, NOC3L, RECQL, and SSB may be located in the cytoplasm, while LSP1 and TKT might be located in the nucleus. Furthermore, TKT-pentose phosphate pathway genes (PGM2, TALDO1), and SSB-systemic lupus erythematosus genes (SNRPD1, SNRPD3, SNRPB) networks were separately constructed. Meanwhile, a disease-biomarkers-drugs was also built, such as Lipid Metabolism Disorders-NOC3L-Acetaminophen.
Conclusion
In this study, RECQL, NOC3L, SSB, DDX18, ARID3B, LSP1, and TKT were identified as biomarkers related to lactylation for DR, which provided a theoretical basis for the study of DR.
1. INTRODUCTION
Diabetic Retinopathy (DR) is one of the most common microvascular complications of diabetes, characterized by chronic and progressive leakage and obstruction of retinal microvessels. This condition leads to various retinal abnormalities, including microaneurysms, hard exudates, cotton-wool spots, neovascularization, vitreous proliferation, macular edema, and even retinal detachment. DR poses a significant risk of blindness and greatly affects the daily lives of individuals suffering from the condition [1].
Current treatment options for DR include pharmacotherapy (anti-vascular endothelial growth factor, Anti-VEGF) [2], laser therapy, and surgical interventions. However, each of these approaches has its limitations and drawbacks. As a result, the management of DR remains a complex and challenging task, necessitating continued research and technological advancements to develop more effective treatment modalities. Early diagnosis of DR is essential for timely intervention and prevention of disease progression. However, existing limitations persist, as many diabetic patients remain unaware of their condition in the early stages, leading to disease deterioration and, in severe cases, blindness. Therefore, enhancing patient awareness, developing more accessible and cost-effective screening methods, and identifying new, valuable biomarkers for early diagnosis are critical [3, 4]. These efforts would facilitate early identification and intervention, promoting better clinical outcomes.
The pathogenesis of DR is intricate and multifactorial, involving mechanisms such as hypoxia, oxidative stress, inflammation, and abnormalities in the polyol metabolic pathway, among others. Recent advances in omics [5] and gene technologies [6] have significantly contributed to understanding the disease by identifying biomarkers or preclinical signs, as well as by elucidating the complex pathological processes that determine disease prognosis.
Lactylation, a recently discovered post-translational protein modification, involves the covalent addition of lactyl groups to lysine residues of proteins. This modification serves as a mechanism for gene regulation [7]. Lactylation occurs through two distinct pathways, L-lactylation and D-lactylation, both of which are widespread in living organisms. Research suggests that lactylation plays an essential role in normal physiological processes and is directly or indirectly linked to various human diseases [8]. Factors such as the generation and transport of substrate lactate, acyltransferases providing lactyl groups, neural excitation, gene expression, and stimulation by certain components of traditional Chinese medicine can influence lactylation levels [9]. While the regulatory mechanisms of lactylation are still in the early stages of investigation, recent findings have begun to shed light on its regulatory role and biological significance. Lactylation has the potential to serve as a breakthrough in the genetic-level treatment of related diseases [10]. A previous study [11] suggested that neurodegenerative diseases of the retina, particularly glaucoma and DR, may be associated with disturbances in lactate homeostasis. However, the precise involvement of lactylation in the onset and progression of DR from a biological perspective remains poorly understood.
Therefore, in this study, we utilized data from publicly available databases related to DR and employed comprehensive bioinformatics methods to explore biomarkers associated with lactylation modification in DR. This research provides a theoretical foundation for understanding the pathogenesis and treatment of DR. By uncovering relevant biomarkers, it holds significant promise in further elucidating the mechanisms underlying the development of DR.
2. MATERIALS AND METHODS
2.1. Data Source
In this study, DR-related data sets were derived from the Gene Expression Omnibus (GEO) database (https://www.ncbi.nlm.nih.gov/gds). Among them, GSE185011 included 5 DR and 5 control Peripheral Blood Mononuclear Cells (PBMC) samples, based on the GPL24676 platform. The GSE60436 included 6 DR and 3 control retina tissue samples, based on the GPL6884 platform. The samples are from Asian patients. Besides, 331 Lactylation-Related Genes (LRGs) were extracted from the literature [12].
2.2. Differential Expression and Function Enrichment Analyses
Firstly, the Differentially Expressed Genes 1 (DEGs 1) (DR vs. control) in GSE185011 and the DEGs 2 (DR vs. control) in GSE60436 were separately identified using the “DESeq2” (version 1.38.0) [13] and “limma” (version 3.54.0) [14] (p < 0.05,∣log2 Fold Change (FC)| > 0.5). Then, DEGs 1 and DEGs 2 were separately visualized using the volcano plot and heat map through “ggplot2” (version 3.4.1) [15] and “ComplexHeatmap” (version 2.14.0) [16], respectively. Afterward, the common DEGs (CO-DEGs) were selected by integrating the intersection of up-regulated genes from DEGs 1 and DEGs 2, and the down-regulated genes from DEGs 1 and DEGs 2. Next, the candidate biomarkers were identified by overlapping the CO-DEGs and LRGs.
Furthermore, to explore the biological functions of the candidate biomarkers, Gene Ontology (GO) and Kyoto Encyclopedia of Genes and Genomes (KEGG) enrichment analyses (adjusted p < 0.05) were carried out via “clusterProfile” (version 4.7.1.003) [17].
2.3. Gene Expression Analysis
To verify the candidate biomarker, gene expression analysis was performed in both GSE185011 and GSE60436, respectively. Importantly, genes with significantly consistent expression trends in both datasets were considered as biomarkers (p < 0.05).
2.4. Function Analysis of Biomarkers
To detect related genes of biomarkers, the GeneMANIA network was constructed using the GeneMANIA database.
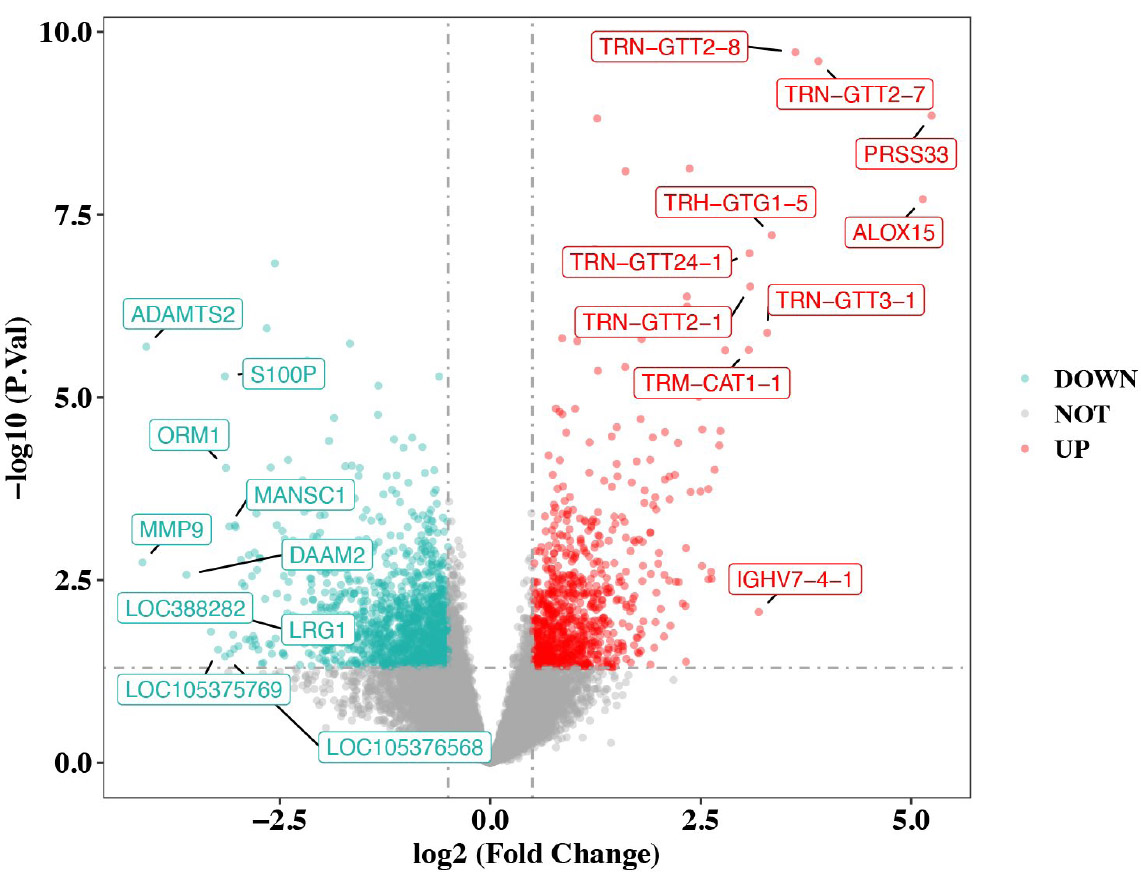
Volcano plot of differentially expressed genes between DR vs. control. Each point on the plot represents a gene, with differential thresholds set at |log2FC| > 0.5 and p-value < 0.05.
Additionally, the Human Protein Atlas (HPA) (https://www. proteinatlas.org/) was utilized to observe the expression levels of the biomarkers in the different tissues. Furthermore, to explore biomarkers related to regulatory pathways and biological functions, firstly, the correlation coefficients of the biomarkers with all the genes in GSE185011 and GSE60436 were separately calculated and ranked. Subsequently, Gene Set Enrichment Analysis (GSEA) was conducted according to a screening condition of |NES|>1, nominal (NOM) p-value < 0.05, False Discovery Rate (FDR) q-value < 0.25. Moreover, the c2.cp.kegg.v7.4.symbols.gmt was used as the background gene set from the Molecular Signatures Database (MSigDB) (http://www.broadinstitute.org/gsea/msigdb/ index.jsp).
2.5. Subcellular Localization and Metabolic Correlation Analyses
To further visualize the subcellular organelle in which the biomarker was located, mRNALocater was used to perform subcellular localization analysis. Furthermore, to understand the link between DR onset and the metabolism pathway, firstly, ssGSEA was used to assess the metabolism pathway of DR samples in GSE185011 and GSE60436, respectively. Hallmark gene sets were selected as the background gene set from MSigDB. Then, Spearman analysis was used to analyze the correlation between biomarkers and metabolic pathways in two datasets.
2.6. Pathway Network and Regulation Network Analyses
To elucidate the potential mechanisms of biomarkers in disease development, the Biological General Repository for Interaction Datasets (BIOGRID) was used to extract pairs of interaction relationships between biomarkers and other genes. The KEGG database was then used to obtain the biomarker-pathway relationship pairs and the biomarker-genes relationship pairs. Integrating the above relationships, a biomarker-pathway-genes network was constructed, and Cytoscape [18] was used to visualize this result.
To explore the molecular regulatory mechanism of the biomarkers, the miRTarBase (https://mirtarbase.cuhk. edu.cn/) and JASPAR (http://jaspar.genereg.net/) databases were used separately to predict miRNAs and Transcription Factors (TFs). Thus, a TF-miRNA-biomarker network was constructed and visualized using Cytoscape.
2.7. Disease-biomarkers-drugs Network Analysis
To explore biomarker-related diseases and targeted drugs, the Comparative Toxicogenomics Database (CTD) was used to predict the relationship among biomarkers, diseases, and drugs. Then, a disease-biomarkers-drugs network was constructed, and the results were displayed using Cytoscape.
3. RESULTS
3.1. A Total of 7 Biomarkers were Identified
After differential analysis, 2,114 DEGs 1, of which 852 up-regulated genes and 1,262 down-regulated genes, in GSE185011 (Fig. 1A-B), and 6,437 DEGs 2 (3,618 up-regulated and 2,819 down-regulated) in GSE60436 were identified, respectively (Fig. 1C-D). Later, the 262 CO-DEGs were identified by integrating the intersection of up-regulated genes from DEGs 1 and DEGs 2 (131 genes) with the intersection of down-regulated genes from DEGs 1 and DEGs 2 (131 genes) (Fig. 1E). Next, the 262 CO-DEGs were intersected with 331 LRGs to extract 7 candidate biomarkers (RECQL, NOC3L, SSB, DDX18, ARID3B, LSP1, TKT) (Fig. 1F).
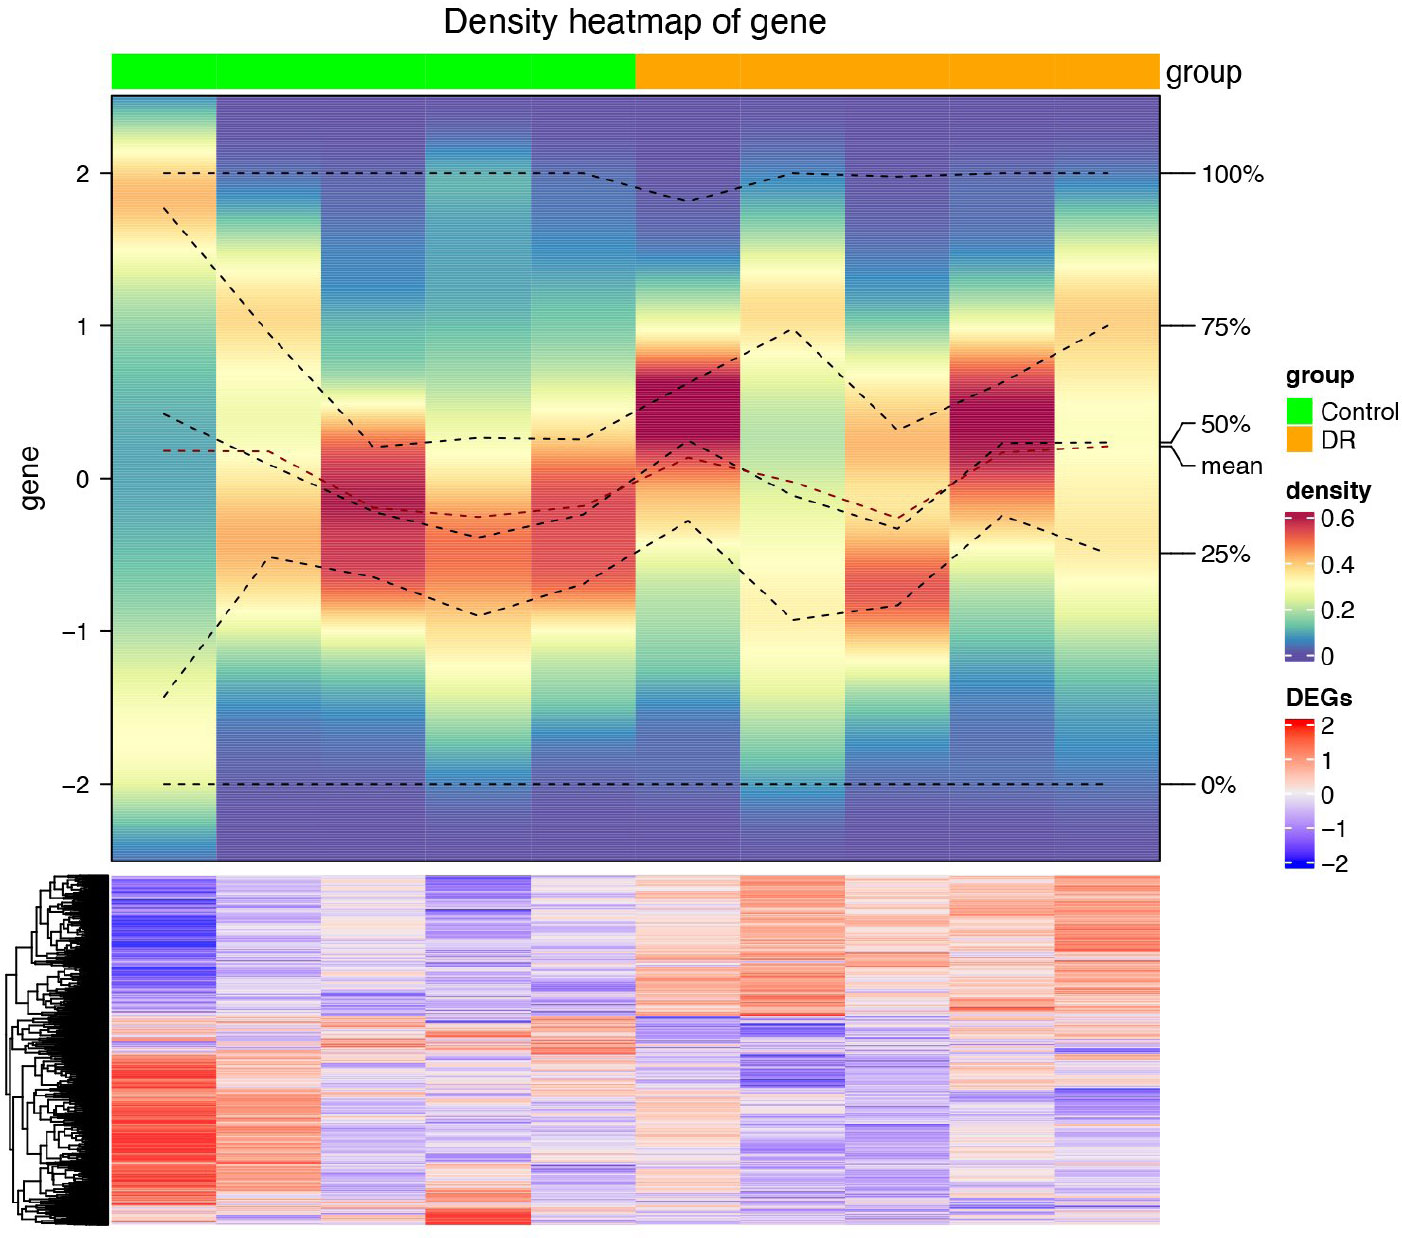
Heatmap of differentially expressed genes between DR vs. control. Green represents control group samples, while yellow represents DR group samples. The color density in the middle heatmap represents the expression density of samples, with a deeper red color indicating higher density. The gray bar annotation indicates the number of samples. The horizontal axis represents samples, and the vertical axis represents genes. Red indicates high-expression genes, while blue indicates low-expression genes.
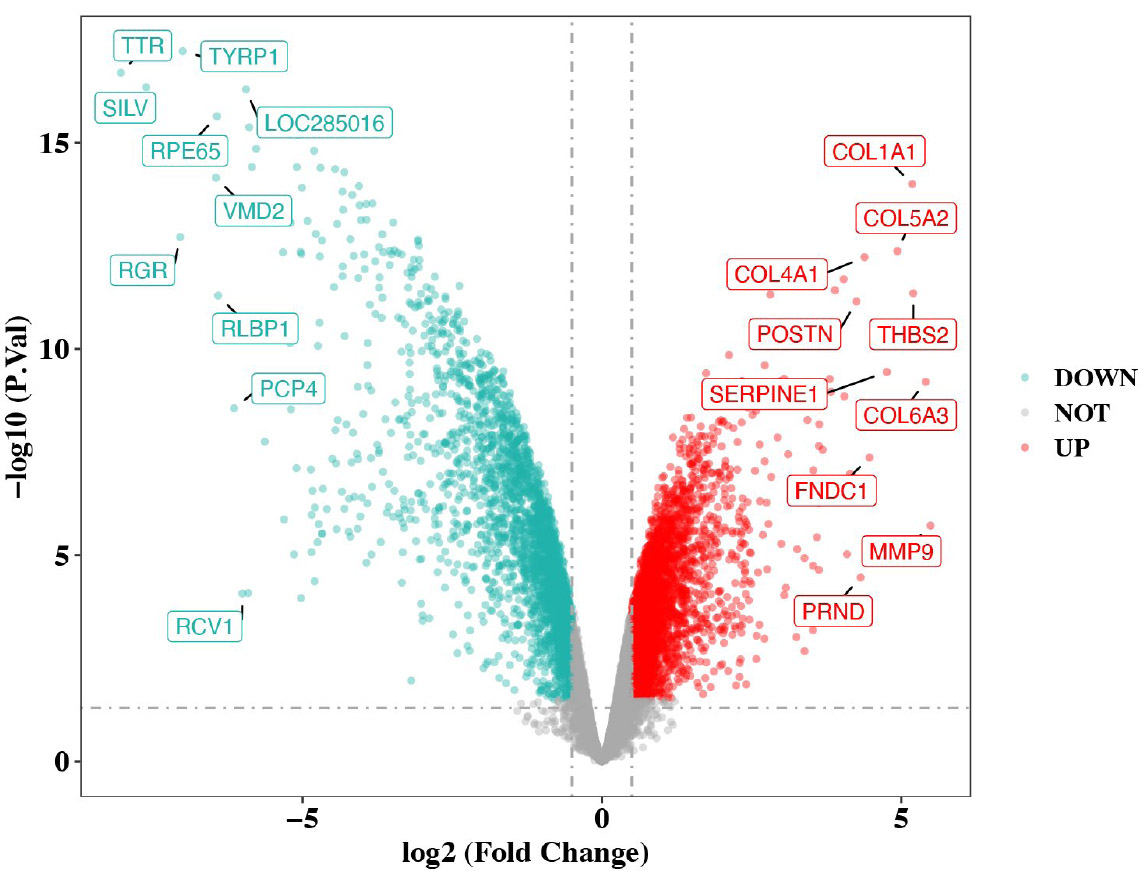
Volcano plot of differentially expressed genes between DR vs. control in GSE60436.
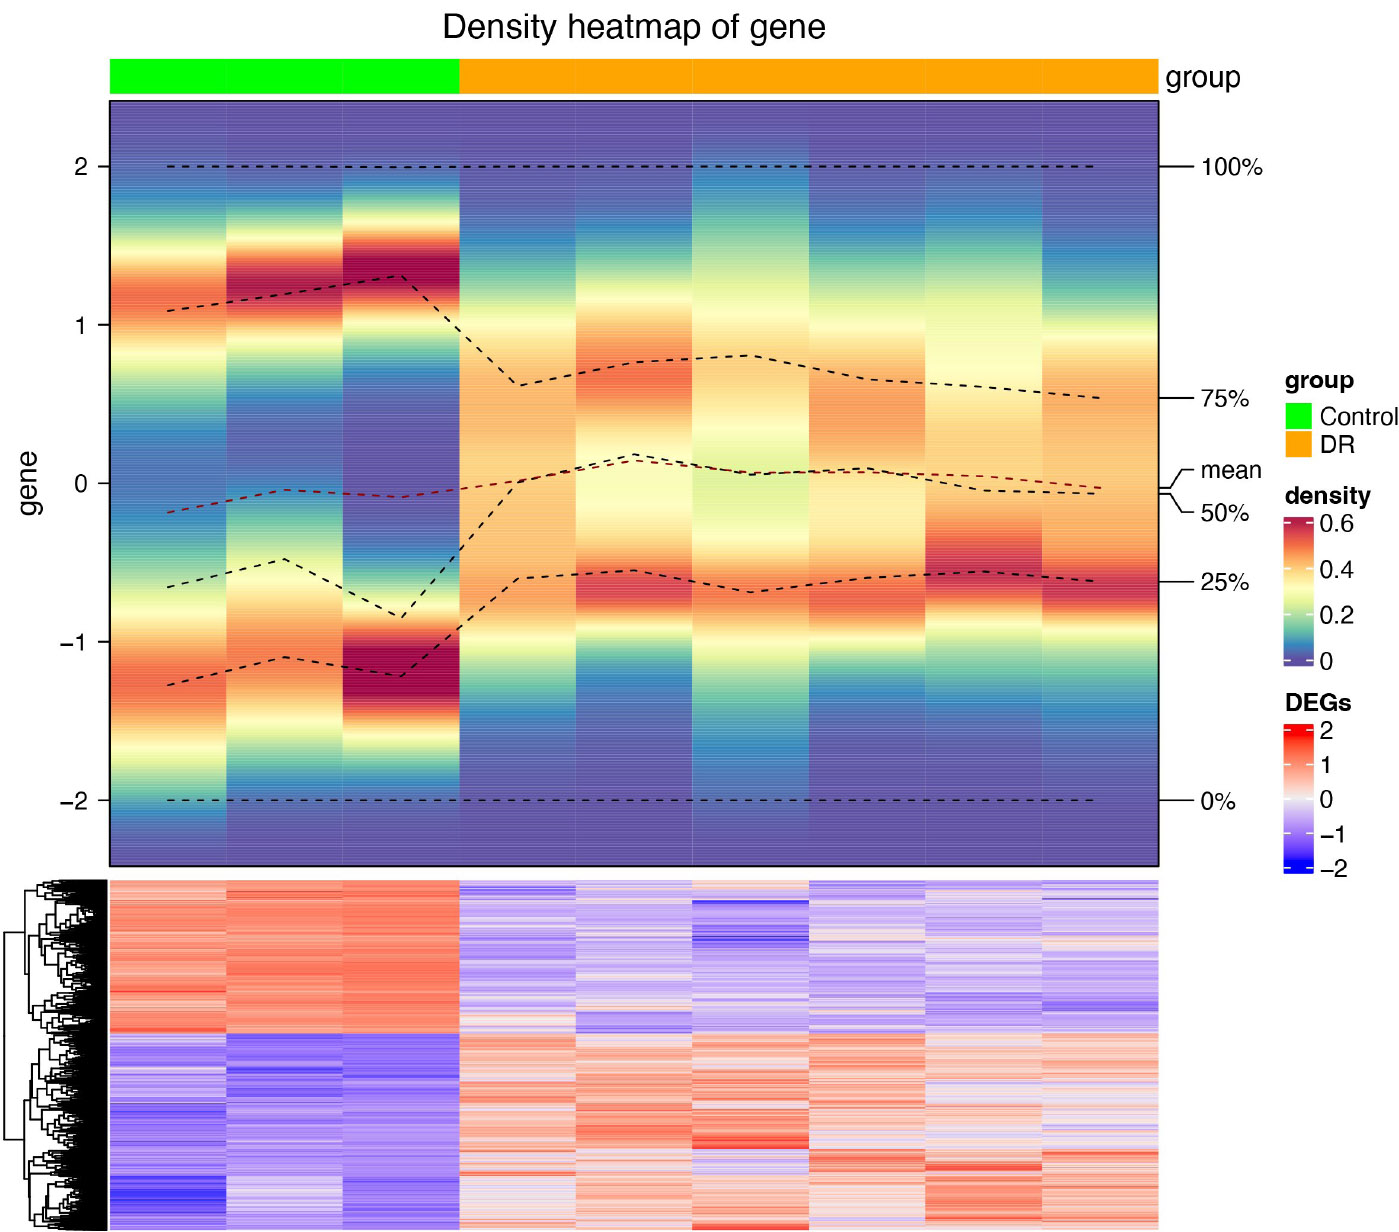
Heatmap of differentially expressed genes between DR vs. control in GSE60436.
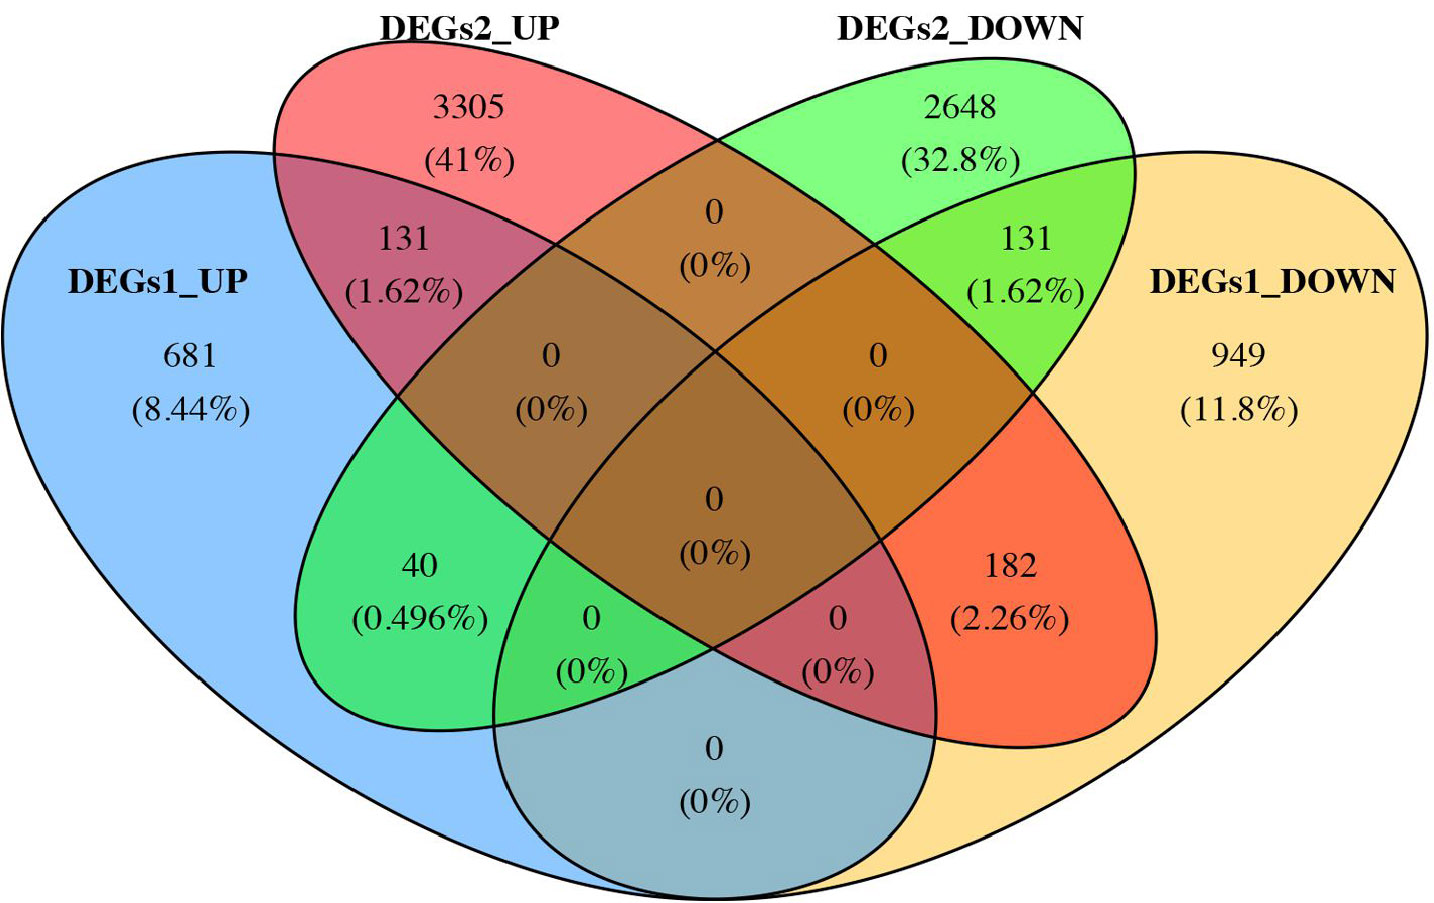
Identification of common intersecting genes.
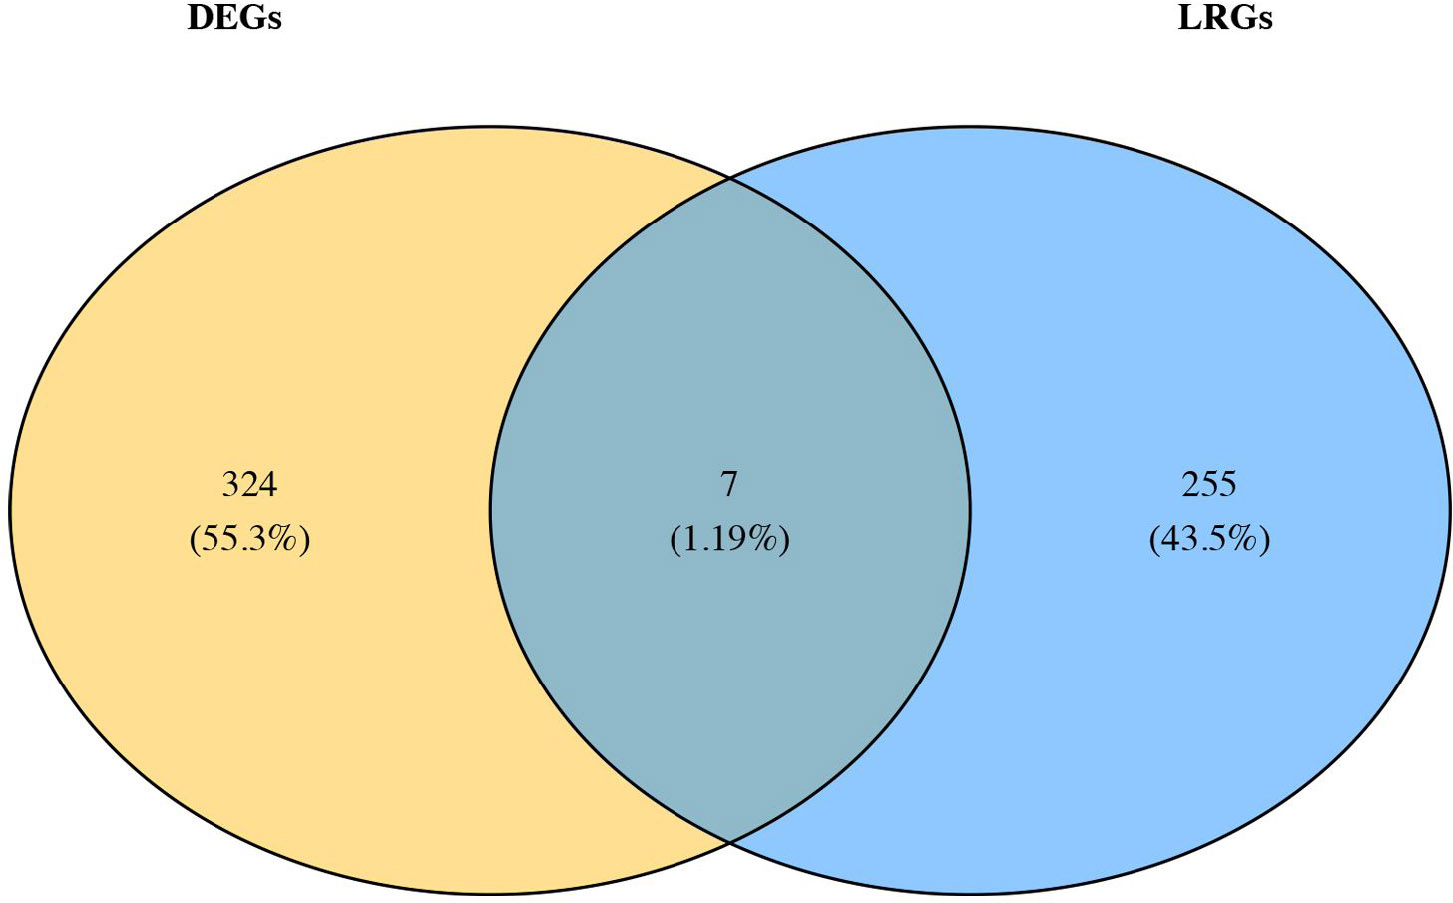
Identification of candidate genes.
Furthermore, the GO and KEGG enrichment analyses identified the biological functions and the related pathways of the candidate biomarkers. Specifically, GO terms included DNA replication, glyceraldehyde-3-phosphate metabolic process, and so on (Fig. 2A). Similarly, in KEGG enrichment analysis, candidate genes were enriched in the biosynthesis of amino acids, and the C-type lectin receptor signaling pathway, etc (Fig. 2B).
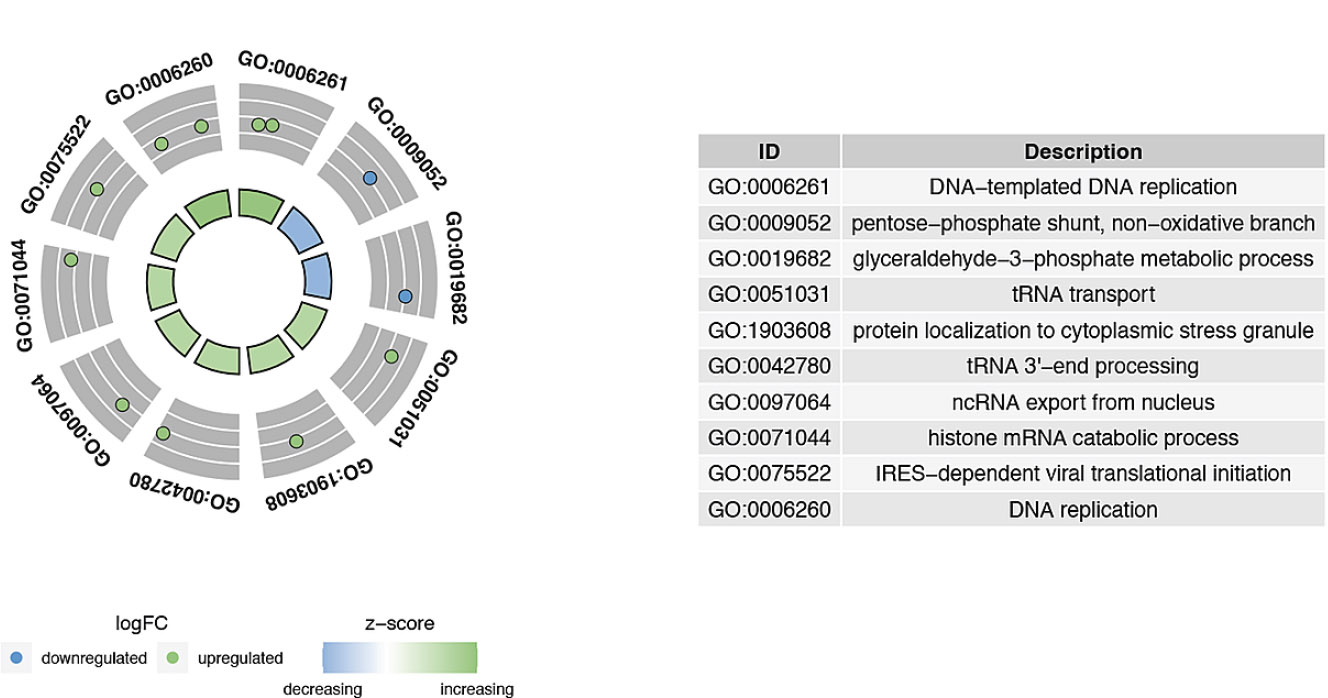
Chord diagram of candidate gene GO enrichment. The outermost circle represents the ID numbers of enriched pathways. The table on the right corresponds the ID numbers to pathway names. The gray layer one level inward shows the distribution of gene logFC, with different colors indicating up-regulation and down-regulation. The innermost circle represents the Z-score values of pathway enrichment.
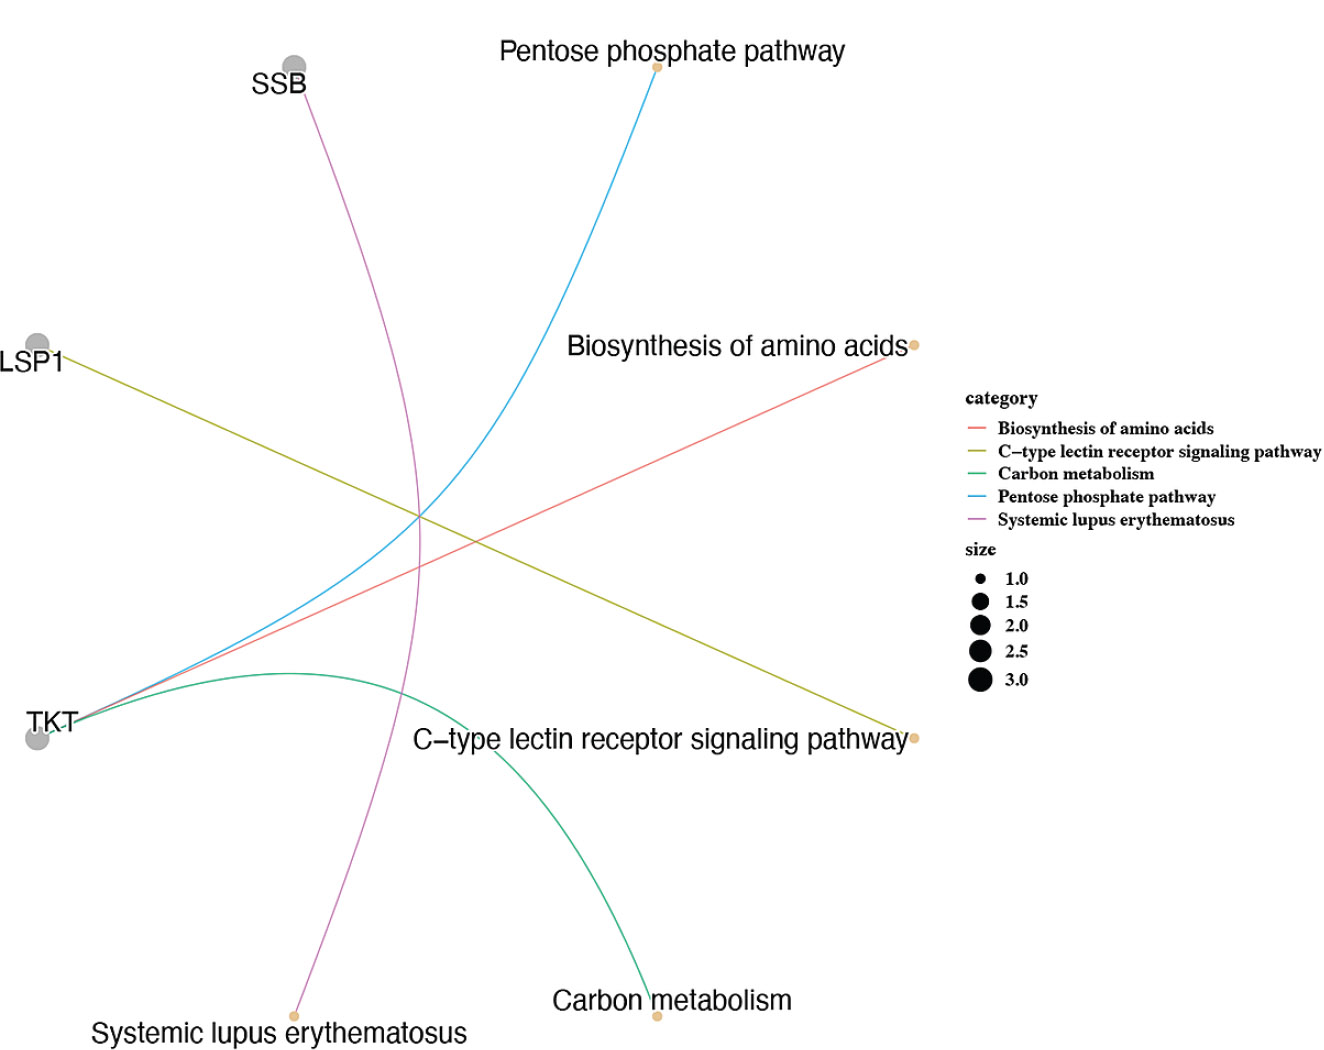
Chord diagram of differentially expressed genes in KEGG enrichment. The left half of the chord diagram displays the distribution of differentially expressed genes, while the right side shows the corresponding KEGG pathways associated with these differentially expressed genes.
Importantly, we compared the differences in the expression of candidate genes in the DR and control samples in GSE185011 and GSE60436. RECQL, NOC3L, SSB, and DDX18 showed significantly high expression in DR samples, while ARID3B, LSP1, and TKT showed significantly high expression in control samples, and this expression trend was consistent in both GSE185011 and GSE60436 (Fig. 2C-D). Thus, the 7 genes (RECQL, NOC3L, SSB, DDX18, ARID3B, LSP1, TKT) were further identified as biomarkers.
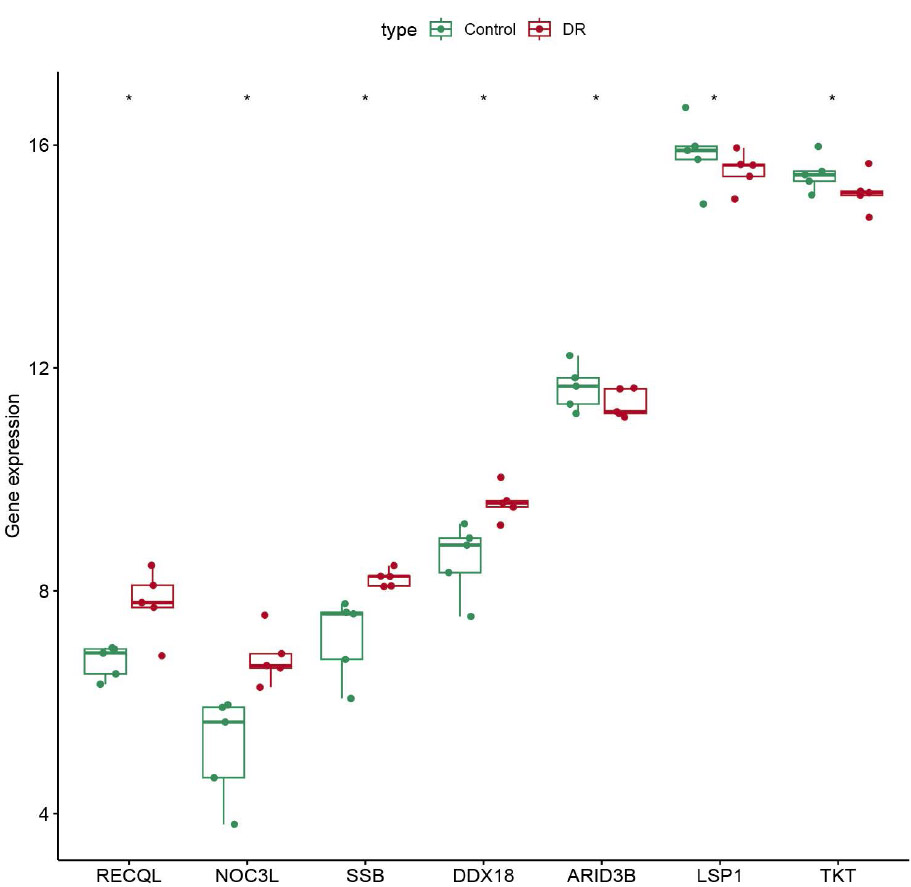
The expression profile of biomarkers in dataset GSE185011.
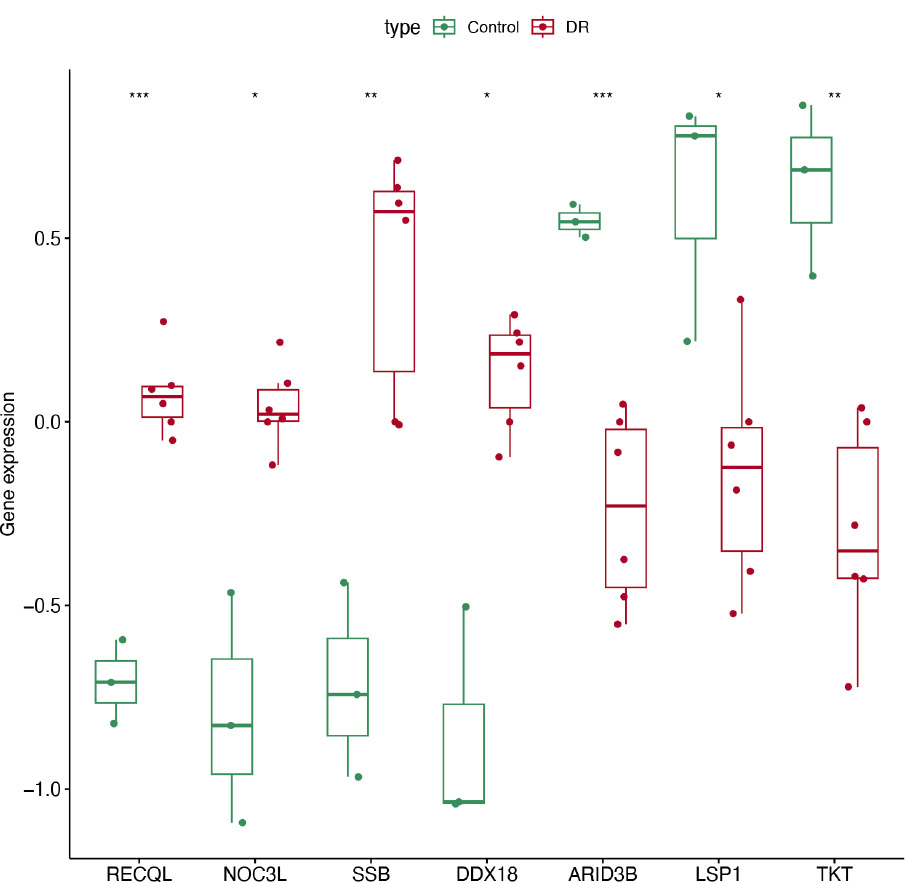
The expression profile of biomarkers in dataset GSE60436.
3.2. Exploring Function and Expression for Biomarkers
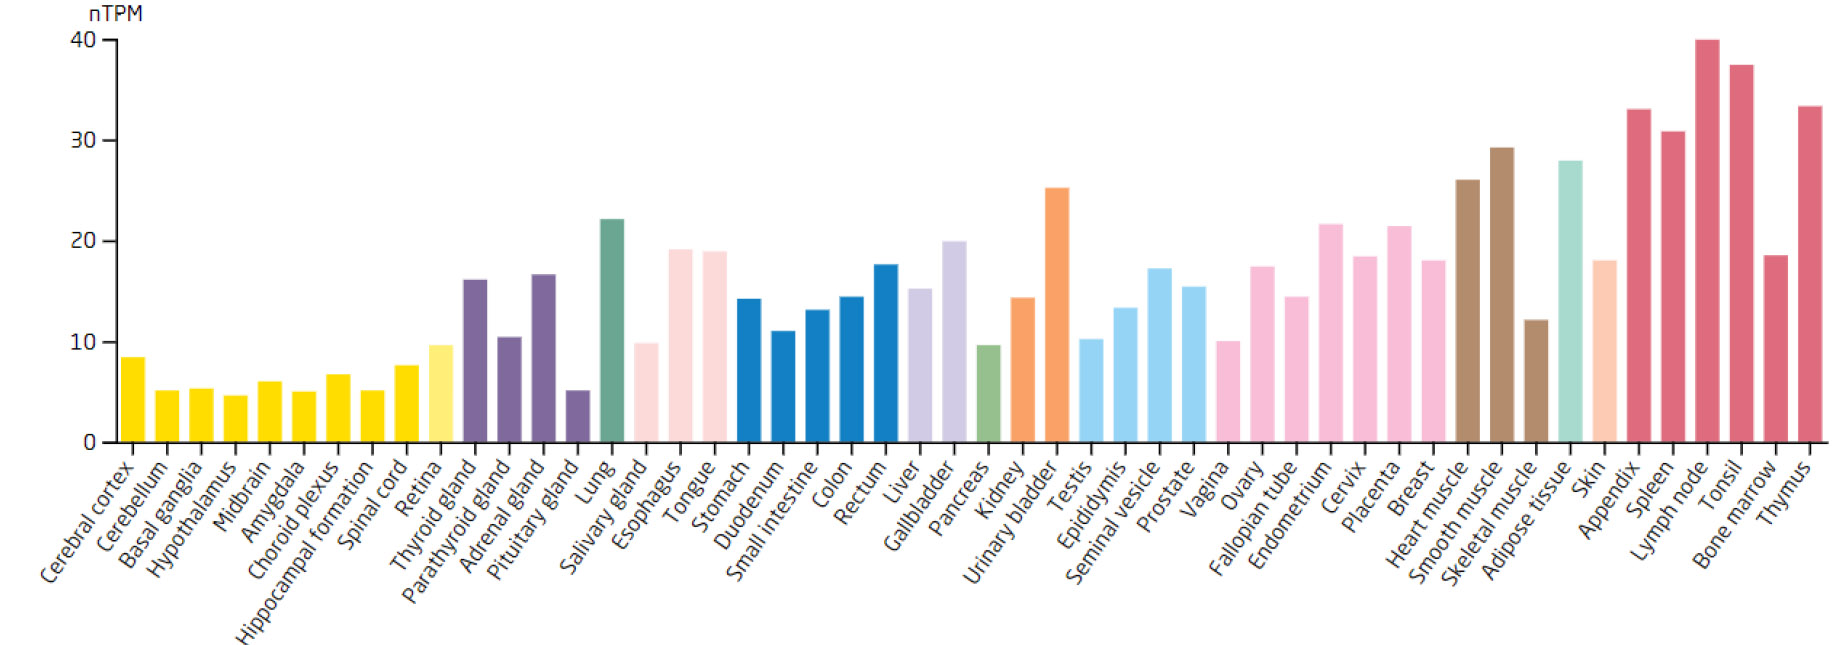
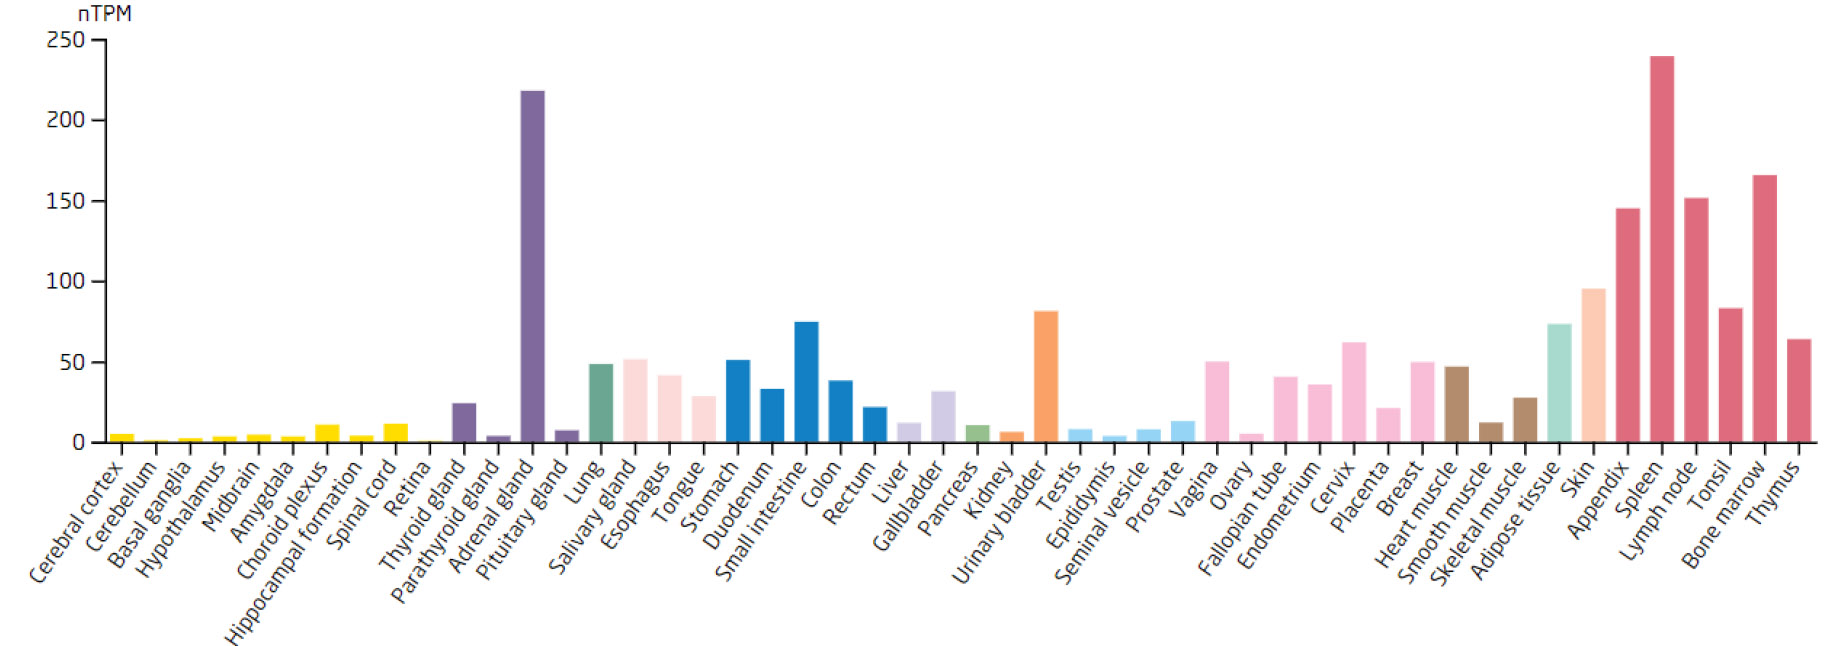
Based on the 7 biomarkers, 20 genes with similar functions were predicted, and a GeneMANIA network was constructed, comprising 265 relationships, such as DDX18-GNL2, SSB-CDC27, and LSP1-GTPBP4, which were mainly involved in ribosomal biosynthesis, rRNA metabolic process, etc (Fig. 3A). Furthermore, the expression of biomarkers in different tissues was observed. For example, ARID3B and TKT were highly expressed in bone marrow tissue, implying that ARID3B and TKT play an important biological function in the bone marrow. In addition, DDX18, NOC3L, and RECQL had high expression in lymph node and tonsil tissues, LSP1 was highly expressed in the adrenal gland, while SSB exhibited high expression in many tissues, especially in adipose tissue (Fig. 3B-H).
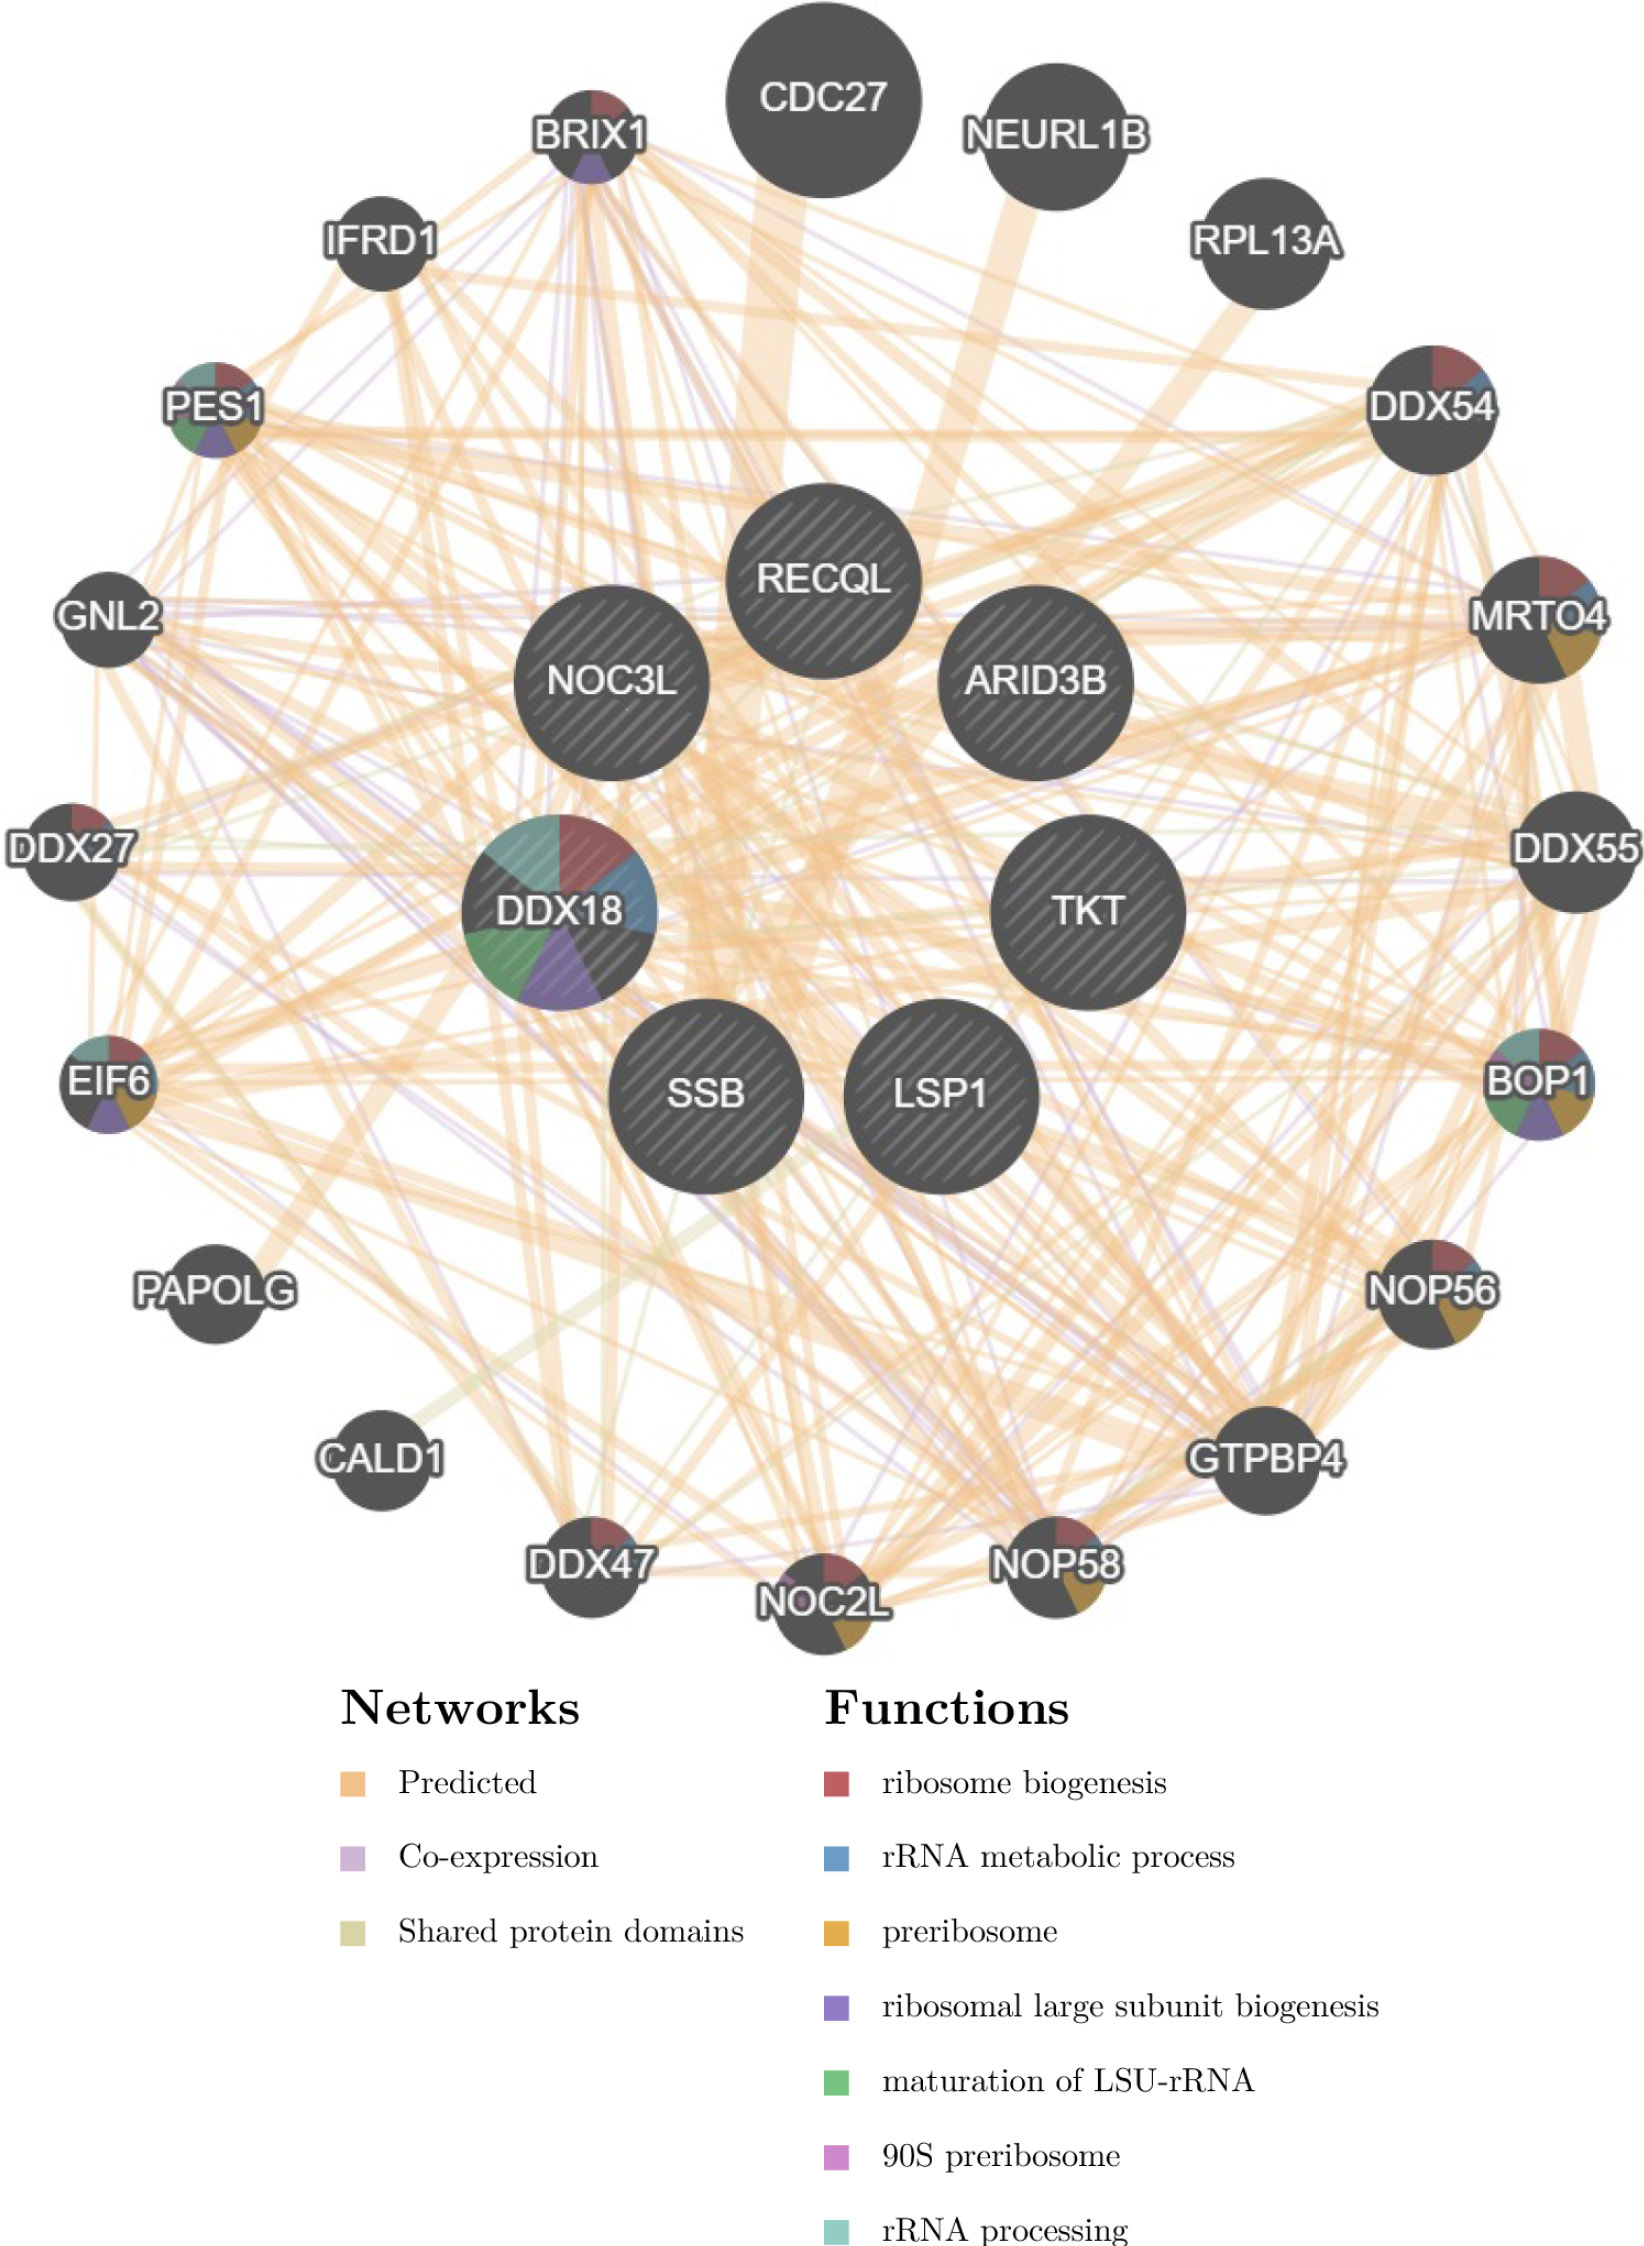
GeneMANIA network of the 7 lactylation-related genes.
Expression levels of the RECQL in different tissues.
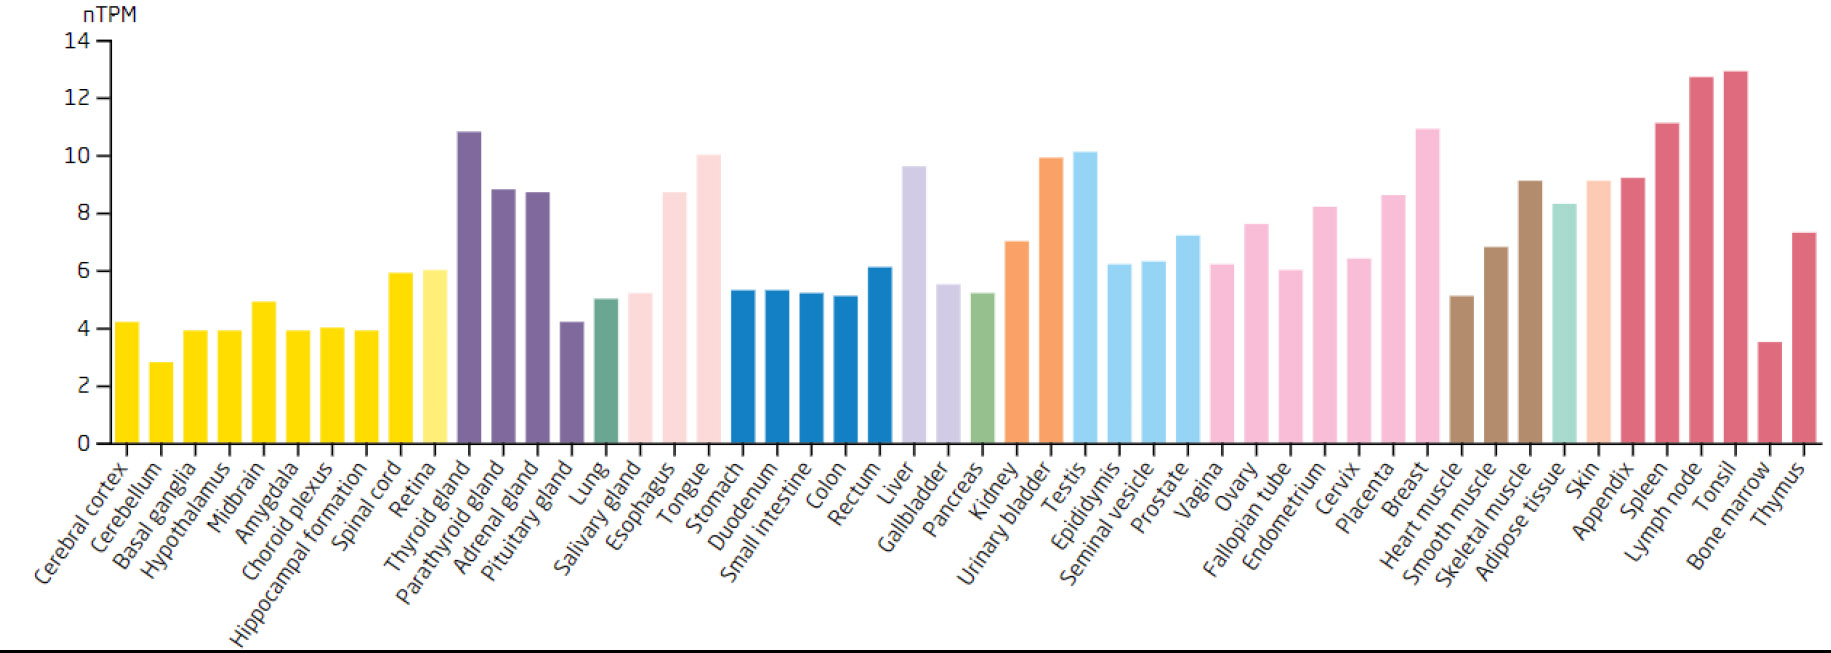
Expression levels of the NOC3L in different tissues.
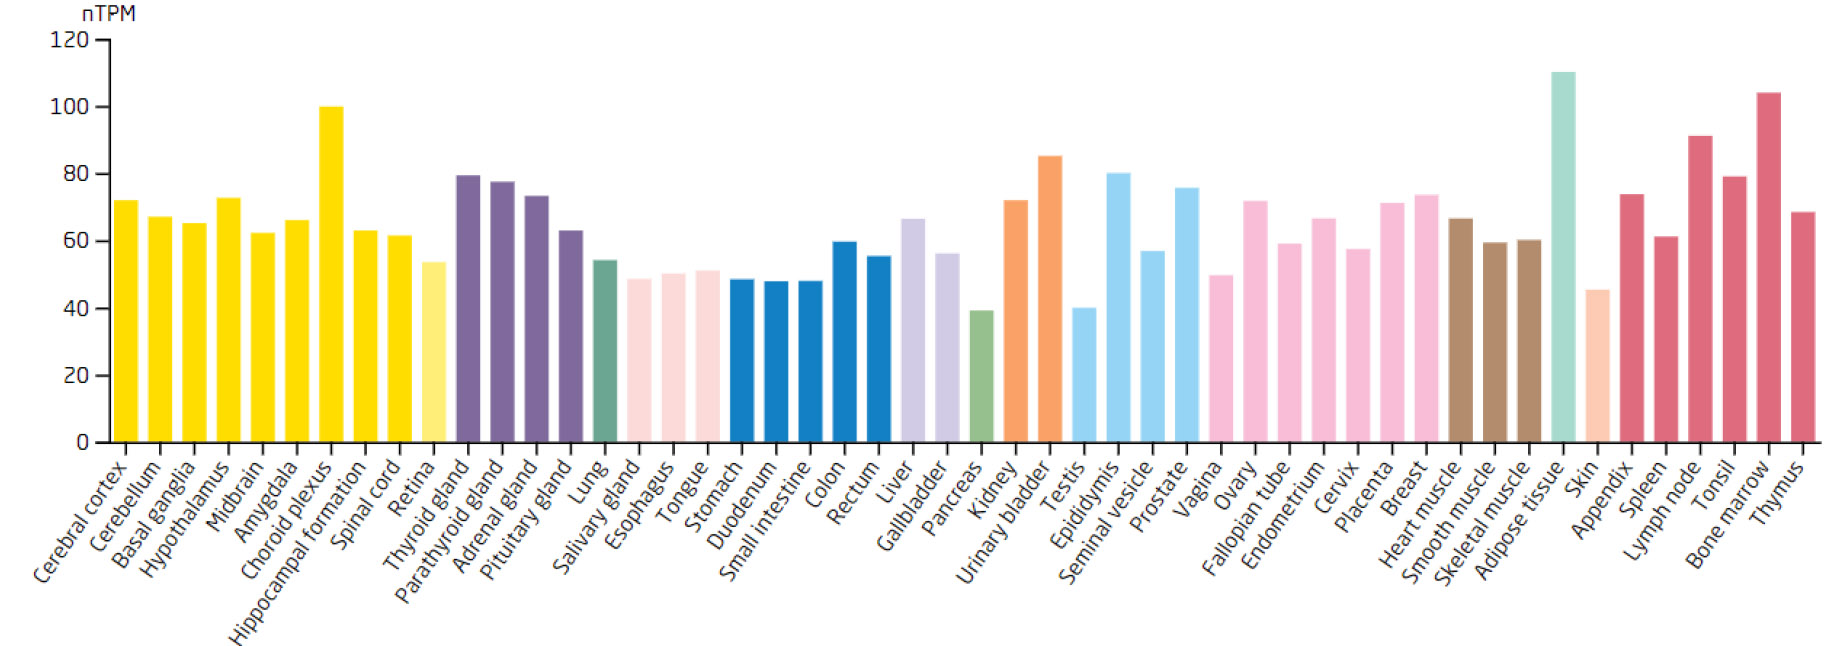
Expression levels of the SSB in different tissues.
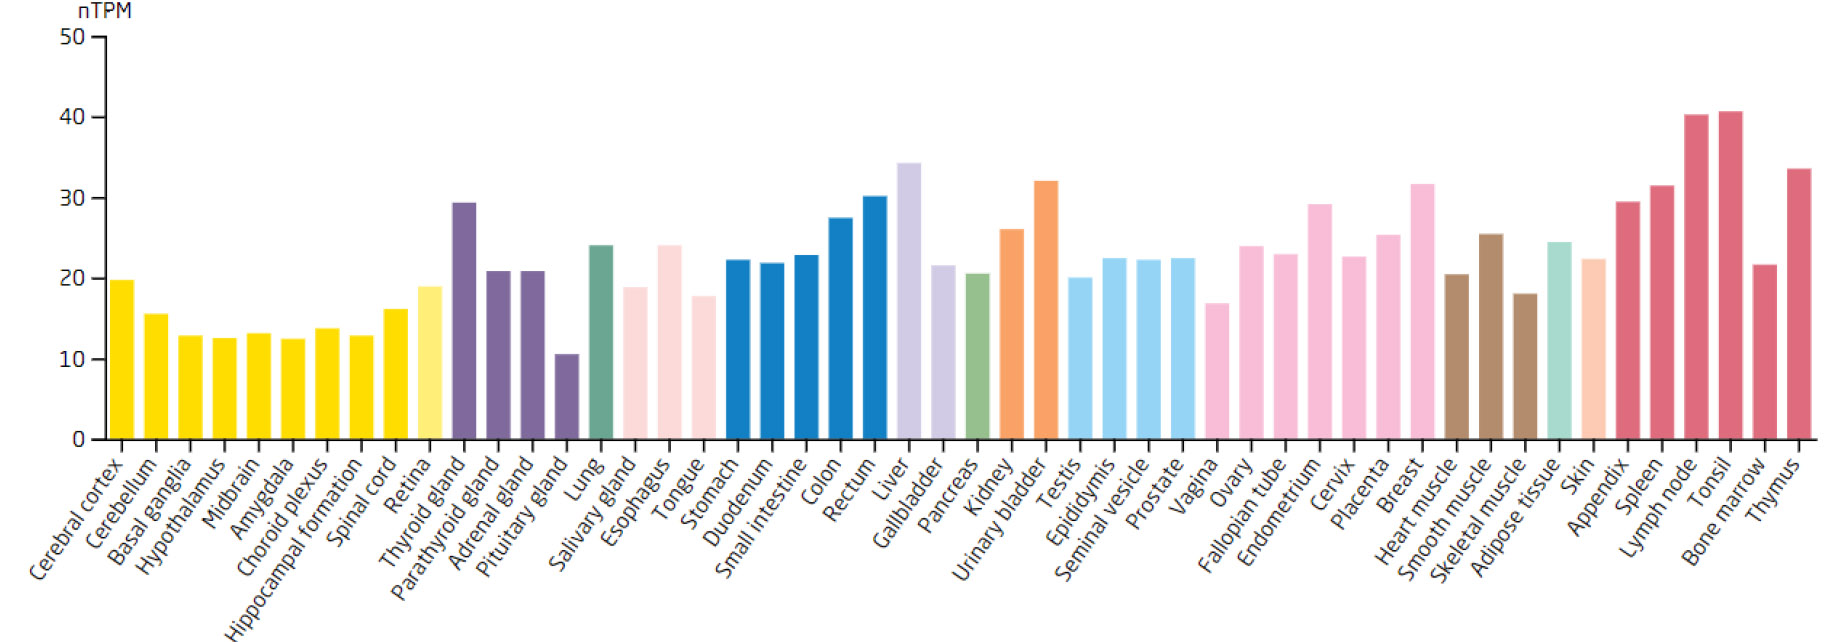
Expression levels of the DDX18 in different tissues.
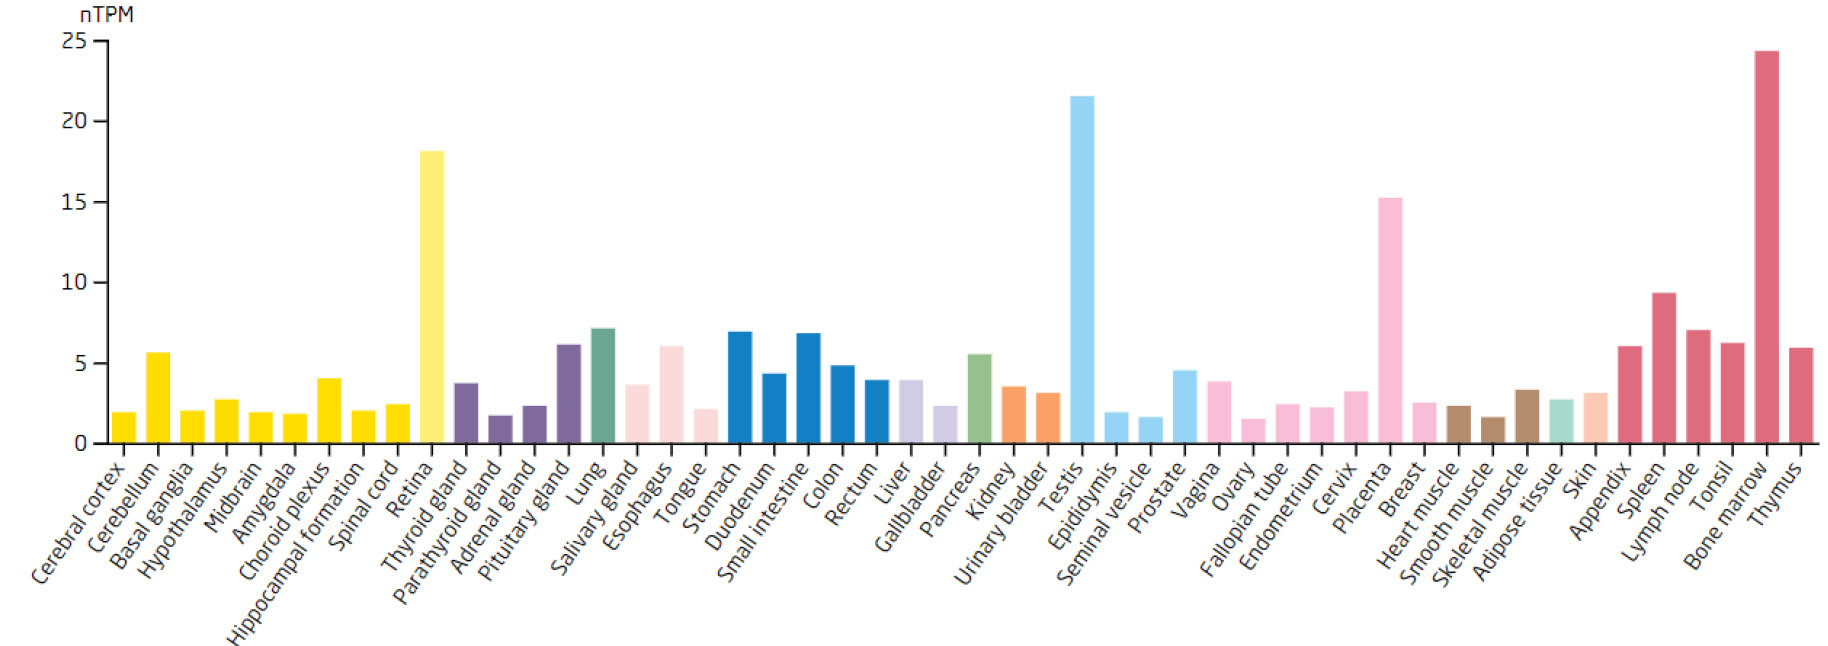
Expression levels of the ARID3B in different tissues.
Expression levels of the LSP1 in different tissues.
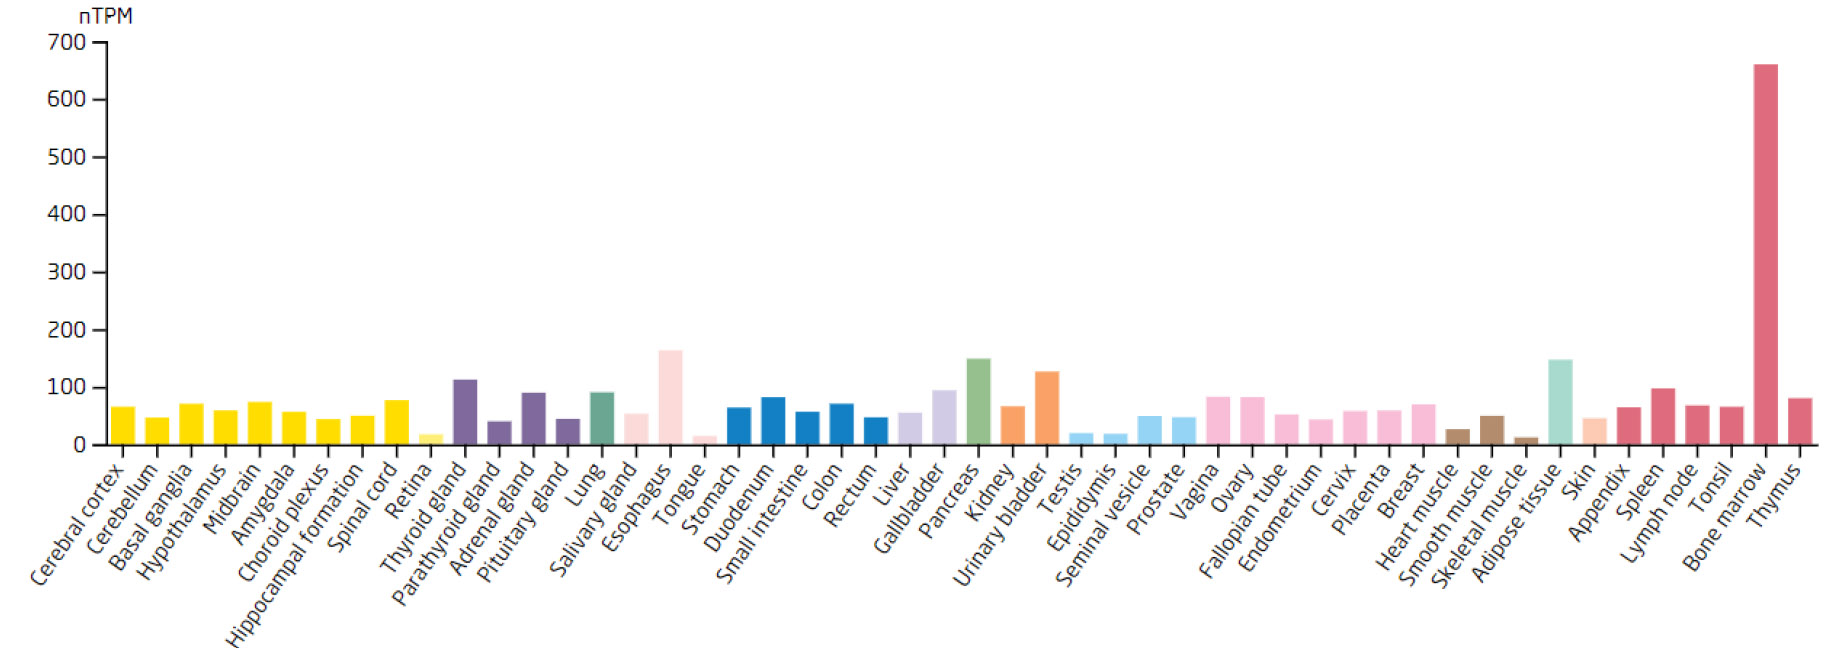
Expression levels of the TKT in different tissues.
3.3. GSEA Analysis Showed that Biomarkers were Enriched in Many Different Pathways
The biological functions of biomarkers were further explored by GSEA enrichment analysis in GSE185011 and GSE60436 datasets, respectively. Firstly, in GSE185011, biomarkers, except for RECQL, were enriched in ribosome, complement, and coagulation cascade pathways (Fig. 4A). Additionally, in GSE60436, all biomarkers were enriched in oxidative phosphorylation, Butanoate metabolism, etc (Fig. 4B).
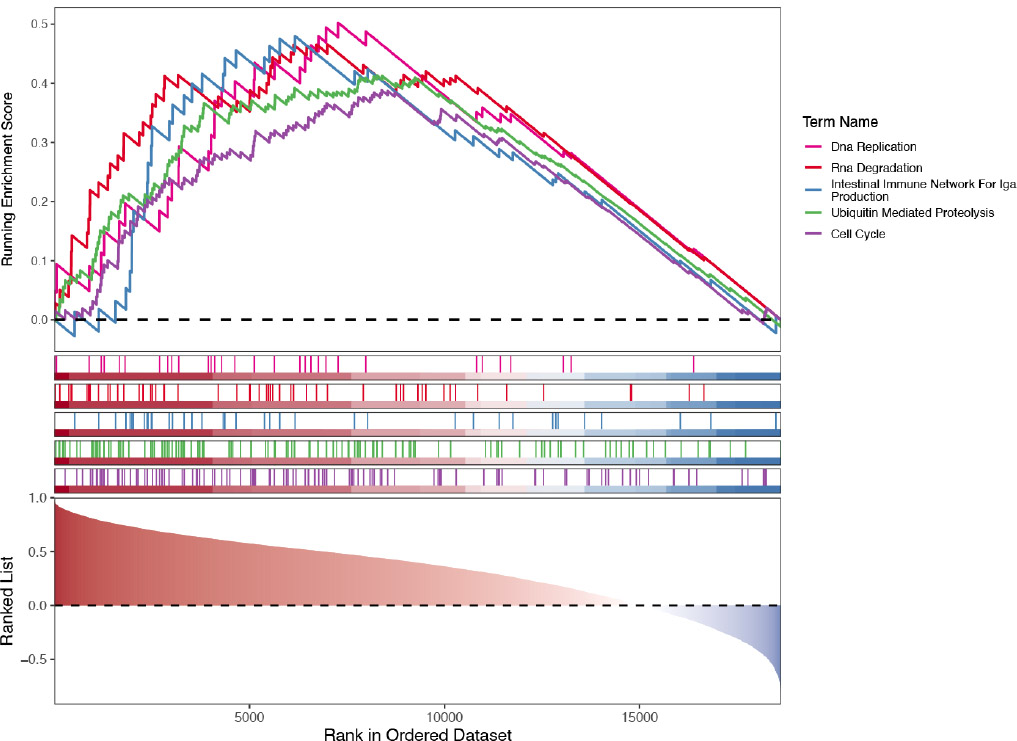
Enrichment results of biomarkers in the blood training set GSE185011 using GSEA. From left to right, and top to bottom, the results of RECQL, NOC3L, SSB, DDX18, ARID3B, LSP1, and TKT enrichment are shown. The vertical axis represents the enrichment score, where a positive Enrichment Score indicates enrichment of a gene set towards the top of the ranked list, and a negative Enrichment Score indicates enrichment towards the bottom. The figure displays the top 5 enriched pathways, both upward and downward, for each biomarker. The horizontal axis represents genes, with each vertical line corresponding to a specific gene.
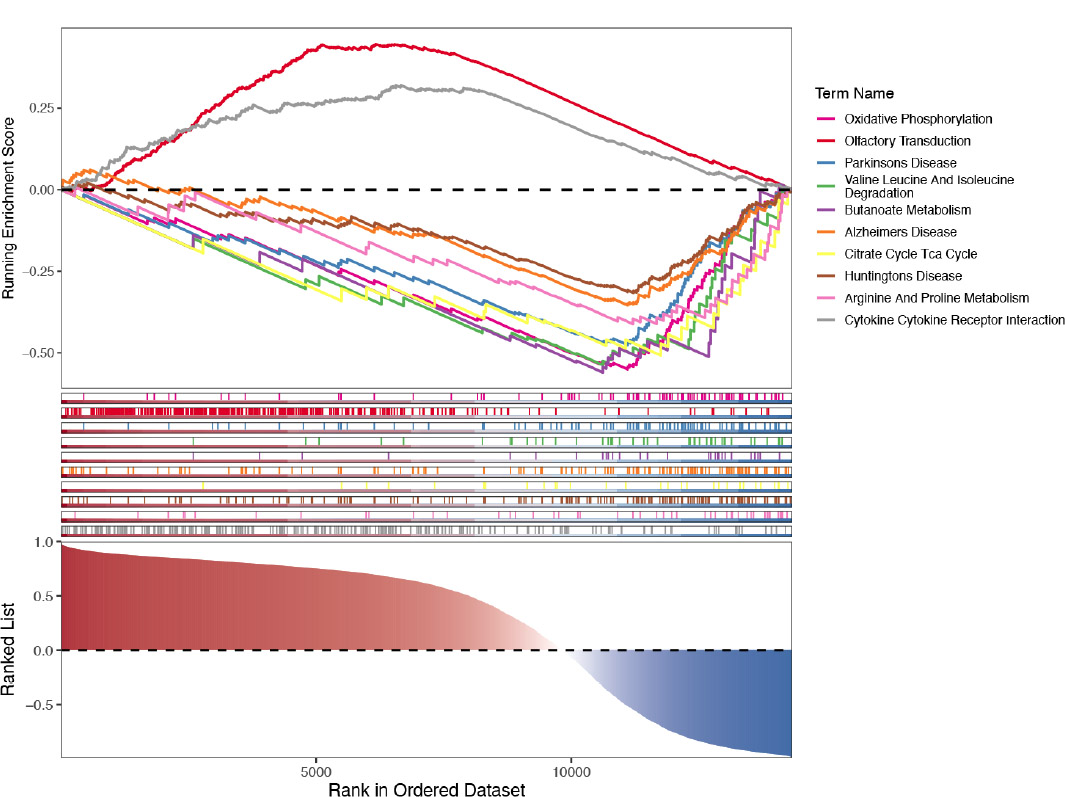
Enrichment results of biomarkers in the tissue training set GSE60436 using GSEA.
3.4. Biomarkers Can Play a Biological Role in Certain Subcellular Organelles
For subcellular location analysis, ARID3B, DDX18, NOC3L, RECQL, and SSB had higher scores in the cytoplasm, suggesting that they may be involved in biological processes related to the cytoplasm. In additional, the scores of LSP1 and TKT were higher in the nucleus, indicating that they may be located in the nucleus (Fig. 5A).
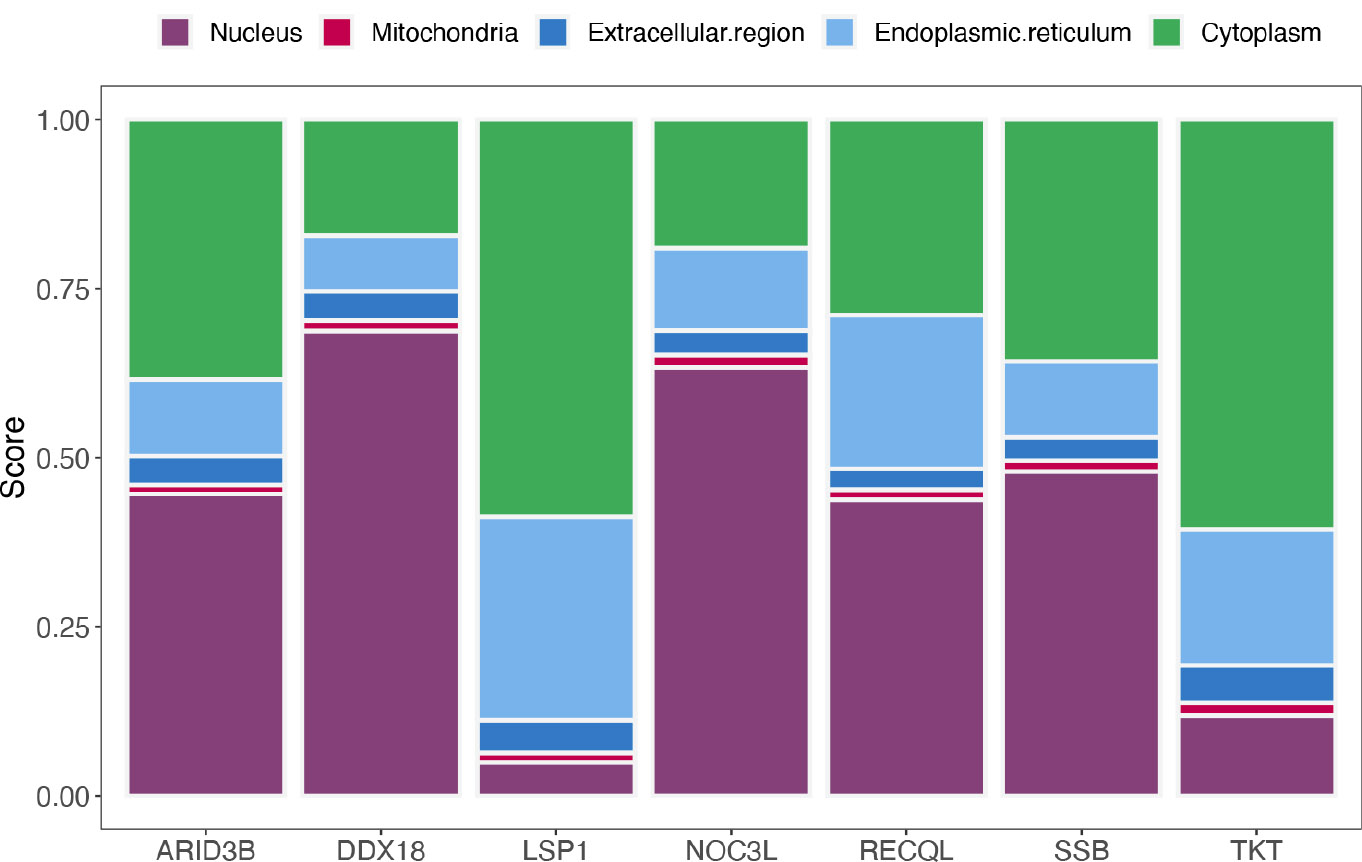
Subcellular localization analysis of biomarkers.
Furthermore, the correlation between biomarkers and metabolic pathways showed that TKT had a significantly positive correlation with xenobiotic metabolism, fatty acid metabolism, bile acid metabolism, bile acid metabolism, and adipogenesis pathways in GSE185011 (Fig. 5B). Moreover, SSB had a significantly positive correlation with several metabolic pathways, such as glycolysis, fatty acid metabolism, etc, in GSE60436 (Fig. 5C).
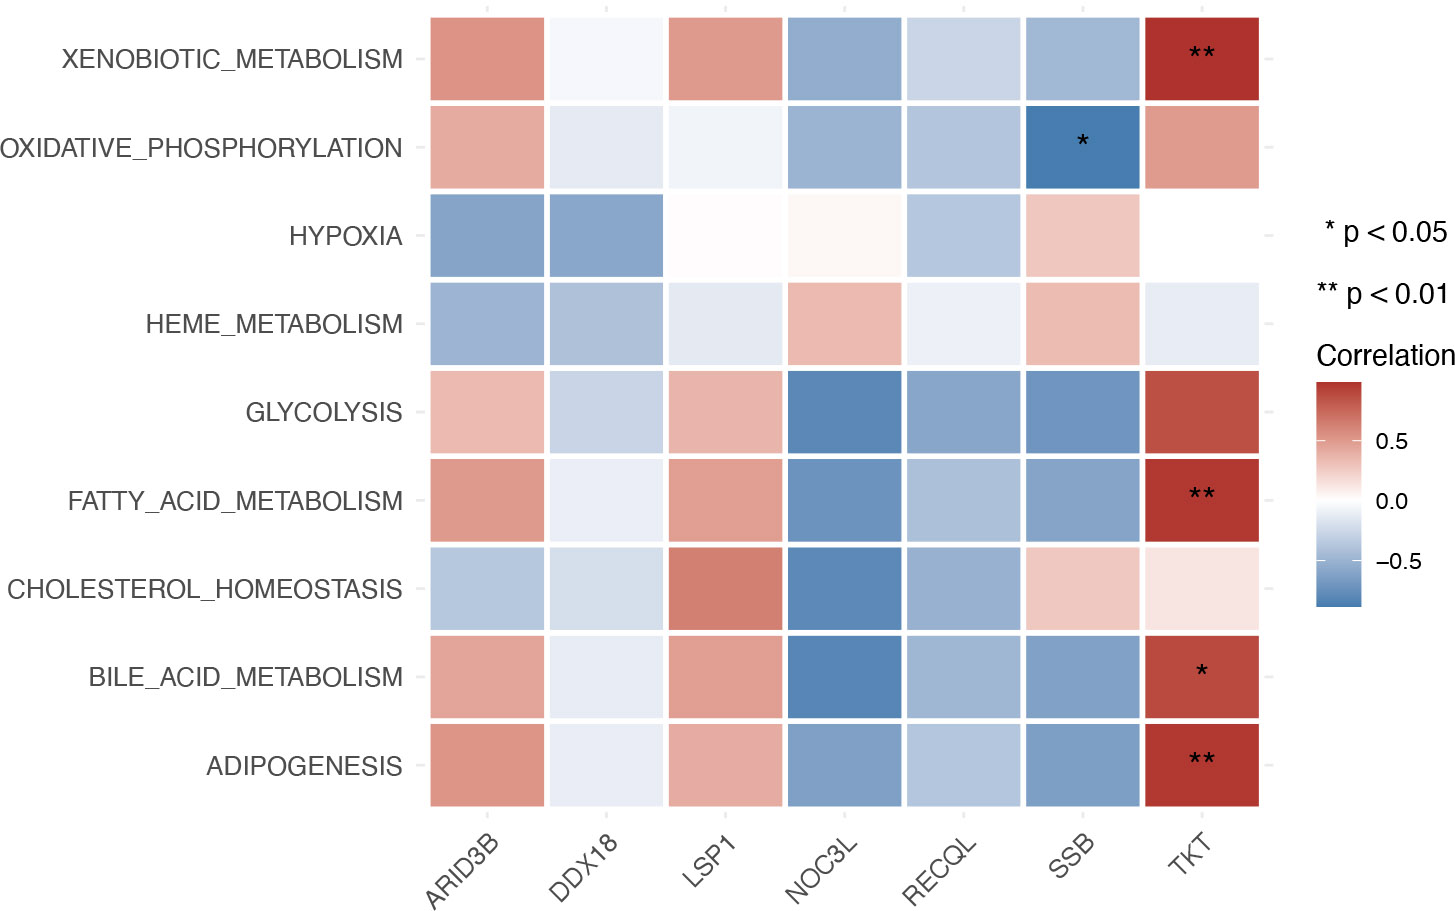
Heatmap depicting the correlation between biomarkers and metabolic pathways in the blood training set GSE185011.
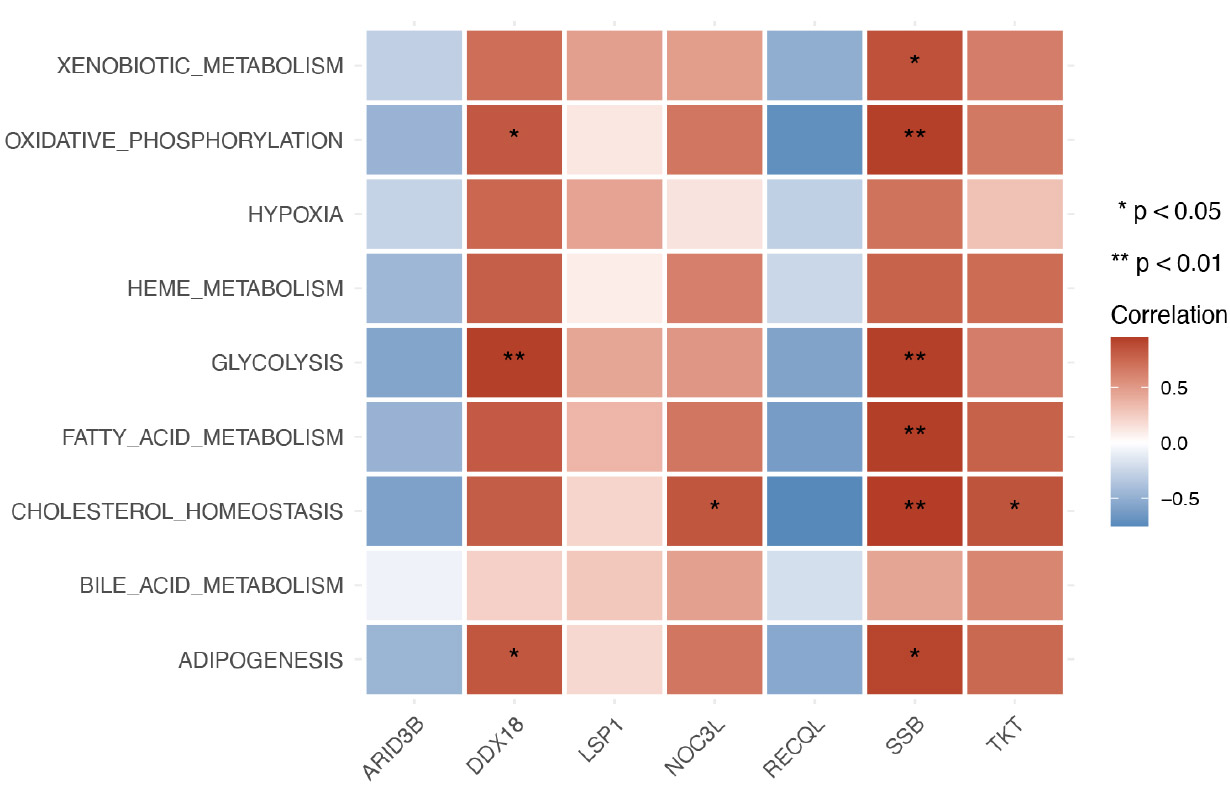
Heatmap illustrating the correlation between biomarkers and metabolic pathways in the tissue training set GSE60436.
3.5. There were Some Networks Related to Biomarkers
Firstly, there were 2 biomarker-pathway-gene networks searched. One of these was TKT-pentose phosphate pathway-genes (PGM2, TALDO1, ALDOA, RPE, GPI, RPIA), and the other was SSB-systemic lupus erythematosus-genes (SNRPD1, SNRPD3, SNRPB) (Fig. 6A). These results might imply that biomarkers play an important role in the occurrence and development of related diseases, such as diabetes mellitus and systemic lupus erythematosus.
Later, based on 7 biomarkers, 176 miRNAs (hsa-mir-1-3p, hsa-mir-210-3p, hsa-mir-124-3p) and 36 TFs (MEF2A, NR3C1, FOXC1) were predicted, and a TF-miRNA-biomarkers was constructed, including interactions such as PRRX2- ‘hsa-mir-200b-3p’-SSB, HINFP- ‘hsa-mir-335-5p’-LSP1 (Fig. 6B).
Besides, by CTD, 130 diseases and 167 drugs (Resveratrol, Cyclosporine, and Ethinyl Estradiol) were predicted, and a disease-biomarkers-drugs was constructed, such as Lipid Metabolism Disorders-NOC3L-Acetaminophen, Niemann-Pick Disease, Type C-LSP1-bisphenol A, and others (Fig. 6C).
4. DISCUSSION
DR is a complex pathological process influenced by multiple factors. Diabetic patients commonly experience metabolic disturbances, such as hyperglycemia and abnormal glucose metabolism, which can lead to cellular energy deficiencies. This triggers a series of metabolic changes, with lactate being one of the by-products associated with cellular energy metabolism. Furthermore, oxidative stress, characterized by the accumulation of unstable oxidative substances produced through internal oxidative reactions, is commonly observed in diabetic patients. Previous studies have shown that oxidative stress is associated with the mitigation of gene expression for antioxidant enzymes, such as Superoxide Dismutase (SOD), Catalase (CAT), and Glutathione Peroxidase (GPx) [19]. This imbalance may lead to cellular damage and inflammation, processes that contribute to the development of DR. Lactate may play a role in modulating oxidative stress. Additionally, lactate can function as a signaling molecule between cells in certain conditions, participating in the regulation of cell survival, proliferation, and inflammation. As a byproduct of glycolysis, lactate has emerged as a key molecule that connects cellular metabolism to the regulation of cellular activities. The transport of lactate between cells is crucial for metabolic homeostasis and signal transduction [20]. The intercellular communication and signal transduction facilitated by lactate may be implicated in the development of retinal lesions. However, there is currently limited direct research exploring the specific relationship between lactylation and DR.
In this study, we performed differential gene expression analysis between DR and normal samples in both the GSE185011 and GSE60436 datasets, identifying genes that were significantly differentially expressed. We then conducted an intersection analysis of differentially expressed genes from these datasets using the VennDiagram package, revealing 262 genes that were common to both datasets. Next, we intersected these common genes with LRGs, resulting in seven intersecting genes (RECQL, NOC3L, SSB, DDX18, ARID3B, LSP1, TKT), which we refer to as candidate genes. We further analyzed and discussed the roles of these seven lactylation-related biomarkers in DR.
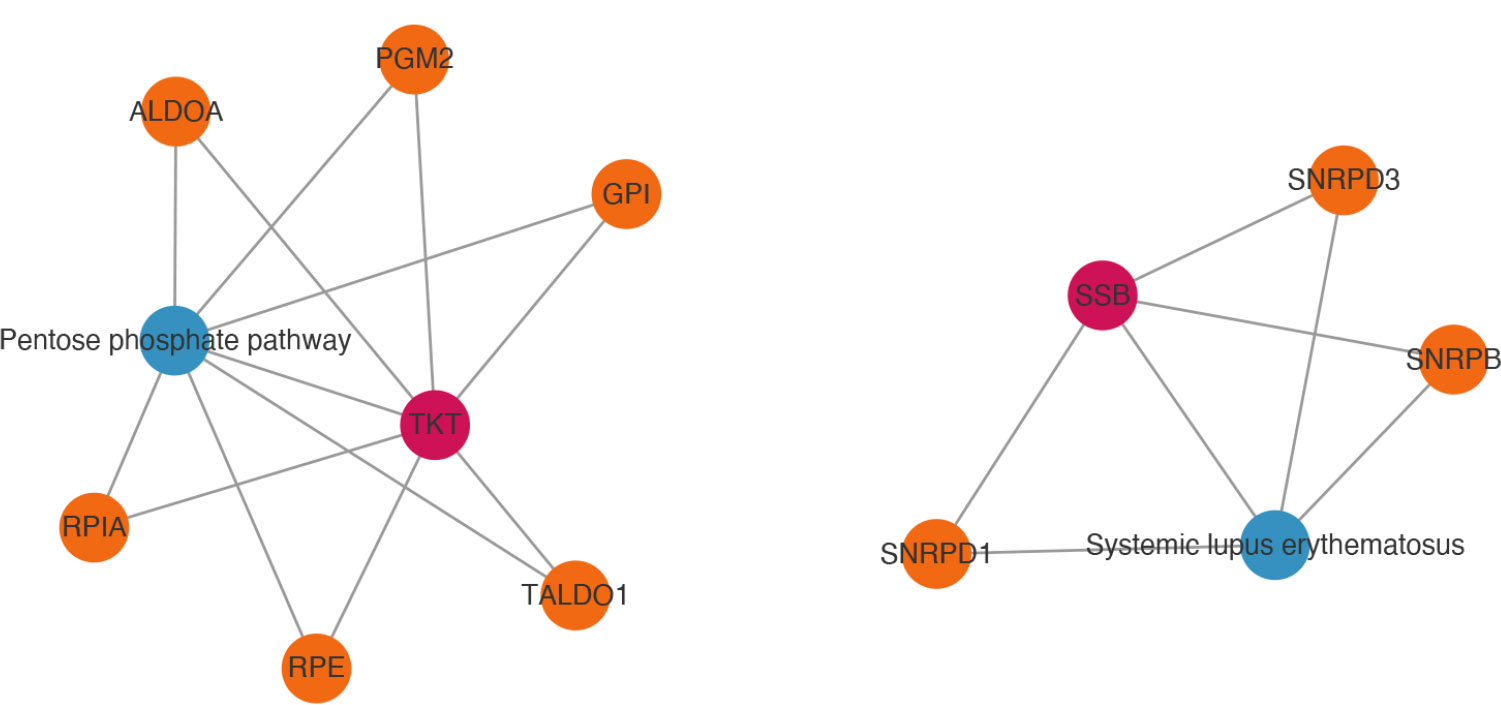
Analysis of the network relationships of biomarker pathways.
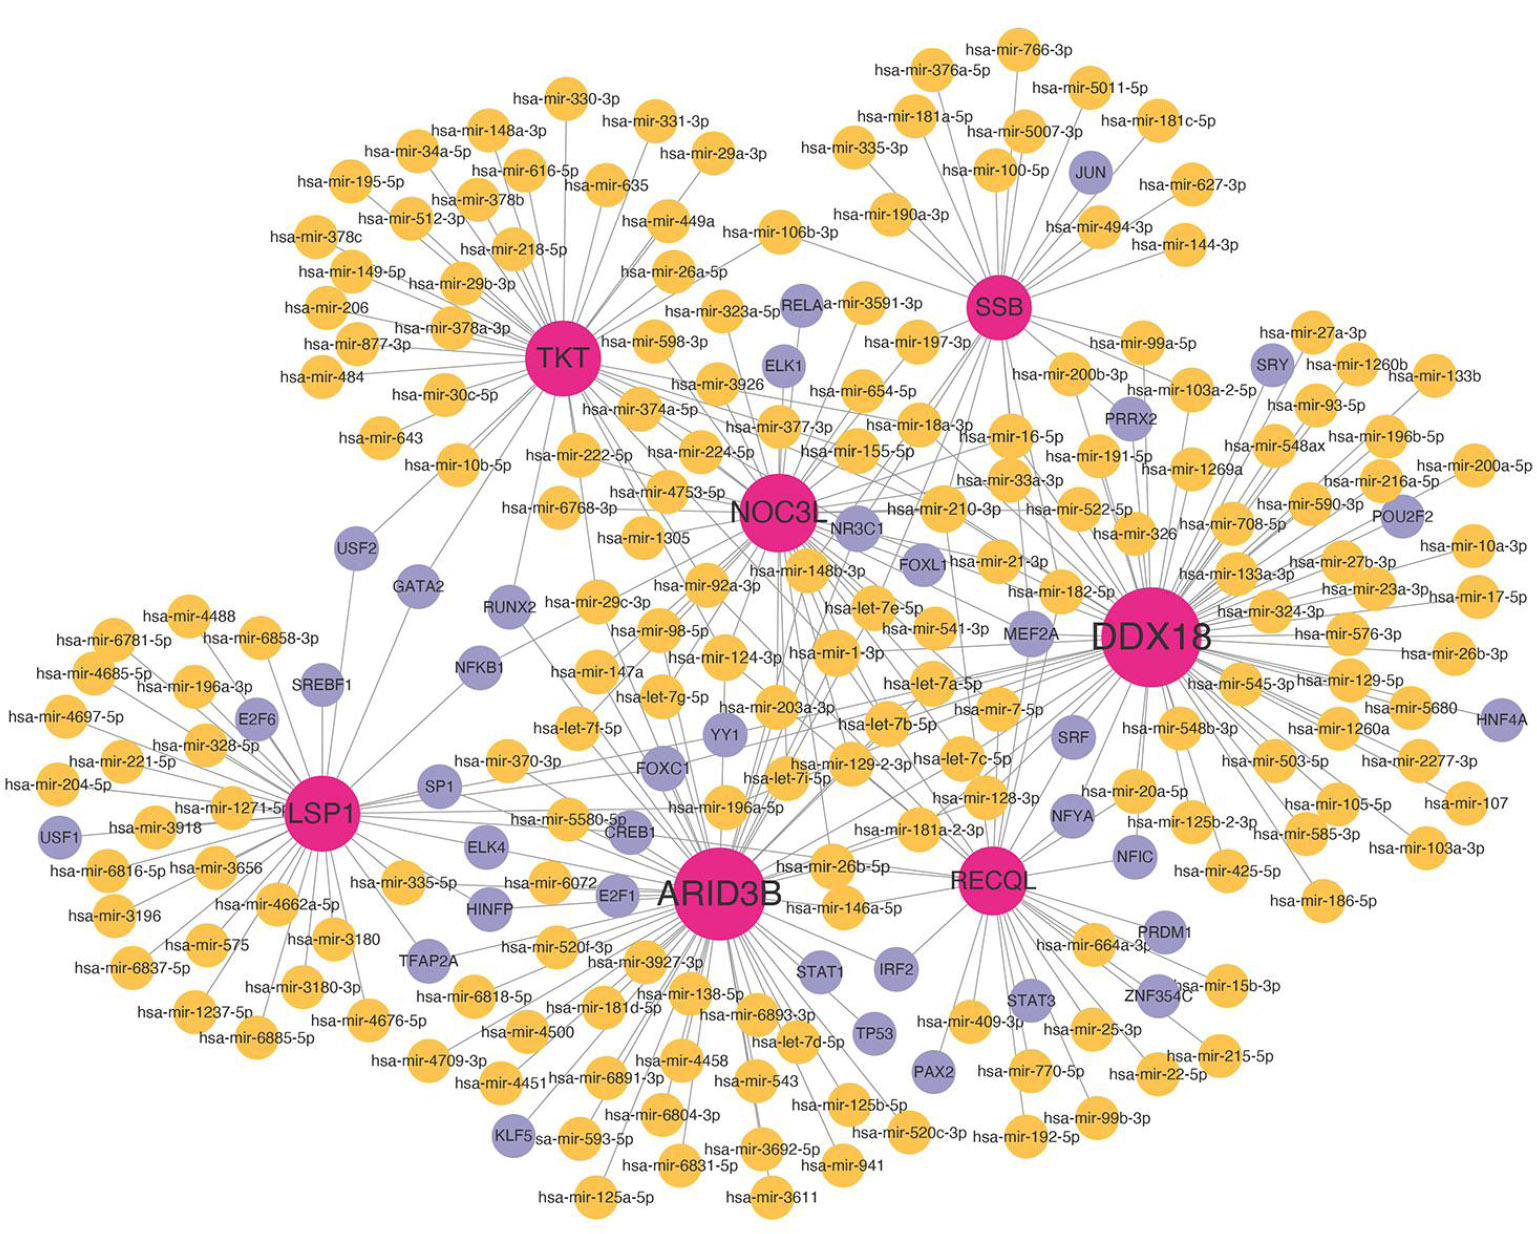
TF-miRNA-biomarker regulatory network analysis. Red nodes represent biomarkers, yellow nodes represent miRNA, and purple nodes represent TF (Transcription Factors).
We performed GO and KEGG pathway analysis on these genes using the clusterProfiler package, revealing associations with pathways such as amino acid biosynthesis, C-type lectin receptor signaling, carbon metabolism, and the pentose phosphate pathway. A brief description of each candidate gene is provided below:
RECQL encodes a helicase belonging to the RecQ DNA helicase family. This helicase is essential for maintaining DNA stability, repairing DNA damage, and contributing to genome stability, thereby preventing abnormal DNA structures and the loss of genetic information.
NOC3L is involved in ribosome biogenesis and assembly, processes critical for protein synthesis.
SSB encodes a DNA-binding protein with a pivotal role in DNA replication and repair [21]. The SSB protein binds to single-stranded DNA, preventing its reformation into double-stranded DNA, thereby contributing to the stability and replication of DNA.
DDX18 encodes a DEAD-box family RNA helicase involved in transcription and RNA metabolism. It is essential for RNA unwinding, decomposition, and RNA synthesis.
ARID3B encodes a protein that may be involved in gene regulation and the regulation of chromosome structure and gene transcription.
LSP1 is a lymphocyte-specific protein that is primarily active in the immune system. It may participate in biological processes such as cell migration, signal transduction, and activation of immune cells.
TKT encodes transketolase, a key enzyme in the pentose phosphate pathway, playing a significant role in glucose metabolism, energy production, and cellular function through reduction processes [22].
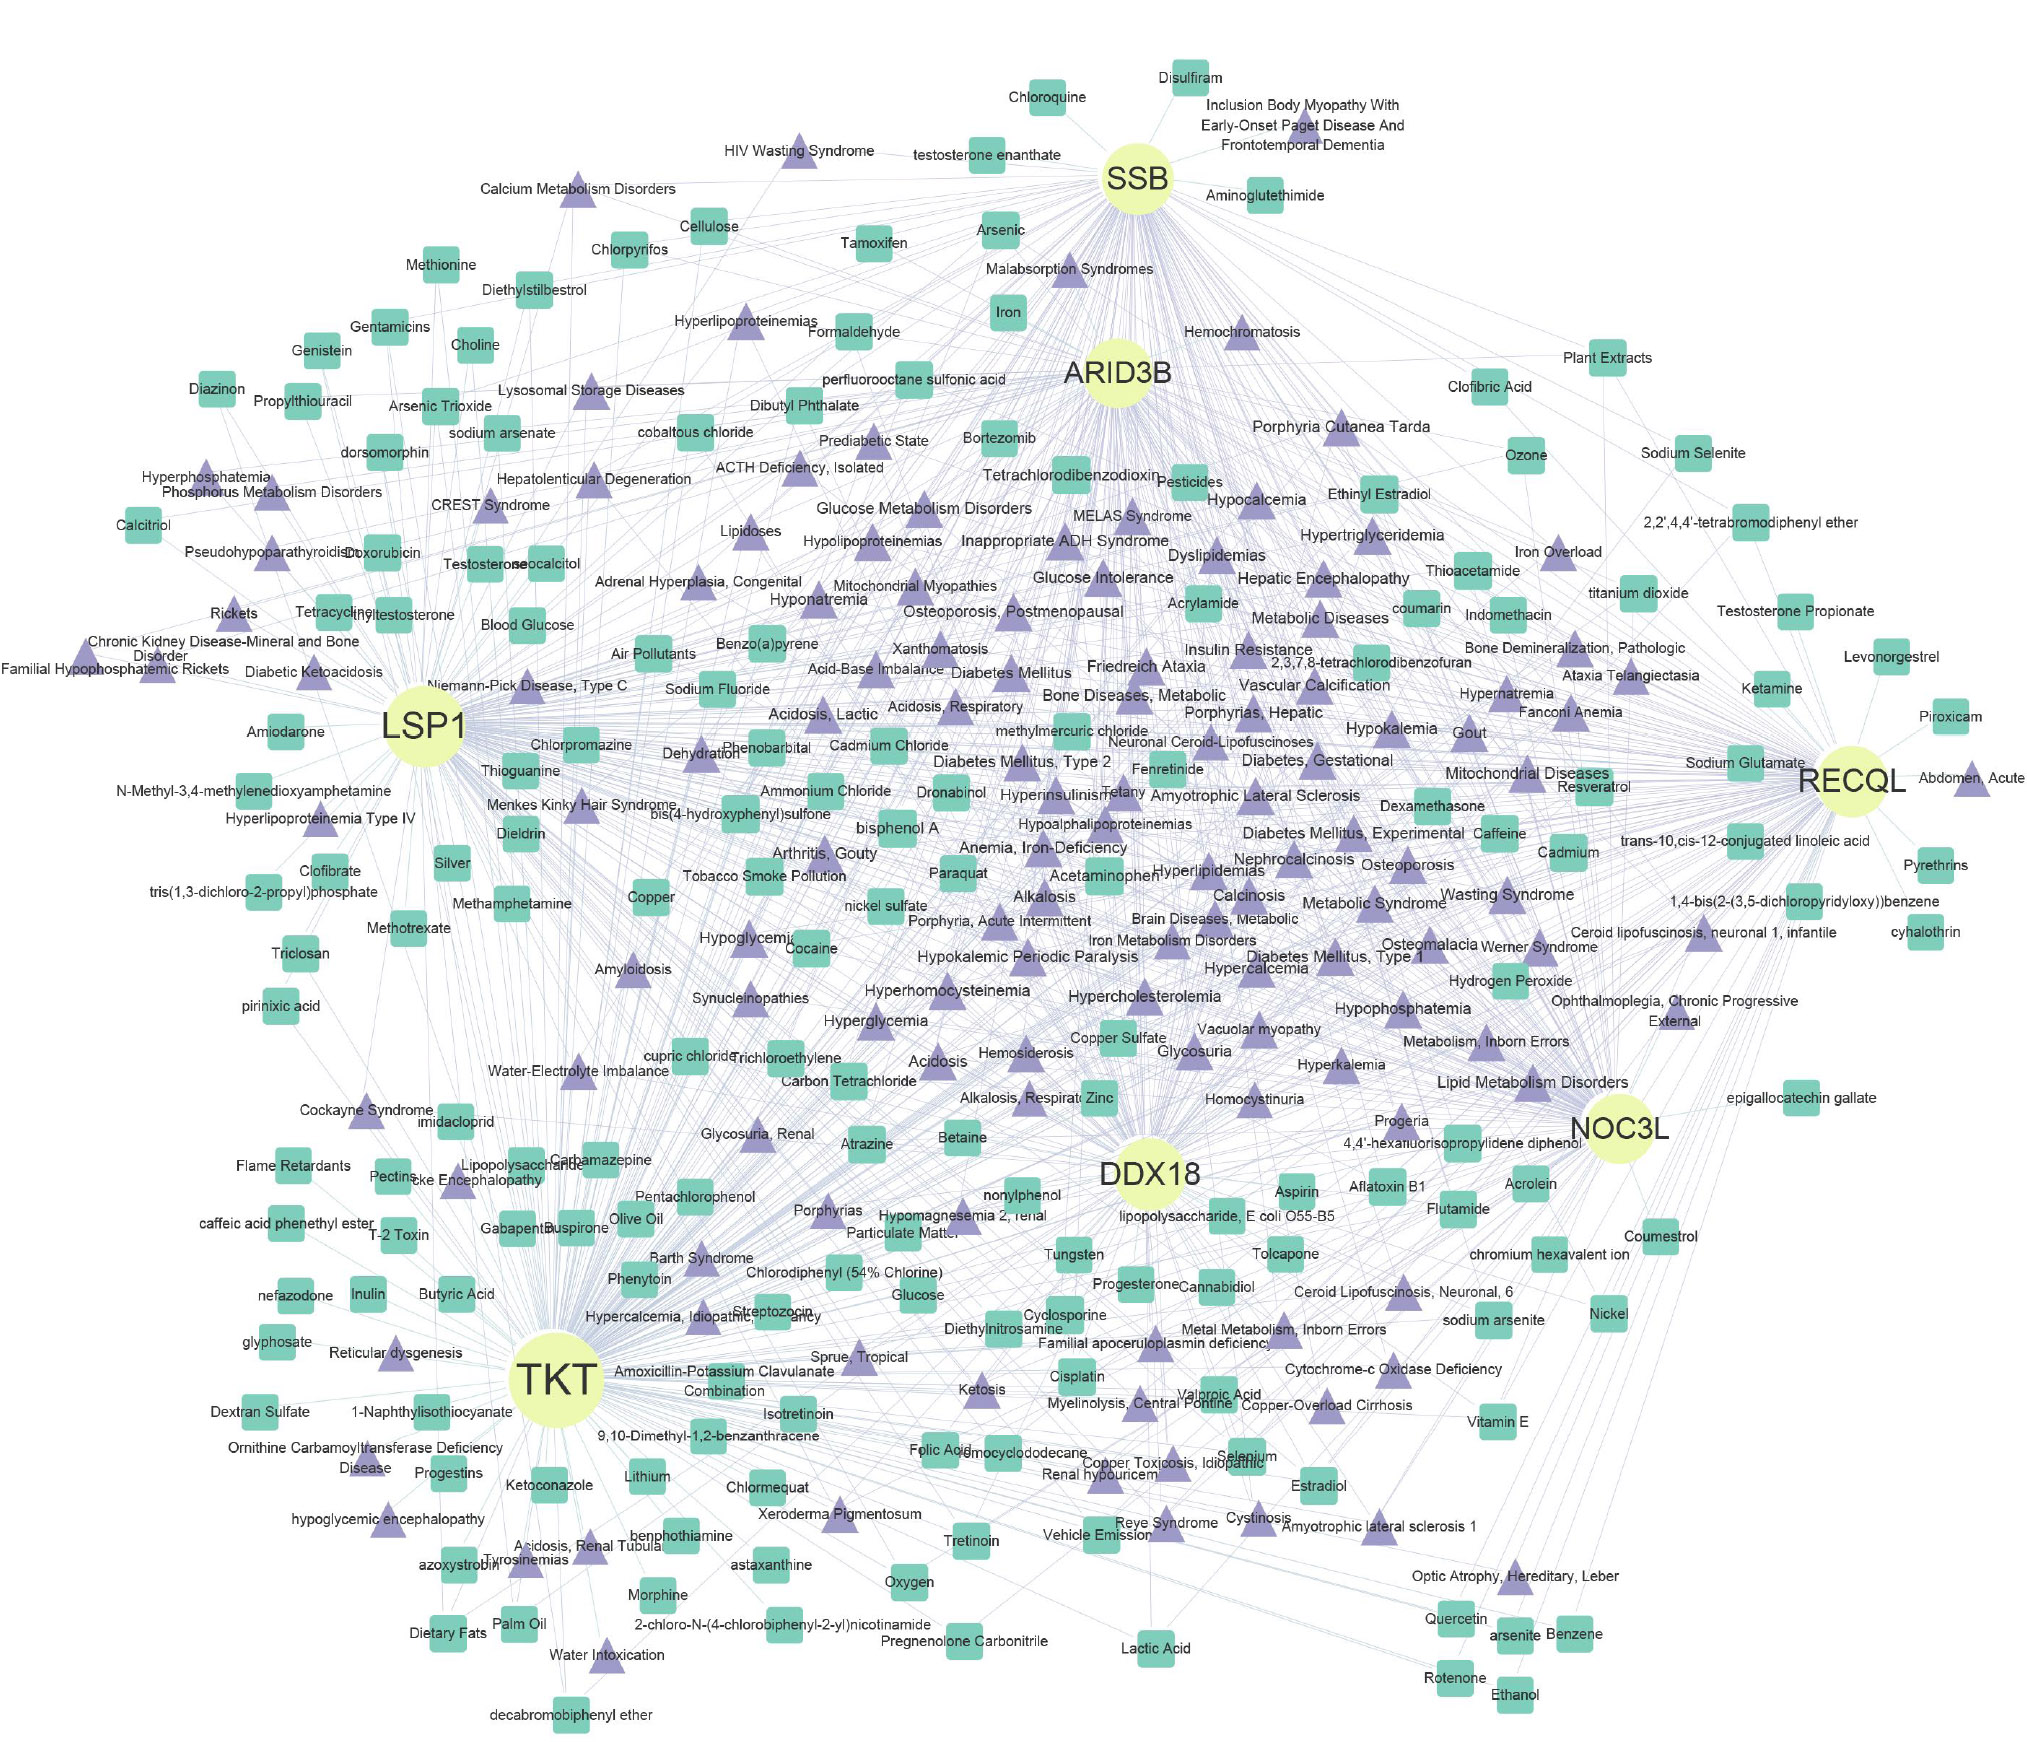
Disease-biomarker-drug interaction network analysis. Yellow nodes represent biomarkers, green nodes represent drugs, and purple nodes represent disease.
Additionally, we conducted expression analysis of these biomarkers in different tissues and performed GSEA. Using mRNALocater, we predicted the subcellular localization of proteins associated with the biomarkers. ARID3B, DDX18, NOC3L, RECQL, and SSB were predicted to have higher cytoplasmic localization scores, while LSP1 and TKT had higher nuclear localization scores.
We also analyzed the correlation between biomarkers and metabolic pathways. In the blood training dataset (GSE185011), TKT exhibited a significant positive correlation with xenobiotic metabolism [23], fatty acid metabolism [24], bile acid metabolism, and lipid biosynthesis pathways. In the tissue training dataset (GSE60436), SSB showed a significant positive correlation with xenobiotic metabolism, oxidative phosphorylation, glycolysis [25], fatty acid metabolism, cholesterol homeostasis, and lipid biosynthesis pathways.
Additionally, two biomarker-pathway-gene networks were identified. One network involved the TKT-pentose phosphate pathway genes, and the other involved the SSB-systemic lupus erythematosus genes. These results suggest that these biomarkers play a significant role in the onset and progression of diabetes. Based on the seven biomarkers, we conducted a TF-miRNA-biomarker regulatory network analysis and predicted 176 miRNAs and 36 Transcription Factors (TFs). The top three miRNAs, ranked by network node degree, were hsa-miR-1-3p, hsa-miR-210-3p, and hsa-miR-124-3p. The top three TFs were MEF2A, NR3C1, and FOXC1. These miRNAs and TFs play critical roles in regulating various biological processes and diseases, including tumor initiation, cardiovascular diseases, and neural development. Their involvement in inflammation, angiogenesis, and cell apoptosis suggests their potential role in DR [26, 27]
Finally, we conducted a CTD analysis and predicted 130 associated diseases and 167 drugs. The seven biomarkers were found to be linked with diseases such as diabetes, glucose metabolism disorders, and acidosis. Drug interaction network analysis indicated that Resveratrol and Cyclosporine may have potential therapeutic effects for DR. Resveratrol, a natural compound found in grape skins, red wine, and some plants, is believed to possess antioxidant, anti-inflammatory, anti-cancer, and cardiovascular protective effects. Its antioxidant and anti-inflammatory properties may help alleviate retinal lesions caused by diabetes [28]. Cyclosporine, an immunosuppressant, can inhibit inflammatory responses, potentially reducing inflammation associated with DR [29].
Despite the comprehensive bioinformatics analysis conducted in this study to explore lactylation-related genes and their potential mechanisms in DR, several limitations must be acknowledged. First, gene expression data derived primarily from public databases such as GEO may exhibit heterogeneity in sample sources, experimental protocols, and patient demographics, potentially introducing bias and affecting the generalizability of our findings. Second, while we identified differentially expressed lactylation-related genes and predicted their functional roles through enrichment analyses, these results are largely based on computational predictions and require further experimental validation, such as PCR, Western blotting, or Chromatin Immunoprecipitation (ChIP), to confirm their biological relevance in DR pathogenesis. Third, the regulatory networks and signaling pathways inferred from bioinformatics tools are predictive in nature and may not fully capture the complex in vivo interactions within the retinal microenvironment. Future studies integrating multi-omics approaches (e.g., proteomics, lactylome profiling) and functional experiments in cellular or animal models of DR are essential to validate our findings and clarify the precise role of lactylation in DR development and progression.
CONCLUSION
In conclusion, we successfully identified biomarkers for DR through differential analysis and expression validation. We analyzed the biological pathways in which these biomarkers are involved. These findings provide valuable clues for further research into DR's pathogenesis and the identification of potential therapeutic targets. However, the clinical application of these biomarkers requires more data support, necessitating extensive experimental research to validate their reliability and potential clinical utility. In the future, we will continue to focus on the functions of these genes and their roles in the progression of diabetic retinopathy.
AUTHORS' CONTRIBUTIONS
The authors confirm contribution to the paper as follows: W. H. and Y.Z.: Conception and study design, J.K., F.C., W.H., and Y.Z.: Data analysis and interpretation, and writing the manuscript. All authors read and approved the final manuscript.
AVAILABILITY OF DATA AND MATERIALS
The data and supportive information are available within the article.
FUNDING
The study was supported by the National Natural Science Foundation of China (82000890), the Hainan Provincial Natural Science Foundation of China (820RC780), and the Hainan Province Clinical Medical Center.
ACKNOWLEDGEMENTS
None declared.

