All published articles of this journal are available on ScienceDirect.

Endothelial Cells Communicate with Microglia and Retinal Ganglion Cells Through Igfbp3-Tmem219 and Cxcl12-Ackr3 Pathways in Diabetic Retinopathy
Abstract
Introduction/Objective
The purpose of this research is to retrospectively analyze diabetic mouse retina datasets to obtain new insights into Diabetic Retinopathy (DR).
Methods
In this study, we performed single-cell RNA-sequencing (scRNA-seq) on combined diabetic mice retina datasets obtained from previous studies and validated the findings using real-time PCR.
Results
Our findings revealed that the final glucose level, compared to disease progression duration, determines diabetic severity. Pseudobulk RNA-seq analysis of key cell types, such as Endothelial Cells (ECs), microglia, and Retinal Ganglion Cells (RGCs), showed notable communication pathways between them that outweigh even the immune-related responses during hyperglycemia. Lastly, cell-cell communication analysis mapped out notable communication pathways among the three cell types. In essence, ECs secrete more Igfbp3 and less Cxcl12 to Tmem219 receptors on microglia and Ackr3 receptors on RGCs, respectively.
Discussion
Current clinical therapy can only slow disease progression in the retina but not reverse it. Accordingly, the elucidation of early biomarkers for detection is preferred. These results provide potential targets that can be regulated for detection or therapeutic purposes.
Conclusion
Our results indicate that the severity of diabetes is primarily determined by the final blood glucose level, rather than the length of time the disease has progressed. Secondly, our analysis demonstrated significant crosstalk between ECs, microglia, and RGCs that outweighs the significance of immune-related responses when the retina was exposed to extreme levels of blood glucose. Lastly, we validated these communication pathways, specifically Cxcl12-Ackr3 and Igfbp3-Tmem219, to be uniquely initiated by the ECs to RGCs and microglia, respectively.
1. INTRODUCTION
Given that Type 2 Diabetes (T2D) has already reached epidemic levels, it is expected that the incidence of Diabetic Retinopathy (DR), the most common microvascular complication of diabetes that is the leading cause of visual impairment [1, 2], will surge. Current clinical treatment strategies, such as laser [3] or Anti-Vascular Endothelial Growth Factor (anti-VEGF) [4] therapy, serve only to attenuate, rather than resolve, these complications when they become apparent during later stages of the disease. Additionally, prolonged administration of the latter can lead to drug resistance in some patients [5, 6].
Recent studies have conceptualized DR as a disease of the retinal neurovascular unit that consists of interdependent functional coupling between neurons, glia, and vasculature [7, 8] for regulating normal retinal function [9]. Notably, neurodegeneration has even been regarded to precede microvasculature dysfunction [3, 10]. Coupled with these findings, an ideal treatment option must therefore be directed at both the vasculature and the neurodegenerative aspect to reverse potential vision loss. However, retinal neurons characteristically belong to the Central Nervous System (CNS) and are notoriously complex to treat or replace once damaged. This implies that early detection and prevention remain the most effective methods to combat this disease [11]. As such, the continued discovery of novel and consistent early biomarkers is imperative. These goals are made possible through the rapid development of Next-Generation Sequencing (NGS) data analytical methods [12, 13].
Here, we attempted to identify biomarkers by integrating and comparing retina single cell RNA-seq (scRNA-seq) mice datasets contributed by 4 authors [14-17] and validating the findings with PCR results obtained from mice retinal tissue. Through cell trajectory and pseudotime analysis, we found that the final glucose level, as compared to disease progression duration, determined diabetic severity. By using a more robust pseudobulk RNA-seq analysis for Endothelial Cells (ECs), microglia, and Retinal Ganglion Cells (RGCs), we also found significant communication pathways between these 3 cell types that outweigh even the immune-related responses during hyperglycemia. Finally, using cell-cell communication analysis, we were able to pinpoint notable communication pathways among the 3 cell types. Specifically, ECs secrete more Igfbp3 and less Cxcl12 to Tmem219 receptors on microglia and Ackr3 receptors on RGCs, respectively. This communication is one-way and unique, implying it does not involve other cell types in the retina. Besides that, our analysis also indicated a large increase in Mif secretion from microglia and RGCs that are poorly received by ECs due to their reduction of Ackr3 receptors. These results validated previous findings and provided additional targets that can be used for detection or therapeutic purposes.
2. METHODS AND MATERIALS
2.1. Data Sets for Analysis
The datasets used in this study were obtained from the GEO database (http://www.ncbi.nlm.nih.gov/geo/) and the EMBL-European Bioinformatics Institute (https://www. ebi.ac.uk/). In total, data from 4 contributors (Tian Niu [15], Qihuang Jin [16], Van Hove [17], and Kai Chen [14]) were retrieved for analysis. These data were derived from the retina of either diabetic or wild-type mice. Correspondingly, the relevant information of these datasets has been compiled and presented in Table 1.
| Contributor | Animal Information | Sample Number | Classification | Age at the Time of Diabetic Induction | Duration of Disease Progression | Final Blood Glucose (mg/dL) |
|---|---|---|---|---|---|---|
| Shanghai Jiaotong University (Tian Niu data) [15] | Homozygous db/db mice (BKS.Cg-Dock7m+/+ Leprdb/J) | SRR12443300 | Male | Since born | 32 weeks | 561.6 ± 19.8 |
| - | Homozygous db/db mice (BKS.Cg-Dock7m+/+ Leprdb/J) | SRR12443301 | Male | Since born | 32 weeks | 561.6 ± 19.8 |
| - | Homozygous db/db mice (BKS.Cg-Dock7m+/+ Leprdb/J) | SRR12443302 | Male | Since born | 32 weeks | 561.6 ± 19.8 |
| - | Heterozygous db/m (Dock7m+/+ Leprdb) | SRR12443303 | Male | Since born | 32 weeks | 93.6 ± 13.1 |
| - | Heterozygous db/m (Dock7m+/+ Leprdb) | SRR12443304 | Male | Since born | 32 weeks | 93.6 ± 13.1 |
| - | Heterozygous db/m (Dock7m+/+ Leprdb) | SRR12443305 | Male | Since born | 32 weeks | 93.6 ± 13.1 |
| Shanghai General Hospital (Qihuang Jin data) [16] | C57BL/6J + high dose STZ in 5 days | SRR14804689 | Male | 3 to 5 weeks old | 28 weeks | ~450 ± 90 |
| - | C57BL/6J | SRR14804690 | Male | 3 to 5 weeks old | 28 weeks | ~144 ± 27 |
| Peking University First Hospital (Kai Chen data) [14] | Homozygous C57BLKS-Leprdb/db (BKSDB) | SRR19450179 | Male | 3 to 5 weeks old | 13 weeks | ~375 ± 50 |
| - | Homozygous C57BLKS-Leprdb/db (BKSDB) | SRR19450180 | Male | Since born | 13 weeks | ~375 ± 50 |
| - | Homozygous C57BLKS-Leprdb/db (BKSDB) | SRR19450181 | Male | Since born | 13 weeks | ~375 ± 50 |
| - | Homozygous C57BLKS-Leprdb/db (BKSDB) | SRR19450182 | Male | Since born | 13 weeks | ~375 ± 50 |
| - | Homozygous C57BLKS-wt/wt (BKSWT) | SRR19450183 | Male | Since born | 13 weeks | ~131 ± 4 |
| - | Homozygous C57BLKS-wt/wt (BKSWT) | SRR19450184 | Male | Since born | 13 weeks | ~131 ± 4 |
| - | Homozygous C57BLKS-wt/wt (BKSWT) | SRR19450185 | Male | Since born | 13 weeks | ~131 ± 4 |
| - | Homozygous C57BLKS-wt/wt (BKSWT) | SRR19450186 | Male | Since born | 13 weeks | ~131 ± 4 |
| Oxurion (Van Hove data) [18] | C57BL/6J (Akimba) | E-MTAB-9061 (scrTG003) | Male | Since born | 12 weeks | ~502 ± 11 |
| - | C57BL/6J | E-MTAB-9061 (scrTG001) | Male | Since born | 12 weeks | ~177 ± 46 |
2.2. Bioinformatics Analysis
2.2.1. Quality Control, Clustering, and Annotation
These analyses were performed using the Seurat v5 [19] package in R Studio. For quality control, only cells containing nCount_RNA > 800, nFeature_RNA > 500, and percent.mt < 20 were included in further analysis. Subsequently, clustering was conducted with a resolution of 0.8, and cells were annotated manually based on known markers.
2.2.2. Cell Trajectory and Pseudotime Analysis
These analyses were performed using the Monocle3 [20] package in R Studio. Wild type (WT) mice datasets belonging to all 4 contributors (n = 9) were merged with Type 2 diabetic (DB) mice datasets belonging to Van Hove (final blood glucose ~502 ± 11 mg/dL, n = 1), Kai Chen (final blood glucose ~375 ± 50 mg/dL, n = 4) and Tian Niu (final blood glucose ~562 ± 20 mg/dL, n = 3) before integrating and subsetting individual annotated cell types for cell trajectory and pseudotime analysis.
2.2.3. Pseudobulk RNA-seq Analysis and Enrichment Map Generation
WT mice datasets from all 4 contributors (n = 9) were merged with DB mice datasets contributed by Van Hove (final blood glucose ~502 ± 11 mg/dL, n = 1) and Tian Niu (final blood glucose ~562 ± 20 mg/dL, n = 3). Endothelial Cells (ECs), microglia, and Retinal Ganglion Cells (RGCs) were then subsetted for pseudobulk differential gene expression comparison between DB and WT conditions using the DESeq2 [13] package in R Studio. Their counts data were also extracted and analyzed using Gene Set Enrichment Analysis (GSEA) software (Version 4.2.2) [21]. Results obtained were then used for generating enrichment maps using Cytoscape software [22] with the EnrichmentMap application [23].
2.2.4. Cell-cell Communication Analysis
Cell-cell communication between ECs, microglia, and RGCs was evaluated using the CellChat [24] package in R Studio. Specifically, WT mice datasets from all 4 contributors (n = 9) were used to create the WT cellchat object whereas DB mice datasets contributed by Van Hove (final blood glucose ~502 ± 11 mg/dL, n = 1) and Tian Niu (final blood glucose ~562 ± 20 mg/dL, n = 3) were utilized to create the DB cellchat object for analysis. Differentially expressed incoming (receptor) and outgoing (ligand) signaling pathways concerning ECs, microglia, and RGCs were subsequently isolated for more in-depth analysis.
2.2.5. Animal Experiment
Eight Male C57BL/6J mice aged between 6 and 8 weeks, weighing 18 to 23 grams, were intraperitoneally injected with Streptozotocin (STZ) at a dose of 50 mg/kg, dissolved in 10 mM citrate buffer with a pH of 4.5, following a 12-hour fasting period. STZ was administered daily continuously for the first 5 days, and the mice were then left alone for diabetes to develop over the next 12 weeks. In the WT group, sodium citrate buffer served as the vehicle control. Diabetes was considered to be induced when the mice showed an average stable fasting glucose level of more than 16.7 mmol/L at the end of the 12-week duration. Following that, mice were anesthetized and euthanized through cervical dislocation. Their retinal tissues were then harvested for RNA extraction and PCR experiments. All animal experimental procedures complied with the guidelines of the National Institutes of Health (NIH) and were approved by the Laboratory Animal Ethics Committee of Jinan University. Animals were purchased from Guangdong Medical Laboratory Animal Center. Every effort was made to minimize the pain and number of animals used in the experiments. All animals have ad libitum access to food and water. The animal study approval number is IACUC-20190509-04.
2.2.6. Real Time-quantitative PCR (RT-qPCR)
Total RNA was extracted from the mice retina using Trizol reagent according to the manufacturer’s protocol. The extracted RNA was reverse-transcribed into cDNA using the PrimeScript RT kit that incorporated a genomic DNA eraser (Takara, China). SYBR Green reagents (Takara, China) were used to perform quantitative PCR on a CFX96 Real-Time System. Each reaction was replicated three times, and results were quantified using the 2-ΔΔCt method. Primers used were tabulated in Table 2.
| Gene Name | Accession Number | Forward Primer | Reverse Primer |
|---|---|---|---|
| Mouse Gapdh | NM_008084.2 | CCT CGT CCC GTA GAC AAA ATG | TGA GGT CAA TGA AGG GGT CGT |
| Mouse Igfbp3 | NM_008343.2 | CTC AAA GCA CAG ACA CCC AGA A | GGC GGC ACT GCT TCT TCT TAT |
| Mouse Cxcl12 | NM_001012477.2 | AGT GAC GGT AAA CCA GTC AGC C | AGG GCA CAG TTT GGA GTG TTG A |
| Mouse Tmem219 | NM_001374613.1 | CCT CAC GTC GTC GGC TTA CT | AAT ATA GGC AGG TCC CTG GAG TC |
| Mouse Mif | NM_010798.3 | GCA AGC CCG CAC AGT ACA TC | GCT TAC TGT AGT TGC GGT TCT GG |
| Mouse Ackr3 | NM_001271607.1 | TGT CCC ACC ATG CCT AAC AA | GAT GGT GAT GAC GAC CCA CA |
3. RESULTS
3.1. Retinal Diabetic Severity Depends on Final Blood Glucose
To determine whether the severity of diabetic retinopathy is determined by disease duration or blood glucose levels, we used datasets that could be sequentially ordered by one variable but not the other. These datasets were annotated with known markers (Fig. 1A and Figs. S1 and S2) and grouped according to their final blood glucose level, containing their respective duration of disease progression (Fig. 1B). Of note, it could be observed that the arrangement of final blood glucose level (131 to 145 mg/dL, 325 to 425 mg/dL, 469 to 497 mg/dL and 542 to 581 mg/dL) based on its ascending range of concentration were not consistent with their corresponding duration of disease progression (0 weeks, 13 weeks, 12 weeks, 32 weeks). Since both of these variables of interest exist as a continuum which were not reflected in the data, we reasoned that the variable shown to be continuous in the pseudotime analysis would be the determining factor of diabetic severity. Of the total 12 cell types that were annotated and analyzed, we found 4 cell types that consistently exhibited pseudotime continuum for final glucose level instead of duration of disease progression (Figs. 1 and 2). Specifically, one of the 4 cell types showing this trend is amacrine cells (ACs) (Fig. 1C). When we focused on the top 3 genes that changed over pseudotime (Fig. 1D), we were able to validate their regulatory trend through Uniform Manifold Approximation and Projection (UMAP) graph visualization and their respective cellular quantification (Fig. 1E-J). The other cell type found to support the final glucose level as the determinant of diabetic severity is Muller glial (MG) cells (Fig. 1K). Similarly, we were able to validate the trend of the top 3 genes that changed over pseudotime (Fig. 1L) using UMAP graph visualization and their cellular quantification (Fig. 1M-R). The other two cell types that further support these findings are ON-cone bipolar cells (ON CBCs) and rod bipolar cells (RBCs) (Fig. 2A-P). On the other hand, the other 8 cell types were not suitable for trajectory analysis due to either the lack of cells or the lack of gene profile change over time (Fig. S3). Together, these results revealed that glucose levels, rather than disease progression duration, determine the severity of diabetic retinopathy.
3.2. EC–Microglia–RGC Crosstalk in Hyperglycemia
Hyperglycemia has been shown to have detrimental effects on ECs in the retina, including oxidative stress and dysregulated growth factors [25, 26]. In order to verify previous findings as well as probe for other outcomes, we next performed a pseudobulk differential gene expression comparison in ECs between diabetic and normal conditions. Principal Component Analysis (PCA) results showed that the transcriptomic profiles of all EC samples (both normal and diabetic) varied widely (Fig. S4A). Accordingly, their volcano plot (Fig. S4B) and heatmap of top-regulated genes (Fig. 3A) displayed relatively low levels of gene regulation and disordered sample clustering, respectively. Additionally, the enrichment map generated using GSEA (Fig. 3B) showed enriched pathways such as ‘neurotransmitter receptor activity’ and ‘regulation of acute inflammatory response to antigenic stimulus’ that possibly involved microglia and neurons. Therefore, we proceeded to investigate the Differentially Expressed Genes (DEGs) in microglia. In contrast to ECs, PCA results obtained from microglia analysis were more consistent and identified two distinct conditions (Fig. S4C). Their corresponding volcano plot (Fig. S4D) and heatmap (Fig. 3C) displayed higher levels of gene regulation and ordered sample clustering, respectively. Interestingly, the enrichment map did not depict immune response-related pathways but instead showed that microglia were involved in neuronal pathways such as ‘voltage-gated potassium channel activity’ and ‘glutamate receptor activity’ (Fig. 3D). This led us to further evaluate the differential gene expression in RGCs. Similar to microglia, the PCA plot for RGCs was consistent and showed obvious differences between conditions (Fig. S4E). This was reflected in the high levels of gene regulation in the volcano plot (Fig. S4F) and the ordered sample clustering in the heatmap (Fig. 3E). The enrichment map revealed that under diabetic conditions, RGCs have enriched pathways that were involved in ‘postsynaptic neurotransmitter receptor activity’, ‘presynaptic active zone’, and ‘voltage-gated potassium channel activity’. On closer inspection, we also observed some immune-related pathways such as ‘interferon receptor binding’ and ‘immunoglobulin complex’ (Fig. 3F). In sum, these results indicated that ECs, microglia, and RGCs might be actively communicating during hyperglycemia.
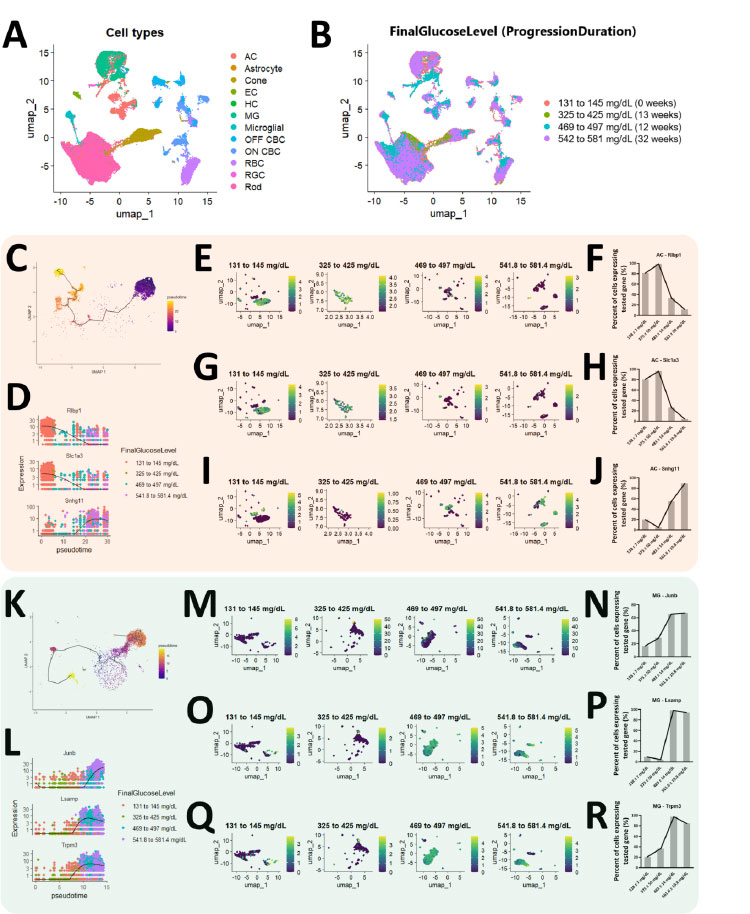
Diabetic severity in the retina is determined by the final blood glucose level as compared to disease progression duration (ACs and MG). UMAP graph depicting the (A) annotated cells and grouped according to (B) final blood glucose level. The duration of disease progression for each corresponding final blood glucose level was included as well. Data from all the contributors except Qihuang Jin’s STZ diabetic mice were used. (C) Trajectory analysis of amacrine cells (ACs) and the (D) top 3 significant genes were plotted. Results of the trend of (E, F) Rlbp1, (G, H) Slc1a3, and (I, J) Snhg11 changing over time were also cross-validated. (K) Trajectory analysis of Muller glial (MG) and the (L) top 3 significant genes were plotted as well. The trend of (M, N) Junb, (O, P) Lsamp, and (Q, R) Trpm3 changing over time was similarly cross-validated.
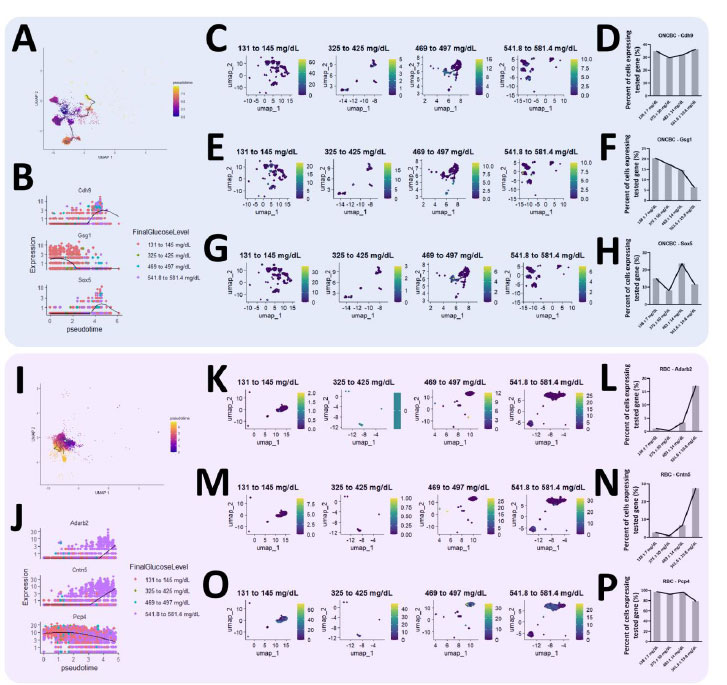
Diabetic severity in the retina is determined by the final blood glucose level as compared to disease progression duration (ON CBC and RBCs). (A) Trajectory analysis of ON-cone bipolar cells (ON CBCs) and the (B) top 3 significant genes were plotted. Results of the trend of (C, D) Cdh9, (E, F) Gsg1, and (G, H) Sox5 changing over time were also cross-validated. (I) Trajectory analysis of rod bipolar cells (RBCs) and the (J) top 3 significant genes were plotted as well. The trend of (K, L) Adarb2, (M, N) Cntn5, and (O, P) Pcp4 changing over time was similarly cross-validated.
3.3. Cxcl12-Ackr3 and Igfbp3-Tmem219 Mediate EC Signaling to RGCs and Microglia
In order to elucidate the cell-cell communication pathways between ECs, microglia, and RGCs, we next analyzed outgoing (ligand) and incoming (receptor) signaling patterns between diabetic and normal conditions for only these 3 cell types (Fig.S5). The corresponding differentially expressed signaling pathways based on DEGs revealed a plethora of communication pathways between all 3 cell types (Fig. 4A-C). However, when we attempted to verify all of these pathways based on gene counts, most of them appeared to be of low significance. Eventually, we only uncovered a few notable pathways, such as the Igfbp3-Tmem219 (Fig. 4A), Cxcl12-Ackr3 (Fig. 4A), and the Mif-Ackr3 pathway (Fig. 4B and 4C). Subsequently, a summary of how ECs, microglia, and RGCs might have communicated was presented in Fig. (4D). Thereafter, we proceeded to perform PCR on normal and diabetic mice retina to obtain the log2 fold change of the genes involved (Fig. 4E). It was observed that only Igfbp3 and Cxcl12 displayed comparable regulatory trends to what was analyzed. To validate that diabetes was induced in the mice, their blood glucose and weight at Week 12 following STZ induction were measured (Fig. S6). Lastly, by plotting the individual CXCL and IGFBP signaling pathway networks (Fig. 4F and G), we determined that these two pathways exhibit unique, one-way communication from ECs to RGCs and from ECs to microglia, respectively.
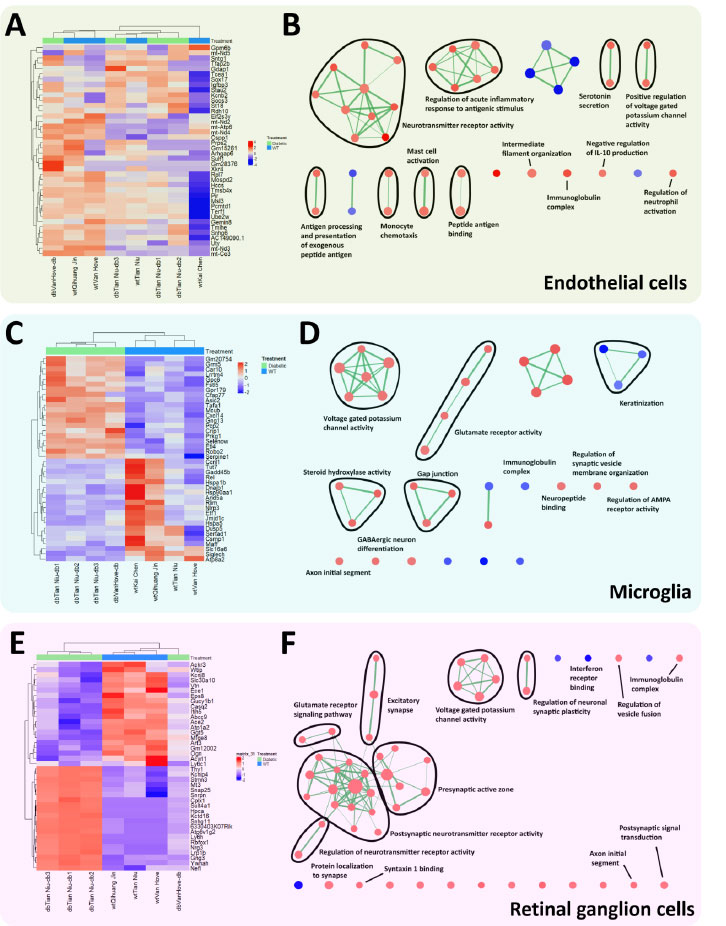
Endothelial cells (ECs), microglia, and retinal ganglion cells (RGCs) appeared to crosstalk in a hyperglycemic condition. Analyses of ECs are presented as a (A) heatmap depicting the top 20 upregulated and downregulated genes for ECs and their corresponding (B) GO enrichment map. Similar analyses were performed for microglia ((C) heatmap and (D) GO enrichment map) and RGCs ((E) heatmap and (F) GO enrichment map).
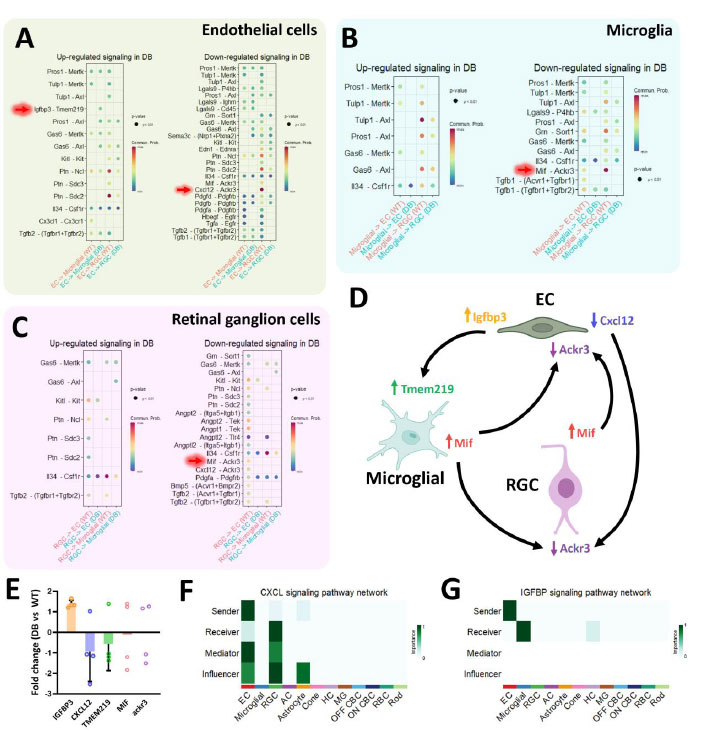
Cxcl12-Ackr3 and Igfbp3-Tmem219 signaling pathways are unique one-way communication between ECs to RGCs and ECs to microglia, respectively. Cell-cell communication analysis based on differentially expressed genes for (A) ECs, (B) microglia, and (C) RGCs. (D) Summary of notable cell communication pathways between ECs, microglia, and RGCs. (E) Fold change obtained through real-time PCR showed Igfbp3 and Cxcl12 were consistent with the analyzed data. (F, G) Individual signaling pathway network analysis depicting unique ECs communication with microglia and RGCs during diabetic conditions.
4. DISCUSSION
In this work, we systematically analyzed the combined, but diverse, diabetic and wild-type mice scRNA-seq datasets contributed by 4 authors. The integration of these datasets for analysis produced novel findings that were not noted previously. Firstly, we demonstrated that the final blood glucose level determined diabetic severity as compared to disease progression duration. Secondly, our analysis demonstrated significant crosstalk between ECs, microglia, and RGCs that outweighs the significance of immune-related responses when the retinal was exposed to extreme levels of blood glucose. Lastly, we verified these communication pathways, specifically Cxcl12-Ackr3 and Igfbp3-Tmem219, to be uniquely initiated by the ECs to RGCs and microglia, respectively.
The single-cell RNA-sequencing data processing packages used in this work are Seurat, Monocle3, DESeq2, and CellChat. In single-cell RNA-sequencing, cell annotation is generally the most important factor within the entire analysis that requires a high degree of accuracy, especially given that subsequent analyses are all dependent on the annotated cells. To achieve this, Seurat was utilized because it is one of the best packages available that provides accurate cell clustering and, therefore, annotation. Monocle3 specializes in cell trajectory and pseudotime analysis. DESeq2 was originally used for bulk RNA-sequencing. However, it can also be applied to single-cell RNA-sequencing analysis if cell clusters are derived from different sources. Cell types from each source can be grouped together to form one bulk sample, which can be further grouped with other similar bulk samples for comparison with treatment or non-treatment groups. Lastly, CellChat is able to provide information on possible interactions between cell types through ligand and receptor regulation analysis.
Cell trajectory and pseudotime analysis are useful tools for operating on concepts of continuity [27]. By observing how the data points on the UMAP graph of each cell type ‘drift’ over pseudotime, we are essentially looking at how their gene profile changes based on the labeled conditions. In our analysis, the entire cell trajectory path corresponded mostly to ascending levels of final blood glucose instead of disease progression duration (Figures 1 and 2). Therefore, this suggests that the final blood glucose level is the stronger determinant of diabetic severity. Intuitively, we can also derive this outcome by noting the consistently close proximity of the UMAP data points between datasets with (469 to 497 mg/dL) and (542 to 581 mg/dL) final glucose levels. Their disease progression duration is 12 and 32 weeks, respectively. Conversely, the data points from the dataset labeled with (325 to 425 mg/dL, 13 weeks) are closer to the wild-type mice dataset, indicating that their transcriptomic profile is relatively similar.
To validate whether these analyses are accurate, we calculated the percentage of cells expressing the tested gene, plotted out the graph according to ascending final glucose level, and compared the trend changes over time with the respective pseudotime analysis for each gene. Since the trends matched, it indicated that the analysis is likely to be accurate, and therefore, verified the finding that diabetic severity in the retina is determined by the final blood glucose level rather than disease progression duration.
The datasets that were integrated for analysis are very diverse, as evidenced by the PCA plots obtained during pseudobulk RNA-seq analysis (Fig. S4). While this approach will lead to an expected reduction in DEGs, it also means that any genes that are significantly regulated are likely to be conserved in most diabetic conditions. Their corresponding pathway enrichment analysis will also be more robust. For example, our analysis did not reflect that inflammatory responses from microglia constituted the most notable events, although previous studies have documented their contributions to neuroinflammation during DR [28, 29]. Instead, we found pathways related to neurons, such as voltage-gated potassium channel activity, glutamate receptor activity, and neuropeptide binding being enriched (Fig. 3D). Besides that, another advantage of integrating these datasets for analysis is that we were able to obtain sufficient rare cell types in hyperglycemic conditions, such as RGCs [30], for comparison. Their limited numbers and importance in maintaining visual integrity [31] also motivated us to analyze them instead of other neuronal cells in the retina.
In our cell-cell communication analysis, the ligands Igfbp3 and Mif were found to be upregulated, whereas Cxcl12 was downregulated. These findings are in good agreement with previous studies that measured vitreous/tear Igfbp3 [32, 33], Cxcl12 [34], and Mif [34] proteomic levels in human patients, as well as our RT-qPCR results. Accordingly, these 3 ligands were also recommended as biomarkers for DR [33] and Retinal Vein Occlusion (RVO) [34] (the second most common retinal vascular disease after DR). Although the identification of these biomarkers is not novel, our analysis was able to provide some mechanistic insights into how the 3 selected cell types interact with each other when exposed to hyperglycemic conditions. Specifically, we now know that there are two separate one-way communication pathways from ECs (Igfbp3 ligand) to microglia (Tmem219 receptor) and ECs (Cxcl12 ligand) to RGCs (Ackr3 receptor). For the IGFBP pathway, Tmem219 was recently discovered to be a death receptor when signaled through Igfbp3 [35]. This suggested that through this mechanism, aberrant regulation of Igfbp3 during DR might have led to microglia loss. On the other hand, Cxcl12-Ackr3 signaling in the CNS is essential for neuronal positioning and migration during development [36, 37]. As RGCs are matured neurons, it is likely that there are other undiscovered outcomes attributed to this pathway in the diseased state. Future studies can elucidate the role of this communication pathway between ECs and RGCs in greater detail. Additionally, gene regulatory network inference for each cell cluster can be performed. These regulatory network data can be used to predict which drugs may potentially be therapeutic for diabetic retinopathy through comparison of the regulatory network changes in other disease settings following drug administration.
One major advantage of performing retrospective analysis of previously available data is the discovery of new insights that would not have been possible without the advancement of bioinformatics tools. Moreover, in this work, we integrated datasets from four different authors for analysis, thereby greatly enhancing the accuracy of the findings. Of note, analysis with known uses, for example, cell trajectory and pseudotime, can even be used for unreported applications, specifically for inferring if final glucose concentration or duration of disease progression is the determinant of the severity of diabetic retinopathy in this case. However, a limitation of this work is that the data utilized for analysis were obtained from animals and not from humans. Analyzing datasets of the latter would provide more relevant and applicable results
Taken together, these two one-way communications originating from ECs suggested a direct response towards high blood glucose levels. Although neurodegeneration may precede vasculature issues and has been attributed to Advanced Glycation End products (AGEs) and neuroinflammation [10], there is a possibility that the ECs’ responses in the early stages of DR may contribute to neurodegeneration as well. Preventing or attenuating these interactions may thus serve therapeutic purposes.
CONCLUSION
In this work, we demonstrated that the final blood glucose level determined diabetic severity rather than disease progression duration. Furthermore, our analysis revealed that interactions between ECs, microglia, and RGCs were more pronounced than immune-related responses when the retina was subjected to extreme blood glucose levels. We also validated that these communication pathways, specifically Cxcl12-Ackr3 and Igfbp3-Tmem219, are uniquely initiated by ECs to RGCs and by microglia, respectively.
AUTHORS’ CONTRIBUTIONS
The authors confirm contribution to the paper as follows: R.J.H. and J.Y.C.: Contributed equally to this work; R.J.H.: Wrote the manuscript; R.J.H.: Compiled the data obtained for all the analyses and designed the figures; J.Y.C. Performed the animal studies; and P.C.R., R.J.H., J.Y.C. and Y.D.: Proofread and edited the manuscript; Y.D.: Provided guidance and the funding for this work; R.J.H.: Also provided the funding for this work.
LIST OF ABBREVIATIONS
| Anti-VEGF | = Anti-vascular endothelial growth factor |
| CNS | = Central nervous system |
| DR | = Diabetic retinopathy |
| DEGs | = Differentially expressed genes |
| ECs | = Endothelial cells |
| GSEA | = Gene set enrichment analysis |
| NGS | = Next-generation sequencing |
| ON CBCs | = ON-cone bipolar cells |
| PCA | = Principal component analysis |
| RGCs | = Retinal ganglion cells |
| RBCs | = Rod bipolar cells |
| ScRNA-seq | = Single-cell RNA-sequencing |
| STZ | = Streptozotocin |
| UMAP | = Uniform manifold approximation and projection |
ETHICS APPROVAL AND CONSENT TO PARTICIPATE
All animal experimental procedures were approved by the Laboratory Animal Ethics Committee of Jinan University, China. Every effort was made to minimize the pain and number of animals used in the experiments. The animal study approval number is IACUC-20190509-04.
HUMAN AND ANIMAL RIGHTS
All animal experimental procedures complied with the guidelines of the National Institutes of Health (NIH) and were approved by the Laboratory Animal Ethics Committee of Jinan University, China. Every effort was made to minimize the pain and number of animals used in the experiments.
This study adheres to internationally accepted standards for animal research, following the 3Rs principle. The ARRIVE guidelines were employed for reporting experiments involving live animals, promoting ethical research practices.
AVAILABILITY OF DATA AND MATERIALS
The data that support the findings of this study are available in Gene Expression Omnibus (GEO) at [http://www.ncbi.nlm.nih.gov/geo/] and EMBL-European Bioinformatics Institute at [https://www.ebi.ac.uk/]. These data were derived from the following resources available in the public domain:
1. Accession: PRJNA653629
[https://www.ebi.ac.uk/ena/browser/view/PRJNA653629]
2. Accession: PRJNA737414
[https://www.ncbi.nlm.nih.gov/geo/query/acc.cgi?acc=GSE178121]
3. Accession: PRJNA843960
[https://www.ncbi.nlm.nih.gov/sra/?term=SRR19450179]
4. Accession: E-MTAB-9061
[https://www.ebi.ac.uk/biostudies/arrayexpress/studies/E-MTAB-9061?query=E-MTAB-9061]
FUNDING
The funding by Guangdong Province Major Science and Technology Projects (Fund code: 3241704900), as well as the Scientific research project of the Guangdong Provincial Bureau of Traditional Chinese Medicine (Fund code: 20221112), is acknowledged.
ACKNOWLEDGEMENTS
Declared none.

