All published articles of this journal are available on ScienceDirect.

The Relationship between Corneal Biomechanics and Refractive Status
Abstract
Objective
This study aimed to determine the relationship between corneal biomechanical properties and refractive status.
Methods
The study included patients who underwent routine eye examination and were divided into 3 groups based on refractive status: hyperopia group (spherical equivalent >+0.50 diopters), myopia group (spherical equivalent <–0.50 diopters), and emmetropia group (spherical equivalent within ±0.50 diopters). Corneal biomechanical parameters (corneal hysteresis and corneal resistance factor) and intraocular pressure were measured via an ocular response analyzer (Reichert, Corp., Buffalo, NY). Corneal biomechanical properties were compared between the three groups. Pearson’s correlation analysis, one-way ANOVA, and multivariate analysis of covariance were used to evaluate the study data.
Results
Corneal hysteresis and age were significantly correlated in the hyperopia, myopia, and emmetropia groups based on Pearson’s correlation analysis (P<0.05). Corneal hysteresis and corneal resistance factor values were adjusted for the age variable. Mean corneal hysteresis was 11.34±0.40 mmHg, 11.35±0.34 mmHg, and 11.65±0.33 mmHg in the hyperopia, myopia, and emmetropia groups, respectively (P=0.021, one-way ANOVA). Mean corneal resistance factor was 11.05±0.35 mmHg, 10.85±0.30 mmHg, and 11.04±0.29mmHg in the hyperopia, myopia, and emmetropia groups, respectively (P=0.047, one-way ANOVA). Corneal hysteresis and corneal resistance factor were significantly correlated based on Pearson’s correlation analysis (P<0.001). Moreover, according to Pearson’s correlation analysis, there was no significant correlation between corneal hysteresis and spherical equivalent, but corneal resistance factor and spherical equivalent were significantly correlated (P=0.502 and P=0.001, respectively).
Conclusion
Myopes have lower corneal hysteresis and corneal resistance factor than hyperopes and emmetropes. Refractive status should always be a consideration when assessing corneal biomechanical properties.
1. INTRODUCTION
The outermost part of the eye is formed by the clear cornea anteriorly and the opaque white sclera posteriorly. This tough corneoscleral layer forms the integrity of the eyeball and protects the eye from environmental trauma. The rigidity coefficient of an eye is inversely correlated with ocular volume [1], and axial elongation with scleral remodeling has been reported in high myopia [2], all of which suggest that myopic eyes with longer than normal axial length may be less rigid than eyes with statistically normal axial length (23-25 mm).
Studies on the relationship between refractive status and the cornea show that myopia is associated with less corneal curvature, decreased corneal thickness, and decreased corneal endothelial cell density [3, 4]. The cornea’s biomechanical strength has been investigated in relation to the refractive status of the eye, and it has been reported that myopia occurs together with decreased corneal stiffness and corneal hysteresis [5-10]. On the other hand, some studies report that there is no significant association among refractive error, corneal hysteresis (CH), and the corneal resistance factor (CRF) [11, 12]. The inconsistency in findings may be due to differences in study populations (such as age and race) and possible confounding factors [such as age and intraocular pressure (IOP)].
Corneal biomechanical strength can be measured via the ocular response analyzer (Reichert, Corp., Buffalo, NY). The ocular response analyzer measures the corneal response to a rapid air pulse via an electro-optical detection system [13]. The applied air pulse first deforms the cornea into a concave shape, and then the air pressure is reduced, and the cornea returns to its original convex shape. The difference between two pressure values (P1: force-in; P2: force-out) at the applanated states of the cornea yields CH. CH is a direct and independent measure of corneal viscoelasticity [14]. CRF is another value derived via the ocular response analyzer. CRF is also indicative of the viscoelastic property of the cornea [14]. Two other parameters that can be obtained via the ocular response analyzer are Goldmann-correlated IOP (IOPg) and corneal-compensated IOP (IOPcc). IOPg is the mean of P1 and P2, and IOPcc is an empirically derived value indicative of IOP that is independent of corneal thickness and corneal biomechanical properties.
If corneal biomechanics are correlated with refractive error, CH and CRF could be used to screen refractive errors in early years of life. Therefore, the present study aimed to determine the relationship between corneal biomechanical properties (adjusted for age) and refractive status in healthy Caucasians.
2. MATERIALS AND METHODS
The medical records of consecutive patients who underwent routine eye examinations at the ophthalmology department were retrospectively reviewed. This cross-sectional research study was reviewed by an independent ethical review board and conformed to the ethical guidelines of the 1975 Declaration of Helsinki. According to the rules of the ethical review board, consent is not obtained from the patients in retrospective studies. Inclusion criteria were ocular response analyzer measurement at the time of examination, IOP ≤21 mmHg, and a waveform score ≥3.7 [15]. Exclusion criteria were a history of ocular disease, surgery, or trauma, contact lens use, and regular use of eye drops. The patients having systemic diseases that may cause refractive instability or decreased visual acuity, such as diabetes mellitus, connective tissue disorders, or endocrine disorders, and those who were pregnant, were excluded. All the patients underwent a full ophthalmological examination, including best-corrected visual acuity, slit lamp biomicroscopy, and dilated fundus examination. Objective refraction and keratometry measurements were obtained using a Topcon KR 8900 auto kerato-refractometer (Topcon Corporation, Tokyo, Japan), and corneal biomechanics and IOP were measured via an ocular response analyzer. Also, IOP measurement via air-puff tonometry (CT-80, Topcon, Japan) was included. Corneal biomechanical parameters were reported to be constant throughout the day in healthy eyes [16], and all eye examinations in this study were performed between 8 a.m. and 6 p.m. As all data in both eyes in each patient were normally correlated, only right-eye measurements were used for statistical analysis.
The patients were divided into three groups according to their spherical equivalent (SE) refraction, as follows: hyperopia group: SE > +0.50 diopters; myopia group: SE < –0.50 diopters; emmetropia group: SE within ±0.50 diopters [7, 17]. CH and CRF were compared between the three groups. The myopia group was further classified into three subgroups: mild myopia (-3.00 < SE < -0.50 D), moderate myopia (-6.00 ≤ SE ≤ -3.00 D), and high myopia (SE < -6.00 D). CH and CRF were compared between the 3 myopia subgroups.
2.1. Statistical Analysis
Statistical analysis was performed using IBM SPSS Statistics for Windows v.22.0 (IBM Corp., Armonk, NY). Descriptive statistical methods (frequency, percentage, and mean ± SD) and the Kolmogorov-Smirnov normality test were used to evaluate the study data. Categorical data were compared using the chi-square test. Pearson’s correlation analysis was used to assess the relationships among study parameters. One-way ANOVA was used to analyze differences in the parameters between groups, and Tamhane and Bonferroni post-hoc tests were used to determine pairwise differences. Multiple linear regression was performed to evaluate the effects of age, gender, SE, mean keratometry (Kmean), and IOP on CH and CRF. It was reported that CH negatively correlates with age [12, 18, 19]. In order to eliminate the effect of age on CH and CRF, CH and CRF values were adjusted for age using multivariate covariance analysis. The level of statistical significance was set at P < 0.05.
3. RESULTS
The hyperopia group included 95 patients (52 females and 43 males), the myopia group included 239 patients (121 females and 118 males), and the emmetropia group included 188 patients (108 females and 80 males), accounting for a total of 522 patients. There were no significant differences in gender distribution between the 3 groups (P = 0.367, Pearson’s chi-square test). Age, SE, Kmean, IOP, IOPg, IOPcc, CH, and CRF in the hyperopia, myopia, and emmetropia groups are shown in Table 1.
The mean age of the patients was significantly different between the 3 groups based on pairwise comparison using the Tamhane test (hyperopia vs. myopia: P < 0.001; hyperopia vs. emmetropia: P < 0.001; myopia vs. emmetropia: P = 0.054). Although there was a significant difference in Kmean between the 3 groups (P = 0.028, one-way ANOVA), there were no significant differences based on pairwise comparison (hyperopia vs. myopia: P = 0.063; hyperopia vs. emmetropia: P = 1.000; myopia vs. emmetropia: P = 0.108; Bonferroni test). There was a significant difference in IOPcc between the 3 groups based on one-way ANOVA (P = 0.009), whereas based on pairwise comparison, there was a significant difference only between the hyperopia and emmetropia groups (hyperopia vs. myopia: P = 0.258; hyperopia vs. emmetropia: P = 0.008; myopia vs. emmetropia: P = 0.230; Bonferroni test) (Fig. 1).
There was a significant negative correlation between CH and age in the hyperopia, myopia, and emmetropia groups (r = –0.275, P = 0.007; r = –0.234, P < 0.001; and r = –0.163, P = 0.025, respectively; Pearson’s correlation analysis). There was a significant negative correlation between CRF and age in the myopia group (Pearson’s correlation coefficient: r = –0.224, P < 0.001). Additionally, there was a negative (not significant) correlation between CRF and age in the hyperopia and emmetropia groups (r = –0.129, P = 0.214, and r = –0.111, P = 0.129, respectively; Pearson’s correlation analysis) (Fig. 2).
| Variables | Hyperopia Mean ± SD (CI) |
Myopia Mean ± SD (CI) |
Emmetropia Mean ± SD (CI) |
P |
|---|---|---|---|---|
| Age (years) | 51.42 ± 14.98 (48.37-54.39) | 34.89 ± 12.78 (33.15-36.48) | 37.78 ± 12.34 (35.90-40.99) | <0.001 |
| SE (D) | 1.75 ± 1.06 (1.55-2.01) | -2.48 ± 1.91 (-2.76—2.27) | -0.33 ± 0.32 (-0.08-0.01) | <0.001 |
| Kmean (D) | 42.92 ± 1.34 (42.65-43.21) | 43.32 ± 1.41 (43.14-43.48) | 43.03 ± 1.45 (42.84-43.24) | 0.028 |
| IOP (mmHg) | 17.39 ± 2.96 (16.77-17.96) | 17.38 ± 3.02 (19.97-17.89) | 17.26 ± 2.81 (16.74-17.74) | 0.888 |
| IOPg (mmHg) | 14.99 ± 3.39 (14.46-15.62) | 14.28 ± 3.30 (13.87-14.70) | 14.07 ± 3.25 (13.63-14.56) | 0.081 |
| IOPcc (mmHg) | 14.52 ± 2.99 (14.07-15.17) | 13.91 ± 2.95 13.58-14.31) |
13.40 ± 2.85 (12.98-13.78) | 0.009 |
| CH (mmHg) | 11.34 ± 1.63 (11.02-11.64) | 11.35 ± 1.55 (11.16-11.54) | 11.65 ± 1.63 (11.43-11.90) | 0.111 |
| CH (mmHg)* | 11.34 ± 0.40 (11.26-11.42) | 11.35 ± 0.34 (11.30-11.39) | 11.65 ± 0.33 (11.60-11.70) | 0.021 |
| CRF (mmHg) | 11.05 ± 1.91 (10.63-11.43) | 10.85 ± 1.83 (10.61-11.05) | 11.04 ± 1.90 (10.79-11.34) | 0.485 |
| CRF (mmHg)* | 11.05 ± 0.35 (10.98-11.12) | 10.85 ± 0.30 (10.81-10.88) | 11.04 ± 0.29 (11.00-11.08) | 0.047 |
Note: One-way ANOVA.
SE: Spherical equivalent, D: Diopter, Kmean: Mean keratometry, IOPg: Goldmann-correlated intraocular pressure, IOPcc: Corneal-compensated intraocular pressure, CH: Corneal hysteresis, CRF: Corneal resistance factor.
* Adjusted values for age.
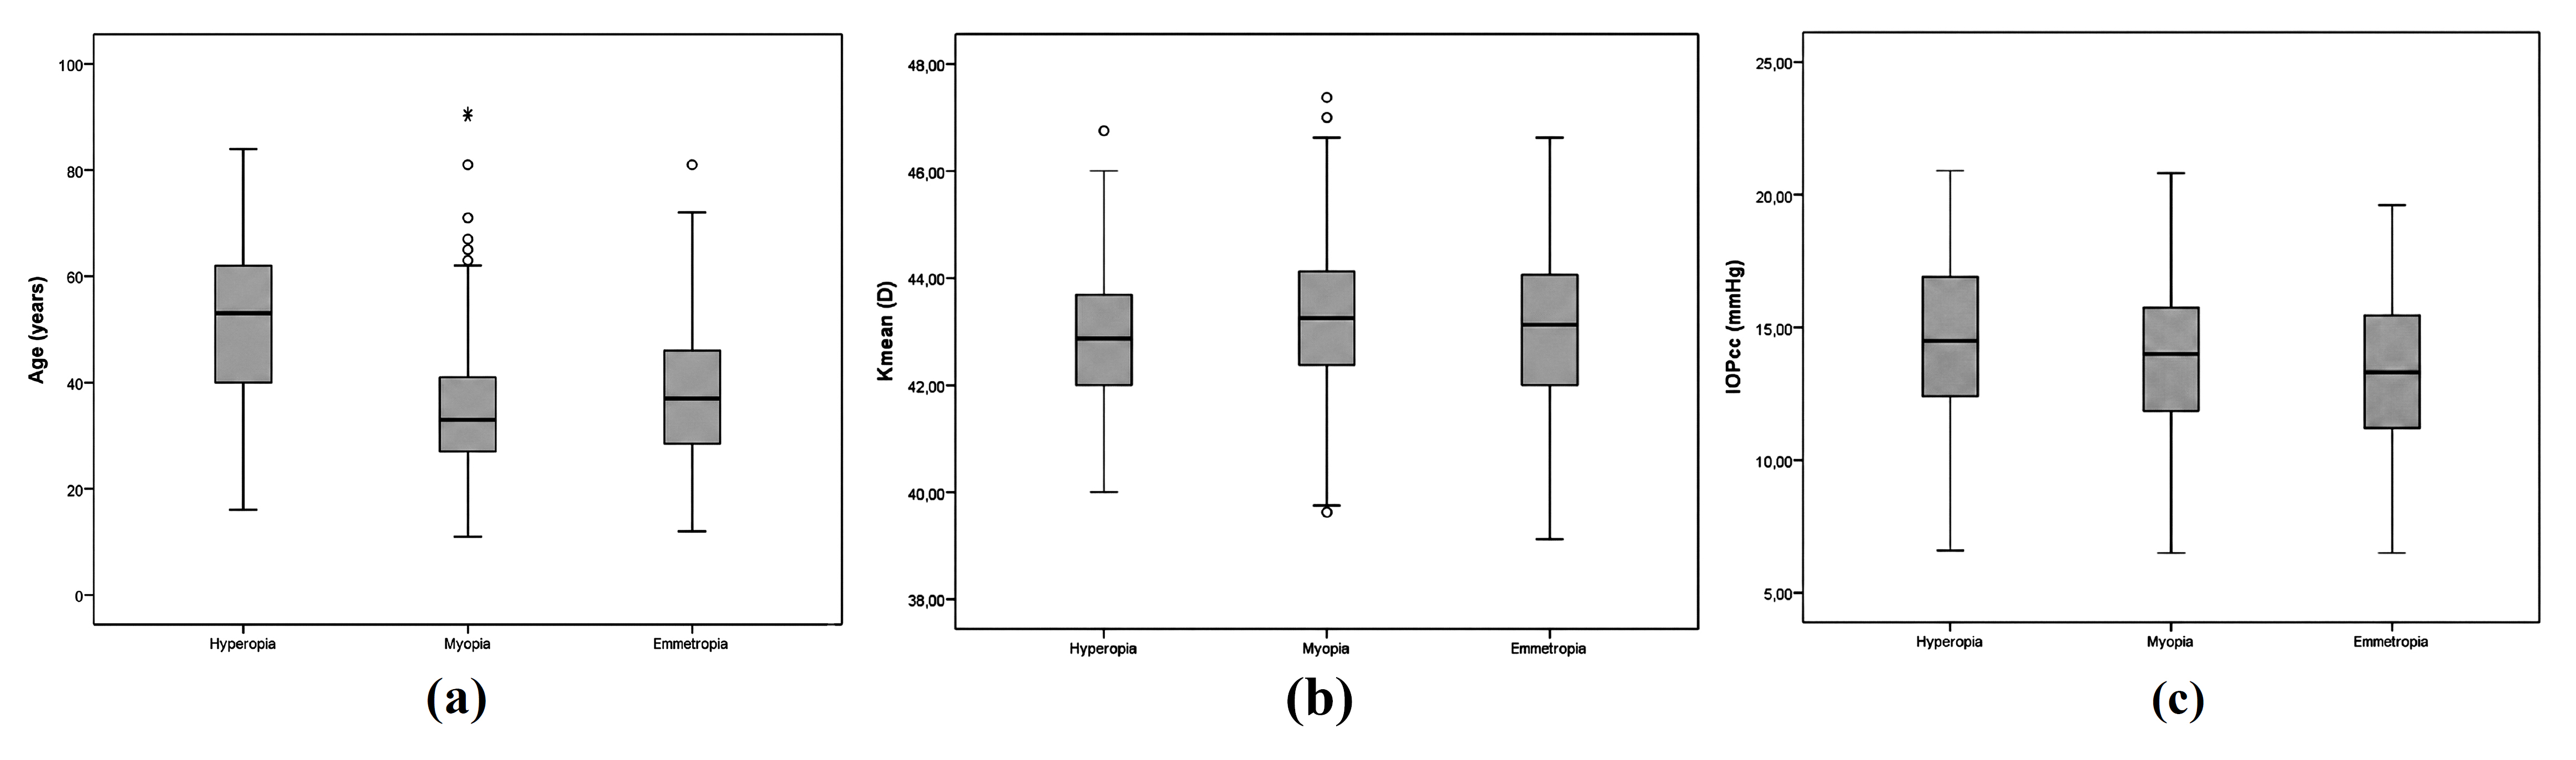
Age (a), mean keratometry (Kmean) (b), and corneal-compensated intraocular pressure (IOPcc) (c) in the hyperopia, myopia, and emmetropia groups.
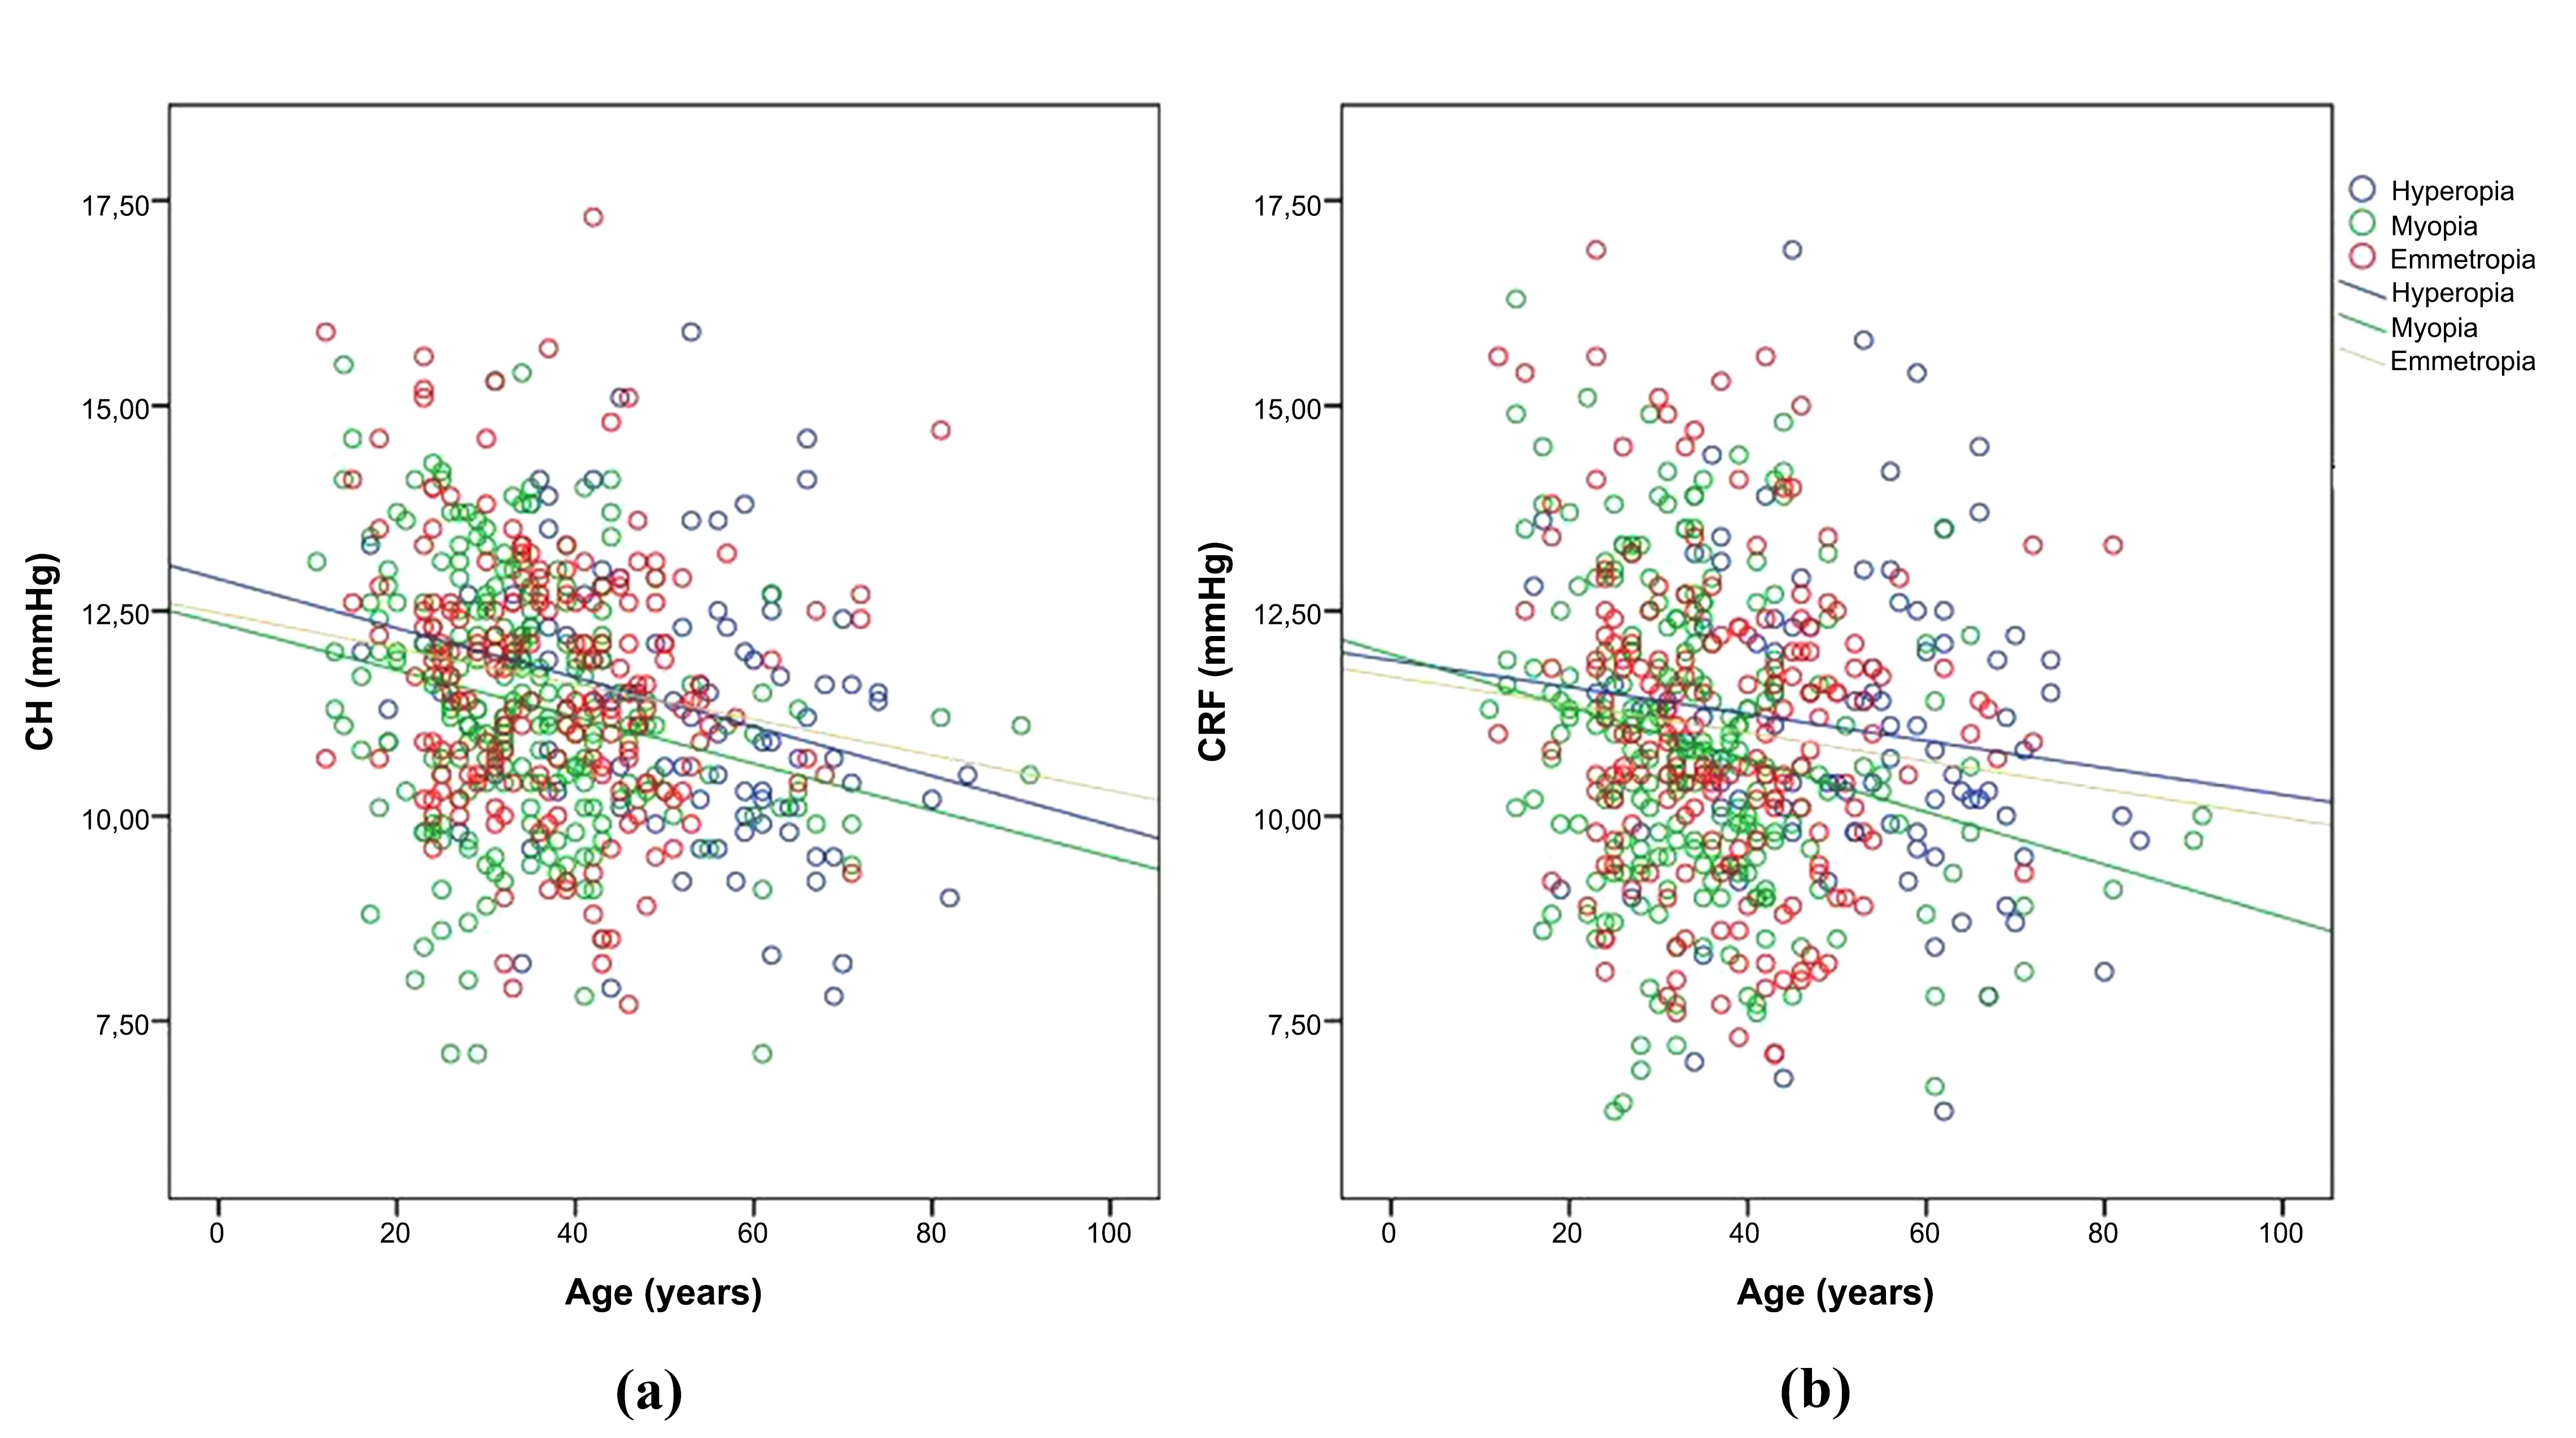
Correlations among age, corneal hysteresis (CH) (a), and corneal resistance factor (CRF) (b) in the hyperopia, myopia, and emmetropia groups.
Multiple linear regression analysis was performed to evaluate the effects of age, gender, SE, Kmean, and tonus on CH and CRF. The adjusted R2 was 0.29 and 0.61 for CH and CRF, respectively. According to regression analysis, the models were significant (F=53.87, p<0.001; F=403.37, p<0.001, respectively).
CH and CRF values were adjusted for the age variable, and comparisons were performed again with the corrected CH and CRF values. Mean CH was 11.34 ± 0.40 mmHg (95% CI: 11.26-11.42), 11.35 ± 0.34 mmHg (95% CI: 11.30-11.39), and 11.65 ± 0.33 mmHg (95% CI: 11.60-11.70) in the hyperopia, myopia, and emmetropia groups, respectively (P = 0.021, one-way ANOVA). Mean CRF was 11.05 ± 0.35 mmHg (95% CI: 10.98-11.12), 10.85 ± 0.30 mmHg (95% CI: 10.81-10.88), and 11.04 ± 0.29 mmHg (95% CI: 11.00-11.08) in the hyperopia, myopia, and emmetropia groups, respectively (P = 0.047, one-way ANOVA). There was a significant difference in CH between the myopia and emmetropia groups (P = 0.039, Bonferroni test), and there was a significant difference in CRF between the hyperopia and myopia groups (P = 0.051, Bonferroni test). Mean CH was 11.33 ± 0.435 mmHg (95% CI: 11.28-11.38), 11.40 ± 0.32 mmHg (95% CI: 11.32-11.48), and 11.40 ± 0.25 mmHg (95% CI: 11.23-11.57) in the mild, moderate, and high myopia subgroups, respectively (P = 0.345, one-way ANOVA). Mean CRF was 10.83 ± 0.31 mmHg (95% CI: 10.79-10.88), 10.89 ± 0.28 mmHg (95% CI: 10.82-10.97), and 10.89 ± 0.22 mmHg (95% CI: 10.75-11.04) in the mild, moderate, and high myopia subgroups, respectively (P = 0.345, one-way ANOVA).
CH and CRF were positively correlated (Pearson’s correlation coefficient: r = 0.955, P < 0.001). There was no significant correlation between CH and SE (Pearson’s correlation coefficient: r = 0.029, P = 0.502), but there was a significant correlation between CRF and SE (Pearson’s correlation coefficient: r = 0.142, P = 0.001) (Fig. 3). There was also no significant correlation between flat and steep keratometry readings and CH and CRF (Pearson correlation, P > 0.05).
4. DISCUSSION
Ocular rigidity is a measurable parameter indicative of the elastic properties of the outer shell of the eye [1, 20]. The first attempt to quantify ocular rigidity was performed by Friedenwald in 1937 [1], who reported that the rigidity coefficient of an eye is inversely correlated to ocular volume and that myopic eyes have greater ocular volume and are less rigid than normal eyes.
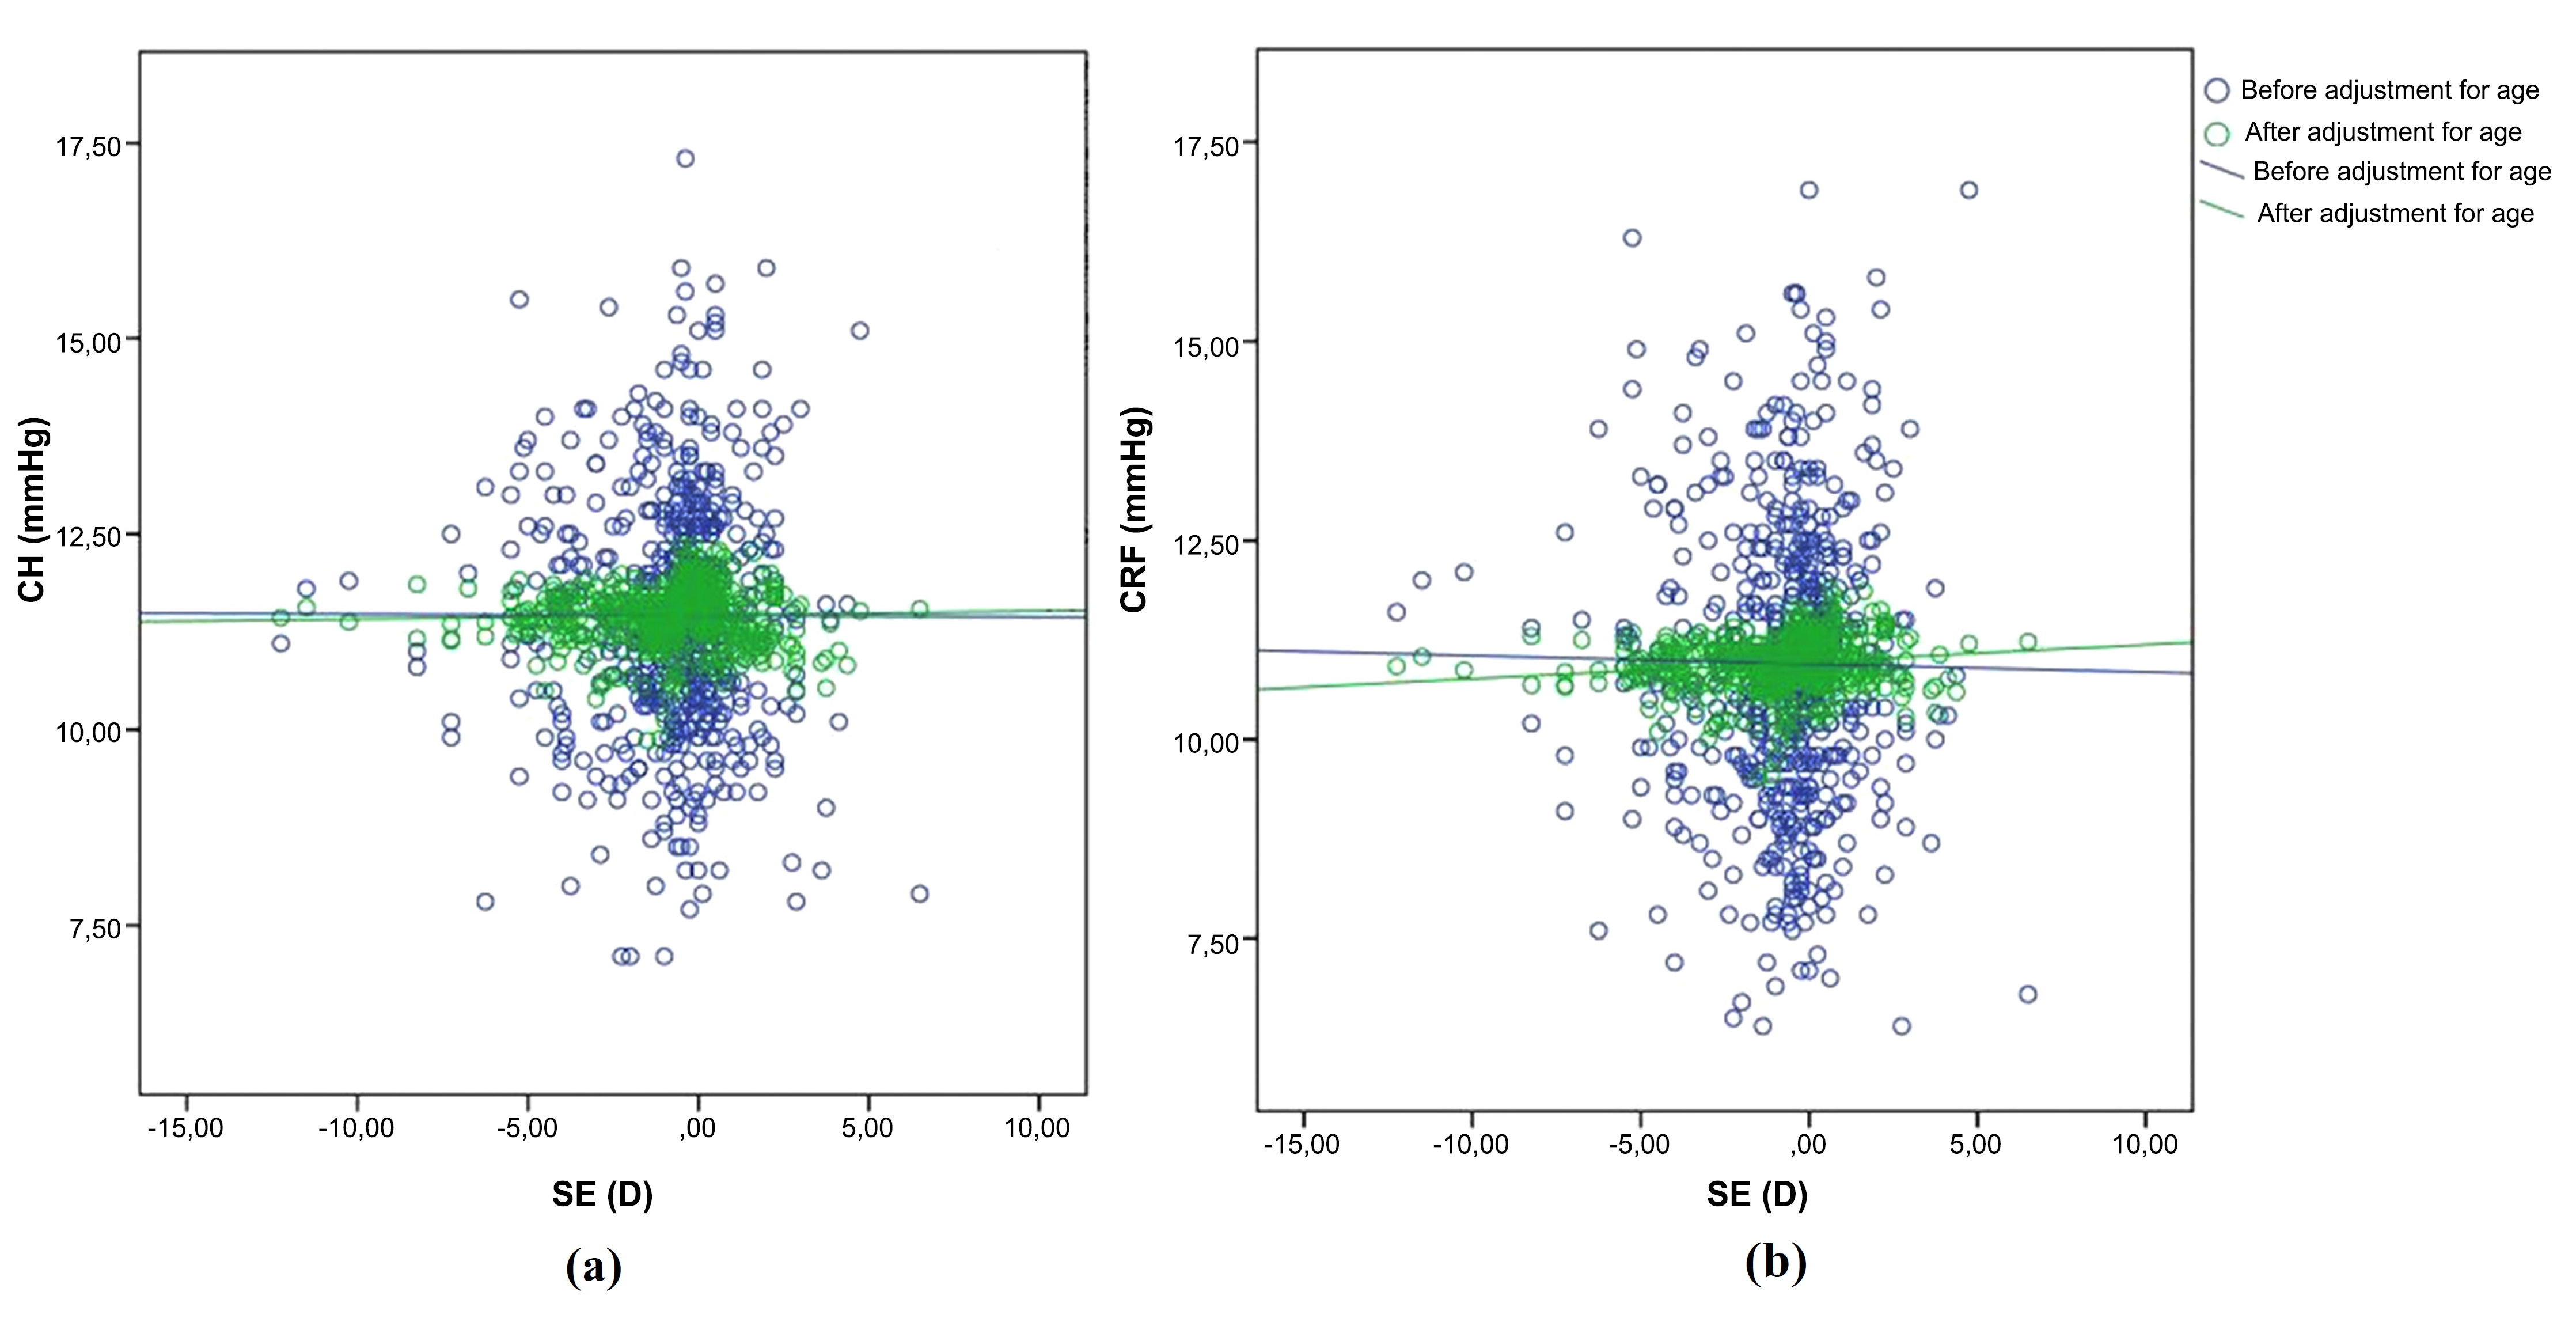
The correlation between spherical equivalent (SE) and corneal hysteresis (CH) (a) and corneal resistance factor (CRF) (b) before (blue) and after (green) adjustment of CH and CRF for age.
In myopia, scleral thickness, rigidity, and tensile strength are reduced, whereas scleral elasticity is increased [21-23]. The same embryologic origin of the sclera and corneal stroma might be why axial length increases and CH decreases in high myopia [7, 10, 24, 25]. Some studies have investigated the relationship between refractive error and corneal biomechanical properties [7-10, 17]. Shen et al. [8] observed that CH was significantly lower in high myopia patients (SE < –9.00 diopter) than in healthy controls with an SE of –3.00 to 0.00 diopter, but they did not note a correlation between CH and SE. Bueno-Gimeno et al. [25] investigated the association between refractive errors and corneal biomechanical parameters in 293 eyes in 293 healthy Spanish children, and observed significant differences in CH between their emmetropic group (SE between +0.75 and –0.25 diopters) and all myopic subgroups (low, moderate, and high), and between their high hyperopic subgroup (SE > +6.00 diopters) and all myopic subgroups (P < 0.05). Low CH values were associated with myopia, but they did not observe a significant correlation between CH and the magnitude of the refractive error. Xu et al. [26] reported lower CH in high myopic eyes than in the fellow eyes in anisometropic patients. The researchers suggested that the difference in CH in anisometropic myopes might be due to differences in corneal elasticity and collagen fibril arrangement. Consistent with the above-mentioned findings [7-10, 17, 25], in the present study, CH and CRF were lower in myopes than in hypermetropes and emmetropes (P = 0.021 and P = 0.047, respectively), and we also found a significant correlation between CRF and SE (Pearson’s correlation coefficient: r = 0.142, P = 0.001). However, there was no significant correlation between CH and SE (Pearson’s correlation coefficient: r = 0.029, P = 0.502).
Several studies have reported a decrease in CH and CRF with age [18-20, 27, 28]. With advancing age, non-enzymatic cross-linking increases in the cornea, leading to tissue stiffness [29]. Despite the increase in corneal stiffness, a gradual decrease in prostaglandins and glycosaminoglycans in the viscous ground substance of the cornea is thought to be the cause of decreased CH and CRF with age [27, 28]. Similarly, in the present study, there was a significant negative correlation between CH and age in the hyperopia, myopia, and emmetropia groups (r = –0.275, P = 0.007; r = –0.234, P < 0.001; and r = –0.163, P = 0.025, respectively; Pearson’s correlation analysis). There was also a significant negative correlation between CRF and age in the myopia group (Pearson’s correlation coefficient: r = –0.224, P < 0.001). Age distribution differed between the present study’s groups, which could have affected the results; as such, age was used as a covariate in multivariate covariance analysis, and additional statistical analyses were performed using age-adjusted corneal biomechanical parameters.
It was reported that IOPcc is significantly correlated with CH, but not with CRF [7, 22, 30]. Studies on living human eyes that followed Friedenwald’s study [1] also reported that ocular rigidity is positively correlated with IOP [31, 32]. In the present study, by eliminating the influence of corneal biomechanical properties through the computation of IOPcc, the IOPg values were changed to IOPcc values (Table 1). Although there was no significant difference in IOPg values between the three groups, there was a significant difference in IOPcc values (P = 0.081 and P = 0.009, respectively). Glaucoma is associated with low CH and CRF [33]. Moreover, it is known that even after a decrease in IOP, CH is lower in glaucomatous eyes than in healthy eyes [34], which indicates that low CH and CRF values in glaucoma patients cannot be solely attributed to high IOP. According to these earlier findings [33, 34], patients with glaucoma may have different cornea and sclera biomechanical properties, and it may not be correct to generalize the findings of glaucomatous eyes to healthy eyes; therefore, patients with IOPcc >21 mmHg were excluded from the present study, which was a major strength of this study.
Studies on the relationship between corneal biomechanical parameters and refractive errors have also analyzed axial length [7, 10, 11, 27, 35]. Song et al. [35] investigated the relationship between CH and axial length/refractive error in Chinese secondary school children in an effort to determine if CH can be used to screen pre-myopic children. They reported that lower CH was significantly associated with longer axial length. Lim et al. [11] investigated correlations between corneal biomechanical parameters and refractive error and biometry in Singaporean children. In contrast to earlier findings, they reported that CH and CRF were not associated with refractive error or axial length, attributing this finding to the brief loading-unloading cycle of ocular response analyzer measurement, which may contrast with the relatively slower remodeling process in myopia.
These earlier findings suggest that, as an anatomical parameter, axial length has a significant correlation with CH. Considering that the cornea and sclera share a common embryological origin [26], both axial length and corneal biomechanics are indicative of ocular biomechanical properties. According to Bueno-Gimeno et al. [25] and Song et al. [35], lower CH values represent a greater risk of axial elongation, which suggests that CH may be helpful for diagnosing patients at high risk for axial myopia. Nonetheless, it remains unclear if low CH is a consequence of increased axial length or a part of variation in ocular biomechanics. The present study did not analyze axial length, which is a limitation; as such, the correlation between axial length and corneal biomechanical properties was not evaluated. Due to the retrospective design of the study and the absence of axial length data in the available medical records, it could not be included in the analysis. If the present study had incorporated a concurrent evaluation of the relationship among corneal biomechanical strength, axial length, and refractive error, it might have provided a more definitive insight into whether diminished corneal biomechanical strength constitutes a consequence of increased axial length or serves as a contributing factor to its progression. Another limitation of the present study was the lack of evaluation of corneal thickness. As previously reported, CH and CRF are positively correlated with corneal thickness [22, 30]. CH and CRF and corneal thickness are related but are not measurements of the same physical parameter [36]. If corneal thickness data had been available in the present study and included in the analysis, it would have provided additional insight into the relationship between the physical properties of the eye and refractive errors.
CONCLUSION
In conclusion, the present finding that CH and CRF were lower in myopes than in hyperopes and emmetropes is consistent with previous reports [5, 6, 8, 28, 35]. If corneal biomechanics are correlated with refractive error, CH could be used to screen refractive errors in early years of life, but strong correlations between corneal biomechanical parameters and SE were not observed in the present study. Actually, CH or CRF may not be considered strong predictors of SE, because SE is indicative of the combined effect of corneal power, lens power, and axial length. This combined effect may have attenuated the relationship between SE and corneal biomechanics. Additional prospective studies should be conducted to determine the cause and effect of the correlations between corneal biomechanics and refractive status, in combination with other ocular parameters (such as axial length, lens thickness, and refractive power).
AUTHOR’S CONTRIBUTIONS
The author confirms sole responsibility for the following: study conception and design, material preparation, data collection, analysis, draft of the manuscript, and its approval.
LIST OF ABBREVIATIONS
| CH | = Corneal hysteresis |
| CRF | = Corneal resistance factor |
| IOP | = Intraocular pressure |
| IOPg | = Goldmann-correlated intraocular pressure |
| IOPcc | = Corneal-compensated intraocular pressure |
| SE | = Spherical equivalent |
| Kmean | = Mean keratometry |
ETHICS APPROVAL AND CONSENT TO PARTICIPATE
Ethical approval was obtained from the Institutional Review Board of Acibadem University, Istanbul, Turkey (IRB protocol no.: 2015-16/4).
HUMAN AND ANIMAL RIGHTS
All procedures performed in studies involving human participants were in accordance with the ethical standards of institutional and/or research committee, and with the 1975 Declaration of Helsinki, as revised in 2013.
CONSENT FOR PUBLICATION
According to the rules of the ethical review board, consent is not obtained from the patients in retrospective studies.
AVAILABILITY OF DATA AND MATERIALS
The data supporting the findings of the article are available in the Mendeley Data repository at https://doi.org/10.17632/6rxy66854k.1, reference number V1.
ACKNOWLEDGEMENTS
The author thanks C.A., Mimar Sinan Fine Arts University, Institute of Science and Technology, Department of Statistics, Istanbul, Turkey, for statistical analysis, and S.B.E., MSW, Ankara, Turkey, for language editing.

