All published articles of this journal are available on ScienceDirect.

Intraocular Pressure: Does it Measure Up?
Abstract
The relationship between intraocular pressure (IOP) and glaucoma is complex and not fully understood. We question the validity of several claims relating to the IOP-glaucoma relationship: (1) that 12 mm Hg is an important target in IOP control; (2) that IOP variability is an important risk factor for glaucoma progression; and (3) that every millimeter of mercury of IOP lowering reduces the risk of glaucoma progression by some specific percentage amount. Further, IOP is generally accepted to be an important – if not most important – risk factor for glaucoma development and progression. Using measures of treatment effect – absolute risk reduction, relative risk, and relative risk reduction – we compare the strength of IOP as a risk factor to the strength of a cardiac risk factor in cardiovascular disease.
INTRODUCTION
That intraocular pressure (IOP) is intricately linked with primary open-angle glaucoma (POAG) is well established. Yet, specific details of this relationship have been the subject of considerable debate over many years. The question of “does IOP measure up” can be explored in several ways. One approach considers our gaps in knowledge of IOP, due in part to our inability to measure true IOP continuously. The accuracy of even snapshot IOP measurements at various times of the day is limited by factors such as corneal thickness and elasticity. Advances in our ability to accurately measure IOP both in the office as well as over 24 hours will undoubtedly improve our understanding of the IOP-POAG relationship in future years. For now, a number of issues relating to IOP have been subject to varying interpretations. Several of these interpretations have been accepted by some as dogma. One of us (mrw) in an article titled, “The Myth of 21 mm Hg” questioned past IOP dogma and cautioned against drawing definitive conclusions from insufficient data [1]. We explore several issues of IOP for which conclusions have been made which we believe should be examined further.
Another approach in addressing this topic is to compare how IOP as a risk factor for POAG compares in its predictive ability with risk factors for other diseases for which we have robust data. Cardiovascular disease is one such disease for which there exists considerable data. Recently completed glaucoma clinical trials provide data to calculate treatment effect of IOP reduction which can be compared to treatment effect of a known risk factor in cardiovascular disease. We use both approaches to address the question of “does it measure up”.
IOP AND THE KNOWLEDGE GAP
There is much that we know about IOP. Virtually all cross-sectional, population-based studies of POAG have demonstrated that the prevalence of POAG increases with increasing IOP [2-6]. The logical inference from this data was that IOP is a risk factor for the development of glaucomatous optic nerve damage. Further, clinical experience strongly supported the inference that lowering IOP slows the progression of glaucomatous optic nerve damage. Both of these inferences have recently been proven through several large, prospective trials of subjects with elevated IOP who were either treated medically or observed without treatment [7, 8].
We also know that IOP fluctuates over the diurnal and nocturnal periods and that this fluctuation is influenced by factors such as body position [9, 10]. The IOP of a patient lying down can be at least 3 to 4 mm Hg higher than that of a patient who is sitting. Thus, many patients have higher IOPs at night when they are sleeping than during the day when they are sitting or standing.
Yet, the significance of this information, particularly as it relates to consequences for the individual patient, is not clearly understood. In part, this is due to a lack of tools to continuously monitor true IOP over an entire 24-hour period. Another problem is that we do not know which attribute of IOP—mean IOP, peak IOP, fluctuation or variability of IOP—is most important as a risk factor for glaucomatous progression. Some argue that keeping a patient’s average IOP as low as possible should be the primary treatment goal; some others believe it is most important to always stay below an arbitrary IOP target; still others believe that minimizing IOP fluctuations over 24 hours and between visits is most important.
It is clear that while the IOP-glaucoma relationship has become better understood over the past several decades, there remains much that is subject to debate. And while a number of myths relating to IOP have been debunked, others have taken its place. One such myth is that 12 mm Hg is an important target in IOP control, and has replaced 21 mm Hg as the critical target goal in glaucoma care.
This myth has been supported by a post-hoc analysis examining data from the Advanced Glaucoma Intervention Study (AGIS), a study which was designed to compare the relative merits of two sequences of interventions in glaucoma patients whose IOP was uncontrolled despite receiving maximum medical therapy [11]. Patients were assigned, via randomization, to undergo argon laser trabeculoplasty (ALT) or trabeculectomy first, followed by the alternative procedure if the first failed to sufficiently reduce the IOP, and then by a second trabeculectomy if both procedures failed.
The AGIS investigators, in addition to studying the initial question, performed several post-hoc analyses to address questions that the study was not initially designed to answer. In one such analysis, the investigators pooled all patients from both groups and examined the relationship between IOP and glaucoma progression over time. Of the four subgroups of patients with varying proportions of IOP measurements below 18 mm Hg, the group which showed no net progression on visual fields had IOPs of lower than 18 mm Hg on all visits (Fig. 1). This group also had an average IOP of 12.3 mm Hg. The other groups, which had IOPs below 18 mm Hg less frequently, had higher rates of progression, creating what appeared to be a dose response curve for IOP as a cause of glaucoma progression.
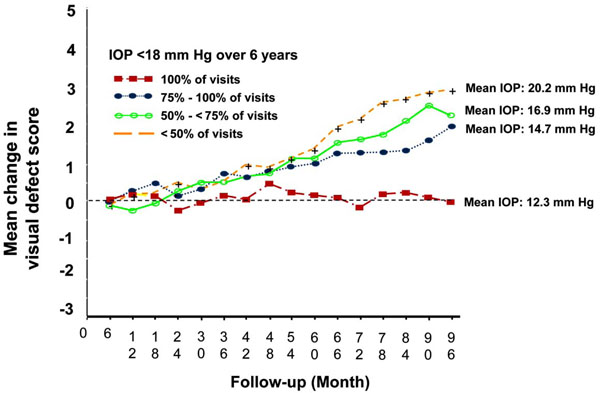
Associative analysis from advanced glaucoma intervention study.
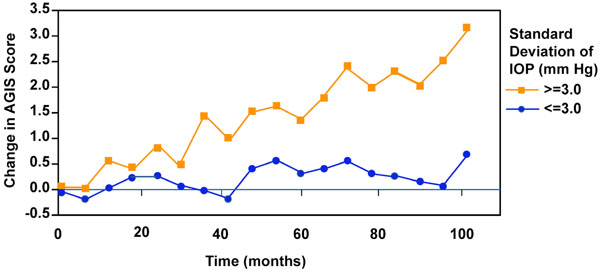
IOP variability and visual field progression from advanced glaucoma intervention study.
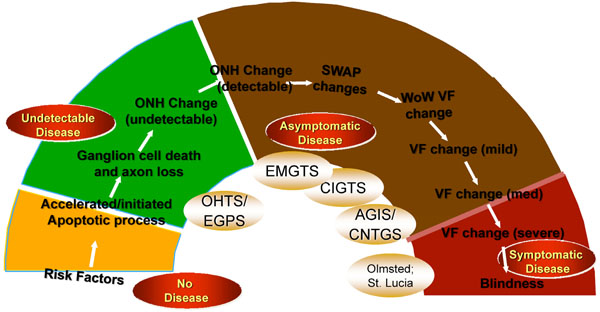
The Glaucoma Continuum showing disease states from “no disease” to “symptomatic disease”.
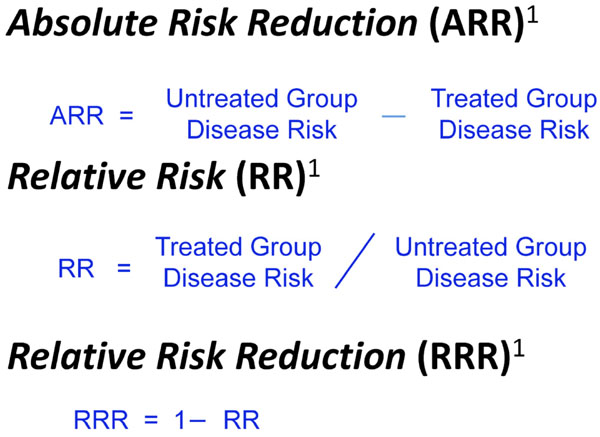
Different ways of expressing treatment effect.
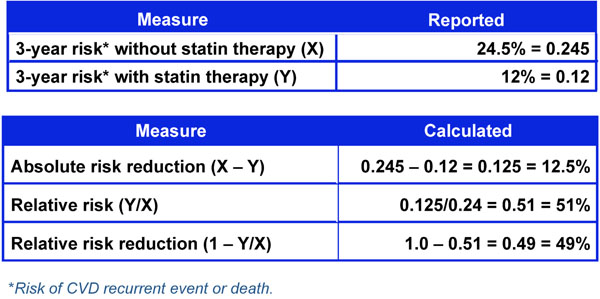
Three-year risk of cardiovascular event with and without statin therapy.
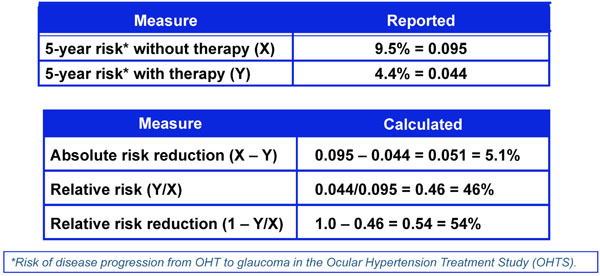
Five-year risk of developing glaucoma with and without therapy from the ocular hypertension treatment study.
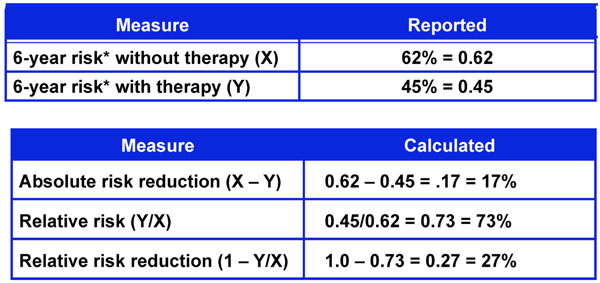
Six-year risk of glaucoma progression with and without therapy from the early manifest glaucoma trial.
However, one cannot make the assumption that patients in these four groups were comparable with regard to baseline characteristics in the same manner as would have occurred with randomization. While this post-hoc analysis did reveal that the subgroup of patients with IOPs lower than 18 mm Hg on all visits had an average IOP of 12.3 mm Hg and, on average, showed no visual field progression, this does not by any means suggest that all such patients were stable. Given the variability in visual field testing, all one can conclude is that this group demonstrated no progression on average. Some may have shown worsening on visual field scores while others improved. Most importantly, there is no convincing evidence from this, or any other analysis, that glaucoma progression can be completely halted in all patients if one achieves an IOP of 12 mm Hg or any other arbitrary target.
A later analysis from AGIS resulted in another potential myth, one pertaining to the importance of IOP variability between visits as a risk factor for glaucoma progression [12] (Fig. 2). According to these data, the risk of visual field loss was greater for patients whose IOP varied to a larger degree from the mean relative to those with steadier IOPs. However, AGIS was not designed to address this issue. Since treatment was advanced when IOP was higher, it is reasonable to expect greater IOP variability with more interventions as a result of more progressive disease. A subsequent analysis from the Early Manifest Glaucoma Trial (EMGT) did not include postprogression IOP values, which would be biased toward larger fluctuations because of more intensive therapy [13]. This study showed that the mean rather than variability of IOP correlated best with progression. A repeat analysis from AGIS was performed that adjusted for the flaw in the initial analysis of allowing for the use of both pre and post intervention data from multiple interventions [14]. In this reanalysis, IOP variation was an important independent risk factor for progression, but only in the subset of patients who had low IOPs during the course of the study. Such conflicting data underscores the fact that there is still much to learn about the relationship between IOP variability and glaucoma progression.
A third potential myth is the claim that every millimeter of mercury of IOP lowering reduces the risk of glaucoma progression by some specific percentage amount. This assertion is supported by data from the Early Manifest Glaucoma Trial (EMGT) which showed an estimated 11% higher risk of progression for every mm Hg higher IOP [8]. In the EMGT, patients were randomly assigned to treatment or no treatment for newly diagnosed glaucoma. The treated group experienced progression less frequently than the untreated group, but both groups were found to have significant rates of progression, presumably related to less than optimal IOP lowering. While there was a mean IOP lowering of approximately 25% in this study, there was no minimum required and treatment did not have to be advanced, for example, if IOP remained unchanged with therapy. In contrast to the EMGT findings, the Collaborative Initial Glaucoma Treatment Study (CIGTS) found that in patients with newly diagnosed glaucoma who were randomly assigned either to undergo surgery or to receive medical treatment first, the surgery-first group experienced a greater IOP reduction, by an average of 2 to 3 mm Hg, than the medicine-first group throughout the 5-year course of the study [15]. But after 5 years, no difference in visual field preservation was detected between the medicine and surgery first groups.
A plausible conclusion from these disparate results is that one sees diminishing returns with IOP lowering such that every millimeter of mercury of IOP lowering may not have equivalent weight across the IOP spectrum. In CIGTS, the average IOP reduction was more than 35% in both groups, a substantially greater amount than that found in EMGT. This suggests that the first few millimeters of mercury of reduction may result in a greater decrease in risk, perhaps 10% per millimeter of mercury, as suggested by EMGT, but once IOP has been lowered substantially, as in CIGTS, additional IOP lowering may be associated with less risk reduction.
IOP AS A RISK FACTOR
Notwithstanding the above examples, which highlight a number of unanswered questions regarding the relationship between IOP and POAG, IOP is considered to be an important risk factor for glaucoma. Because it is the only known risk factor amenable to modification, it can be argued that it is the most important risk factor for POAG. Recently, the epidemiology of POAG has been compared to the epidemiology of cardiovascular disease [16]. In this context, risk calculators using IOP as well as other risk factors have been developed in an effort to emulate the risk calculations used with cardiac risk factors for predicting a cardiac event. Implicit in such risk assessments has been a comparison of the strength of IOP as a risk factor relative to the strength of some of the modifiable cardiac risk factors.
Such a comparison must take into account the nature of the disease itself. As shown in Fig. (3), glaucoma comprises a continuum of disease states from undetectable disease, characterized by ganglion cell death and axonal loss, to asymptomatic disease in which optic nerve changes and early to mild visual field defects are noted, to symptomatic disease in which visual field loss is severe or total [17]. The time frame from the beginning of the continuum to the end is measured—in the vast majority of cases— in decades. Thus, all of the major glaucoma clinical trials that have examined the IOP-POAG relationship have necessarily focused on only a small segment of this continuum. The outcome of importance to the patient with POAG is symptomatic disease, particularly blindness, which is at the end of the continuum. Risk factors are typically associated with the beginning stages of the disease. Because of the long time frame and the lack of a study spanning the entire spectrum of POAG, the link between IOP as a risk factor and blindness is tenuous. In comparison, cardiac risk factors typically predict a single memorable event, an event that often results in death. The link between these risk factors and the cardiac event is extremely strong.
One way to assess the strength of a risk factor is to measure the effectiveness of treating to modify the risk factor. As noted in Fig. (4), treatment effect can be expressed in different ways including Absolute Risk Reduction (ARR), Relative Risk (RR), and Relative Risk Reduction (RRR) [18]. These measures of treatment effect can be calculated using the three year risk of a cardiovascular event with and without statin therapy (Fig. 5) [19]. The results can be compared to the five year risk of developing glaucoma with and without treatment in the Ocular Hypertension Treatment Study (Fig. 6) [7], and the six year risk of glaucoma progression with and without therapy in the Early Manifest Glaucoma Trial (Fig. 7) [8]. A direct comparison of the results is difficult because of the differing time lines used. However, it is clear that the greatest reduction in risk is with the statins in cardiovascular disease, followed closely by treatment of elevated IOP in early glaucoma. The risk reduction achieved with treatment of elevated IOP in ocular hypertension is sizable but is not to the same extent as in cardiovascular disease and early glaucoma.
CONCLUSION
Since 1622, when Rikchard Banister first noticed a connection between hard eyeballs and blindness, IOP and primary open-angle glaucoma has been inexorably linked. Yet, much still remains to be learned about the IOP-POAG relationship. Our knowledge would be advanced by an ability to more accurately and continuously measure IOP.
Over the past several years, there has been a growing interest in glaucoma risk assessment. Without dispute, IOP is a strong risk factor for glaucoma development and glaucoma progression. However, it is the only modifiable risk factor identified thus far. The value of glaucoma risk assessment would be greater if more modifiable risk factors were to be identified. Similarly, the value would be greater if a stronger connection between IOP and blindness could be established.

