All published articles of this journal are available on ScienceDirect.

Staging Glaucoma Patient: Why and How?
Abstract
Staging glaucomatous damage into appropriatecategories enhances management of the disease. Automated static perimetry is the benchmark for testing visual function in glaucoma. Numerous examples of standard automated perimetry staging systems have been proposed but difficulties such as lack of accuracy, absence of information related to location and depth of the defect(s) and need of time-consuming analysis of every visual field test result may reduce their day-to-day clinical usefulness.A new visual field staging system is proposed: the University of São Paulo Glaucoma Visual Field Staging System (USP-GVFSS). In this system, qualitative and quantitative characteristics of the visual field defect are described. The method is intuitive, comprehensible and describes severity, extension and hemi field involvement.
WHY STAGE GLAUCOMA PATIENT?
Staging glaucomatous damage into broad categories of damage such as, mild, moderate, and advanced enhances management. It promotes careful assessment and documentation of clinical damage, thereby facilitating monitoring for stability versus progression and provides a common language for both clinical and research purposes.
HOW TO STAGE GLAUCOMATOUS DAMAGE?
Glaucomatous damage can be quantified using either structural or functional loss criteria, or a combination of both. Patients with glaucoma may present with the disease before damage is detectable with standard achromatic automated perimetry (“pre-perimetric glaucoma”) or with clear glaucomatous visual field defect(s). In pre-perimetric glaucoma, clinicians may detect structural changes. However, manual systems based on clinical examination are subjective, relatively poorly reproducible, and require specific clinical experience.
Automated computerized devices analyze and quantify the optic nerve and RNFL thickness objectively with good reproducibility. These include scanning laser ophthalmoscopy, scanning laser polarimetry and optical coherence tomography; each may quantify and allow broad staging of structural damage. However these expensive and sophisticated technologies are evolving faster than clinical assessment of their utility.
Perimetric Glaucoma
Automated static perimetry is the benchmark for testing visual function in glaucoma; in the first evaluation it detects and quantifies damage, and in follow-up of a diagnosed patient, it detects stability or progression of loss. Patients with perimetric glaucoma may be staged on their visual field sensitivities as measured by standard automated perimetry (SAP) based on the number and depth of defective points, mean deviation (MD), or most recently, the visual field index. While these parameters are all Humphrey perimeter based, other perimeter manufacturers have software that offers similar information.
An ideal method to classify functional damage in glaucoma should be objective, reproducible, and user- friendly; it should supply useful information on the characteristics of visual field defects (shape, type, location and depth), it should provide a classification which is consistent with structural damage data, widely accepted and used, and able to monitor even relatively small changes in functional loss over time.
Numerous examples of SAP staging systems have been proposed [1-8].The most common criteria used by published researches to stage glaucoma, is that of Hodapp, Parish and Anderson (H-P-A) [3].
The H-P-A classification system is a clinically useful method that considers two criteria: the overall extent of damage using both MD value and the number of defective points in the Humphrey Statpac-2 pattern deviation probability map of the 24-2, SITA-STANDARD test. In addition the method takes into consideration, the proximity of defect(s) to fixation (Fig. 1).
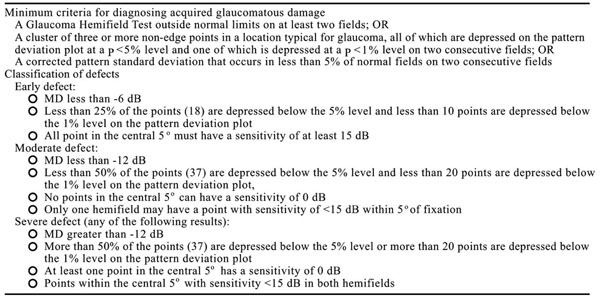
Hoddap –Parrish –Anderson criteria.

All visual field defects above are classified as severe by H-P-A classification (at least one point in the central 5 degrees has a sensitivity of 0 dB); however they have different aspects and probably different prognosis.

Staging system proposed by Mills et al. [8].
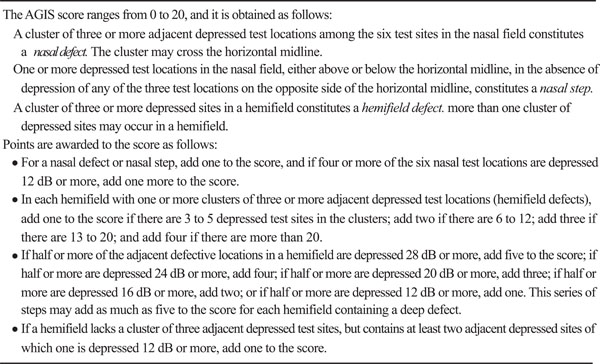
AGIS score.
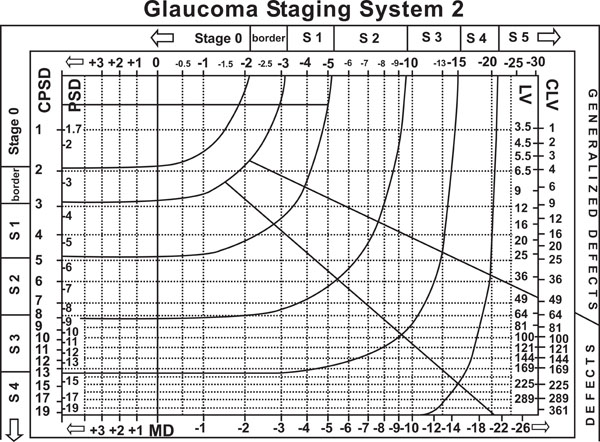
Brusini et al. glaucoma staging system [6].
Description of USP glaucomatous visual field staging system.
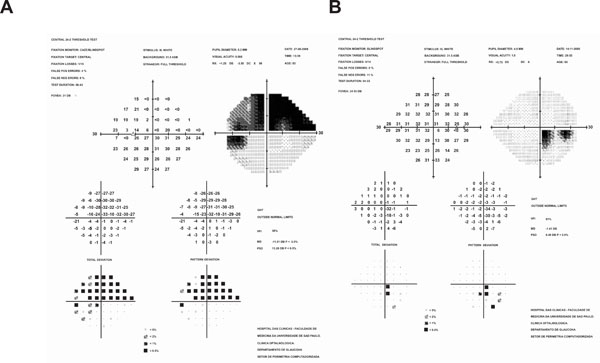
(A) Extensive visual field defect involving superior hemifield (B) Paracentral visual field defect. Both defects are classified as severe by Hoddap Parish and Anderson criteria (any point within central 5°with sensitivity less than or equal to 0 dB). Using USP System visual field A would be described as S59/ 5/2B and visual field B as E91/ 5/ 1A, providing clear differentiation between them.
Despite its popularity, this classification has some disadvantages: the visual field defect is characterized into four relatively coarse stages (Fig. 2); accurate and time-consuming analysis of every visual field test result is required, reducing its day-to-day clinical usefulness; there is no information about the location and depth of the defect(s); And finally, this system may suggest a significant deterioration when in fact none has occurred.
In 2006, Mills et al. proposed a new system [8], similar to H-P-A with six stages. (Fig. 3) The method is considered less friendly than H-P-A requiring an analytical and time – consuming assessment of several visual fields; this is even less helpful for day-to-day clinical use.
A more continuous staging system suggested by the Advanced Glaucoma Intervention Study (AGIS) [4], subdivided patients’ visual fields into 20 stages, in order to maximize the likelihood of detecting a patient who became worse (Fig. 4). As it requires a computer program to simplify the calculation of the score, this too is impractical for routine clinical use. The score is obtained from the total deviation plot of Humphrey Visual Field Statpac2. A point is considered defective when a minimal amount of sensitivity depression is reached.
Similar to the AGIS score, in the Collaborative Initial Glaucoma Treatment Study (CIGTS) visual field score, a weight was given based on minimum depth of the defect at any given point in addition to its two most defective neighboring points in the total deviation probability plot of the Humphrey 24-2 threshold test. The score obtained from the 52 points in the field are summed, divided by 10.4 and transformed in a numerical scale.
H-P-A, AGIS and CIGTS visual field staging systems are accurate for localized defects, but they fail to account for subtle diffuse sensitivity depression, which sometimes may be due to early glaucomatous damage.
Other methods such as Brusini’s Glaucoma Staging System are based on SAP Indices.6Brusini and co-workers used VF indices to obtain information not only related to the severity of the defects, but also about the type of damage. The method is useful to stage the damage severity, to separate the different components of VF loss (generalized, localized and mixed) and to monitor progression over time. The lines that separate the different stages were mathematically determined and the system is comparable with H-P-A and AGIS methods (Fig. 5).
One downside of this method is that it is strictly based on 2 global indices, and thus can be affected by artifacts and short-term fluctuation. In addition, it does not provide information about location, shape and morphology of visual field defects; therefore very different defects may be classified as similar.
A NEW GLAUCOMA VISUAL FIELD STAGING SYSTEM
The University of São Paulo Glaucoma Visual Field Staging System (USP-GVFSS) proposed by Susanna and Vessani [9] is a new system in which qualitative and quantitative characteristics of the visual field defect are described. The system is intuitive, comprehensible and describes severity, extension and hemi field involvement.
The definition of visual field defect(s) is the same as proposed by the H-P-A system which includes the glaucoma hemifield test outside normal limits or a cluster of three or more non-edge points in a typical location of glaucoma, all depressed on the pattern deviation plot at a p<5% level and one depressed at a p<1% level or a CPSD that occurs in less than 5% of normal visual fields.
The new system proposed includes the Visual Field Index (VFI), a new parameter recently introduced in the Humphrey Visual Field (Carl Zeiss Meditec Inc, Dublin, CA) [10].
The advantages of the VFI include: the replacement of MD (dB) value with % for a full visual field, reduction of cataract effects, comprehensible scale ranging from 100% to 0% (normal function to perimetric blindness), and a weighting procedure applied to reflect ganglion cell loss (central vs. peripheral VF loss based on the cortical magnification factor). The Pattern Deviation probability map is used to identify normal and abnormal points. Points <0 dB are considered to have 0% sensitivity. Normal points have100% sensitivity. The amount of loss is then calculated using total deviation numerical maps. Defect depth is recalculated into %.
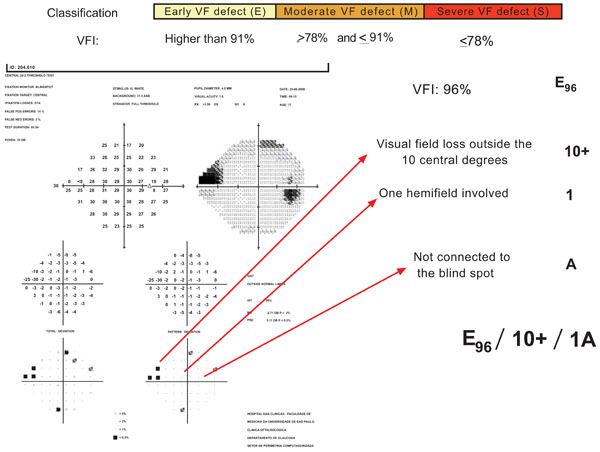
In USP GVFSS, VFI cut-off values are established for each stage. Location is considered in 3 categories: VF defect inside the 5 central degrees (5); VF defect inside the 10 central degrees but outside the 5 central degrees (10); VF defect outside the 10 central degrees (10+). One (1) versus both hemifield (2) involvement is included. The relationship to the blind spot is based on points depressed below 0.5% level on the pattern deviation plot and it is characterized as A, if the visual field defect is not connected with the blind spot, or B, if the visual field defect is connected with the blind spot. Fig. (6) presents an example of this classification describing the characteristics of one glaucomatous visual field defect.
There are several advantages of the USPGSS over the previous methods.
The USP- GVFSS is easier to apply and to memorize. It includes, in a very compact way, a modern visual field index plus information about location of the defect (closeness to the point of fixation and association with the physiological blind spot). This may have clinical relevance: defects that evolve both hemifields may have different prognosis than defects that are located in only one hemifield (Fig. 7).
Staging visual fields meaningfully is truly challenging for clinicians and researchers. Fine characterization of the glaucomatous visual field allows for the grouping of patients into subtypes and stages visual field loss. This may be important to establish the rate and the risk of progression of each subtype of glaucomatous visual field loss, which is crucial to optimize treatment.

