All published articles of this journal are available on ScienceDirect.

Evaluation of Spatial Anisotropy by Curvature Analysis of Elliptical Targets
Abstract
Spatial relationship perception (SRP), defined as the function able to detect the difference between the perceived extent of a shape along the x/y cardinal coordinates, has been investigated in 42 eyes of 21 emmetropic subjects by means of a psychophysical test conceived on purpose. Aiming to the highest sensibility and since curvature detection is reckoned as an hyperacuity, elliptical stimuli have been chosen to measure the spatial relationship anisotropy (SRA) in the visual system. Observers turned out to be able to detect curvature differences along the elliptical contour as low as 33.6 sec arc, which in terms of SRP means an aspect ratio (i.e. the ratio between the height and the width of the ellipse) as low as 1.0022-1.0035. By comparing these results with those obtained in previous investigations from other curvature discrimination tasks, it is argued that recognition threshold is conditioned by the amount of space anisotropy of the visual system. Indeed, in about half of the recruited subjects, vertical/horizontal anisotropy is found to a certain extent and such SRA correlates with the recognition threshold (r= 0.69, p<0.01). There is direct evidence of visual spatial distortion and in particular increased anisotropy in neuro-ophtalmological diseases such as hemianopia and around scotomatous regions in the visual field. Thence, apart from theoretical considerations in physiological field, results collected in this study may be regarded as normative data for future clinical investigations.
INTRODUCTION
It has been widely demonstrated that the analysis of curve contours is so accurate a process as to be considered a visual hyperacuity [1,2]. Visual hyperacuity is a function able to discriminate differences in the retinal position of less than 5 sec arc [3]. Typical examples are vernier resolution or the localization of the relative position of 3 aligned points (Alignment Task) [4-7]. This stands to reason considering that in the recognition of environmental objects, curvatures perception is as important as straight lines [8], so that many psychophysical studies have been focused on the discrimination of curvatures [1,2,4,5,7,9-15] and on the perception of circular and radial patterns [16-19].
In these experiments the observer was required to compare the target (i.e. an arc of predefined length and curvature) to a presented reference stimulus. With no reference stimulus displayed, the judgement and the correct recognition of an ellipse at very low eccentricity level or of a circle depend on the analysis of the contour of the shape per se: rather than a detection or discrimination task, it can be defined more properly as a recognition task.
In this perspective, the difference in the recognition threshold for vertical/horizontal ellipses reflects the amount of anisotropy related to the spatial relationship along the x/y axis (SRA). So, SRA gauges the imbalance of a peculiar function of the visual system, that we have called spatial relationship perception (SRP). SRP detects the difference between the perceived extent of a shape, as an ellipse, along the x/y coordinates so that isotropy occurs if the recognition threshold is the same irrespective of stimulus orientation. Otherwise, the amount of SRA depends on how much the specific x/y thresholds differ.
Vertical SRA takes place if the threshold for vertically-oriented stimuli turns out to be lower compared to the one referred to the horizontals. In such a condition a minimum-eccentricity horizontal ellipse is expected to appear as if it was “stretched” along the y-axis and/or “squeezed” along the other, being misperceived as a circle, and a circle is expected to be misperceived as a vertical ellipse. The opposite condition is regarded to as horizontal SRA.
In a previous experiment, Regan & Hamstra [20] found that a square or a circle can be judged as perfectly symmetrical with high accuracy. Even though the visual system is expected to be isotropic or quasi-isotropic, (i.e. the processing of an image along the x-axis should be as effective as along the y-axis), nonetheless there is indirect evidence that a mild vertical anisotropy does occur [21-23].
Since employing circular targets is not the only way to assess the anisotropy of the visual system, circles and ellipses seemed to us to be more suitable than other kinds of patterns as rectangular stimuli or perpendicular lines, inasmuch as judgements based on the angle of intersection between imaginary lines linking the opposite corners are thus avoided, as already argued by Regan and Hamstra [20]. Moreover, the choice of elliptical stimuli for investigating SRP and estimating SRA arises from the fact that curvature detection is reckoned as an hyperacuity.
So, the goal of the experiment is aimed to evaluate SRP and SRA in a sample of normal subjects by means of elliptical stimuli.
MATERIALS AND METHODOLOGY
Subjects
SRP has been estimated in 42 eyes of 21 emmetropic subjects (12 males and 9 females) of mean age 29,3 years (±11,6) recruited among the personnel of the hospital and their relatives. Exclusion criteria were BCVA < 60/60, eso/exotropy, poor convergence and general or ophthalmological diseases. Before starting the test, subjects were asked to read the previously prepared instructions.
Before starting the examination, the informed consent was obtained after explanation of nature and aim of the research.
All applicable institutional and governmental regulations concerning the ethical use of human volunteers were followed. The research obeys the tenets of the Declaration of Helsinki.
SRP thresholds and SRA of each subject were computed by means of a psychophysical test conceived on purpose in our Department and operating on a personal computer (Hp Compaq 1702) with a flat 15” liquid crystal screen (screen resolution of at least 1024 x 768 pixels).
Stimuli
Stimuli used in the test were ellipses and circles; the aim was to evaluate the discrimination threshold between them taking the ellipse eccentricity as a variable, while every other stimulus parameter (as size, contrast and luminance) was kept constant. The major axis of the ellipse was randomly oriented either vertically or horizontally.
Eccentricity is expressed as a percent “interaxis ratio” (IR):
IR (%) =100 [f(x) – f(y)]/f(mx,y)
where f(x) and f(y) are the values of the x- and y- focal axis and f(mx,y) is the higher value between them. Of course a circle has an IR of 0 (zero). Tested IR range varied from 34% to 1%; one percent point equals to a difference of 3.3 arc min between the two axes at the adopted viewing distance.
The stimulus was localized on the monitor so as to project its centre on the fovea. Mean target size subtended a visual angle of 300 arc min at a viewing distance of 50 cm when its vertical and horizontal axes had the same length (that is when the displayed target was a circle). As a matter of fact, according to Kramer & Fahle [15] flanking lines added on both sides to a curvilinear stimulus increase curvature detection threshold (provided their distance from the target is less that 10 min arc). Therefore, in order to avoid the rectilinear screen edge being used as a reference cue on the curvature judgement and affecting somehow the threshold outcome, the frame was covered by a dark cardboard mask, leaving a sinusoidal circumferential profile. Contrast condition of mask, screen and environment (a dimmed room) made the cardboard barely visible to the subject (Fig. 1).
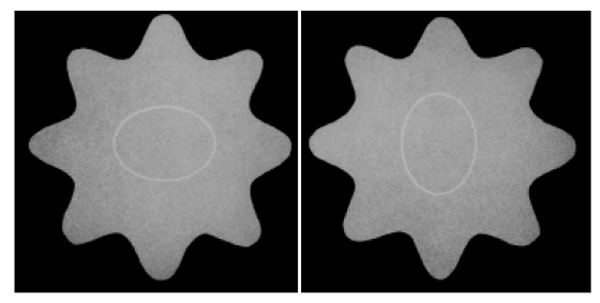
Example of the elliptical targets as displayed to the subject. IR: ± 26 % (in the experimental conditions the sinusoidal frame appeared scarcely visible).
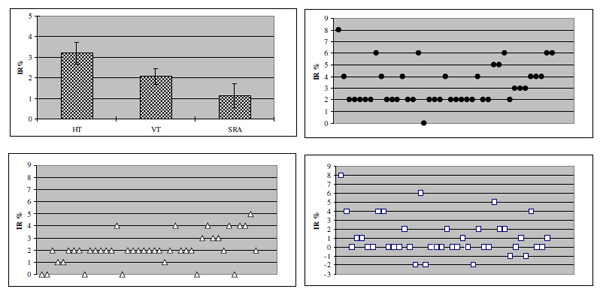
Recognition thresholds for elliptical patterns as found in the sample of normal subjects and distribution of individual thresholds. Top left: mean HT, VT and SRA (confidence interval: 95%). Top right and bottom: distribution of individual HT (filled circles), VT (triangles) and SRA (squares); X- axes represent individual data.
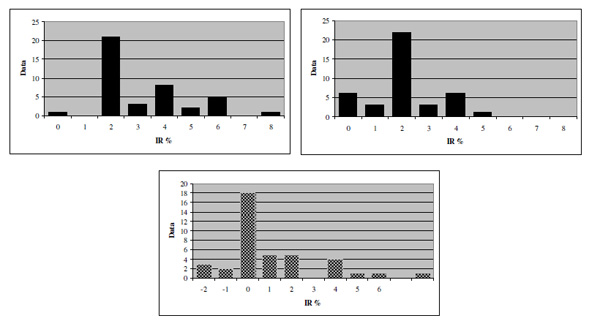
Frequency distributions of HT (top left), VT (top right) and SRA (bottom).
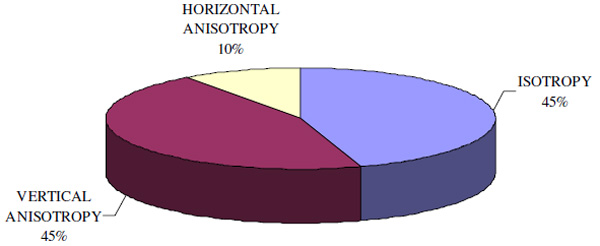
Isotropy and anisotropy distribution in the recruited population.
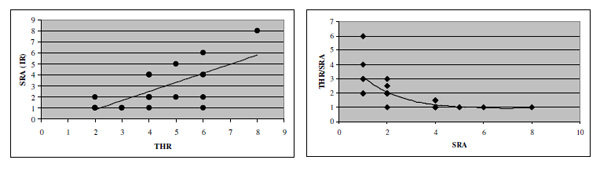
Correlation between recognition threshold and SRA (r = 0.69; p<0.01).
The target was white with luminance of 160 cd/m2 displayed on a grey background (luminance:40 cd/m2). The thickness of the contour line was 1.8 min arc. The illuminance of the dimmed room chosen for the exam was 0.15 lux.
Procedure
The experiment was performed during the late morning. Viewing was monocular and the order of the tested eye (left/right) was randomized. Before running the examination, a period of about 15 minutes was left so as to allow subjects to reach the best confidence with the environment and the operator, skilled in psychophysics, who was the same for all the trials. Moreover, each subject underwent a practice session in order to become acquainted with the experimental procedure.
The examination started with the onset of a white flickering point (34.2 min arc wide, 6.6 Hz, total duration:1000 msec) at the centre of the screen, aimed to stimulate the fixation. Immediately after the last winking, the target was displayed for 200 msec.
Time after time the observer was required to identify the displayed stimulus either as a circle or as an horizontal or vertical ellipse by pressing one of three different keys on the PC keyboard, according to a three alternative forced choice procedure (3AFC).
IR was modified according to a truncated staircase 4-2-1-derived algorithm [24], a psychophysical procedure which computes the actual IR stimulus value considering the last answer given by the subject. In this way, the IR of the elliptical stimulus was varied up and down in steps in order to find out the smaller IR value at which the subject is still able to recognize the ellipse as such, without mixing it up with a circle. The test started from displaying stimuli 36% IR in eccentricity, followed by a 4% decremental step every time a correct answer was given. After the first wrong answer the procedure was reversed by increasing the stimulus eccentricity by steps as large as 2%. After a second threshold crossing, the stimulus eccentricity was reduced again by steps of 1% adjustments. At the subsequent reversal, the last correct IR value was taken as the threshold. This technique matches the one employed in the conventional perimetric strategies for clinical practice. This way two staircase procedures which measured the horizontal and vertical thresholds independently have been carried out simultaneously.
Even though the orientation (vertical or horizontal) of the ellipses (plus 15 circles) was displayed in randomized order during the examination, the final threshold from the horizontal stimuli set was computed solely on the outcome from the horizontal ellipses, irrespective of the verticals and vice versa: in other words time after time the actual IR value to be displayed was computed separately both for the vertical and horizontal set. In this way two different recognition thresholds were obtained for ellipses oriented along the x- and y-axis (Horizontal Threshold [HT] and Vertical Threshold [VT]) and their difference reflects the amount of SRA. Conventionally in this study a positive SRA stands for vertical anisotropy.
Data Analysis
Double-tailed t-test for independent groups was performed, after verifying normality by means of Kolmogorov-Smirnov test (KS=0.29, 0.27, 0.25 for HT, VT and SRA respectively). Correlation analysis was performed by Pearson test. Significant level was set at p-value of 0.05. In the Results section, standard deviation is given after mean values in brackets.
RESULTS
Figs.(2, 3) show the SRP-related thresholds obtained in the recruited sample. Mean HT was 3.20 (±1.69), mean VT 2.07(±1.25) so that mean SRA turned out to be 1.13 (±2.19). Such values correspond to a difference between the major and minor axes of 12, 7.8 and 4.2 min arc, respectively.
In each subject, results obtained from one eye matched quite well those derived from the other. HT values ranged between 2.00 and 4.00 in 80.4% of the tested eyes, while in 75.6% VT turned out to be lower than 2.00: this finding suggests a certain degree of vertical anisotropy does occur in the majority of the recruited samples.
As shown in Fig.(4), VT and HT matched in 45% of the cases, therefore excluding SRA. In the remaining 55% thresholds along the x/y axis differed. Thus, in more than the half of the examined sample the visual system is not perfectly isotropic: a trend to vertical anisotropy was found in 82% of the eyes, while the remaining 12% was anisotropic along the horizontal.
However, apart from this descriptive approach, since the mean value and standard deviation of SRA are 1.13±2.19 and 95% confidence interval of the SRA values (defined as the mean SRA ± two SDs) is -3.25 : 5.51, it follows that in the recruited sample only 3 tested eyes have a statistically significant spatial relationship anisotropy1.
In each subject from the anisotropic subgroup, the higher value between VT and HT can be taken as the recognition threshold as a whole, irrespective of the stimuli orientation. Its mean value 4.27 (±1.61) is significantly higher compared to the threshold obtained in the isotropic sample (2.28 ±0.67) (p<0.01), therefore suggesting anisotropy to be linked to a global impairment of SRP.
Indeed a significant positive correlation has been found between the recognition threshold for each subject and SRA (r= 0.69, p<0.01) (Fig. 4). So, the higher recognition threshold, the higher SRA.
DISCUSSION
Based on our definition and methodological procedure, SRP as evaluated by means of elliptical/circular stimuli can be argued to follow a double-stage process. First, an high accuracy in curvature analysis is required. Second, the visual system is expected to be isotropic or scarcely anisotropic.
It is well known that visual system is highly sensitive to curvatures [1,2,5,6,12,14,15,22]. On the basis of previous studies, the cue for recognising curvature patterns seems to be related to the task: in particular, the parameter for low curvature detection has been advanced to be the orientation angle α between the chord and the tangent of the arc at its edge [12,15], while Watt & Andrews [1] and Watt [2] set the curvature itself, expressed as a slope change of the arc (in rad) divided by its length, as the cue for curvature discrimination, with optimal efficiency within an orientation range (i.e. the product of length x curvature) of less than 40 deg. Foster, Simmons and Cook [5] after comparing different parameters, argued that the sagitta (sag), that is the perpendicular between the arc at its middle point and its chord is the best predictor as a discriminatory cue for curved arcs. Sag represents the deviation from linearity of the curve. The same authors reckoned that the absolute threshold Δc0 for curvature detection expressed as sag was 11.4 arc sec for elliptical arcs2 whose chord length ranged from 12 to 48 arc min and that Δc increases together to the reference curvature c according to a linear function.
This result is altogether in agreement with Whitaker et al. [14] and Kramer and Fahle [15] who showed that curvature discrimination and detection worsen as the arc length increases, and with Watt & Andrews [1] and Watt [2] who found this is true just for arc length beyond 10 min. Below this cut-off a different, high-sensitive curvature system takes place.
Typically, such experiments involving curvature discrimination employ couples of arcs (a reference and a test one) whose chord is placed along the same x- or y-axis and the subject is required to judge their difference in curvature. After enlargement or compression along the x- and/or y-direction, the curvature of the stimuli covaries so that their ratio remains constant. It follows that under this experimental conditions Δc depends solely on c, according to a linear function as described by Foster, Simmons and Cook [5].
Elliptical and circular stimuli discrimination depends on the local comparison of curved portions of their contour [1]: in fact even though inferior temporal cortex has been reported to be sensitive to global (and complex) patterns such as faces [25-27], contour analysis remains the first step to be performed, so that it is unrealistic that large filters process the stimulus on the scale of the target as a whole, bypassing the integration of a more local analysis involving the curvature estimate of the arcs forming the pattern.
In particular we can assume an ellipse at its threshold level can be recognized as such if differences in curvature between its x- and y-oriented arcs can still be detected. Under this perspective, such a recognition task is a kind of discrimination task between perpendicularly-oriented couples of arcs. So, since the detection of an ellipse may be considered as a curvature discrimination task, curvature threshold Δc of arcs of curvature c of the same length (as evaluated in the same experimental condition) would predict the threshold detection for barely elliptical stimuli.
As far as we know, in the majority of the studies on the argument, curvature discrimination has been measured for arc lengths smaller than the length of each of the perpendicular arcs (2 placed along the x-axis + 2 placed along the y-axis) in which the contour of the elliptical stimuli displayed in this experiment can be split [1,2,5,14,28]. The only experiment which adopted stimulus lengths comparable to our target extension is the one by Kramer and Fahle [15]. Despite mean threshold values are not reported and others procedural differences, it can be argued from the visual inspection of Fig. (3a), (pag.1413) that for the longest stimuli used (267 arc min) threshold expressed as sag looks to be about 17 arc sec.
In our study threshold expressed as the minimum detectable difference in the sag between the x- and y-oriented arcs forming the contour of the stimulus is 33.6 arc sec. This value looks to be about three times higher than the one found by Foster et al. [5] (that is 11.4 arc sec) and double compared to that of Kramer and Fahle [15] (about 17 arc min), both of them referred to couples of arcs matched in orientation. Therefore, discrimination threshold between the two orthogonal arcs forming the contour of an ellipse cannot be predicted solely by the measurement of the curvature threshold obtained as if the same arcs were placed along the same x- or y- axis.
It has been reported that flanking lines can affect curvature discrimination: therefore, it can be argued that the recognition threshold of ellipses is higher than expected, due to the reciprocal interference of the arcs making the opposite sides of the stimulus contour. However, flankers affect the discrimination performance when their distance from the arc to be judged is smaller than 6-8 arc min [15], and especially for short stimuli, less than 30 arc min [1].
In our study the distance between the two sides of the contour of the figure along the x- or y-axis is manifestly greater than 30 arc min, measuring no less than 246 arc min for the more eccentric target, 299.4 arc min at the threshold level. Thus, it can be ruled out that the opposite sides of the contour affect the recognition threshold via a flanking effect.
Instead, a likely candidate responsible for this mismatch may be space anisotropy, so that we expect recognition threshold for elliptical targets to be affected by the amount of space anisotropy of the visual system under examination. As previously reported since the mid-century, visual patterns are processed with different precision along the x- and y- axis: in particular the visual system looks to be 18-24 times more sensitive to orthoaxial rather than coaxial displacements of the middle of three horizontally aligned dots [21-23].
Based on these assumptions, it is presumably clear that apart from correct performing curvature analysis, the recognition of an ellipse as such depends on the comparison between the spatial extension of the pattern along the x/y axis. The similarity in the aspect ratio thresholds obtained from ellipses and rectangles found by Regan & Hamstra [20] extends this hypothesis beyond the specific case of elliptical patterns.
In their study the aspect ratio discrimination threshold, that is the minimum ratio between height and width required for an ellipse to be discriminated from a circle, was measured in 4 normal subjects. Under this perspective, the aspect ratio threshold can be likened to the SRP threshold. The authors used a two temporal alternative forced-choice paradigm and subjects were required to discriminate between a reference stimulus and a test stimulus. According to this experimental procedure, an ellipse was mixed up with a circle for aspect ratio discrimination thresholds between 1.014 and 0.995.
Their values are in fair agreement with our results: the least detectable difference in the x/y axis extension of the pattern taken as mean aspect ratio equals to 1.0037.
Moreover, the same authors found the discrimination threshold to be lower when a circle is presented as the reference stimulus and increases as its aspect ratio moves away from the unity. Even though the amount of anisotropy was not directly reported, it can be deduced by the inspection of Fig. (5) (page 1852) that a slight difference in discrimination threshold resulted between the horizontal and vertical axis taking as a reference stimuli respectively horizontal and vertical ellipses. Indeed, in our study the recognition threshold expressed as aspect ratio was 1.0022 for vertical ellipses and 1.0035 for the horizontals.
According to Regan & Hamstra, in the visual pathway there are aspect ratio-sensitive neurons, functionally organized into two pools. One of the pools is sensitive to the vertical extent of a stimulus, while the other is to the horizontal one. In this way, SRA would be determined by the balance between the two pools. In other words, there are two variables in this function we have called SRP:
- First, the absolute level of sensitivity to spatial relationship: it depends on the activation of each pool per se.
- Second, the anisotropy amount and its direction: if the firing activity of the two pools agrees (i.e. their sensitivity level matches), then the visual system turns out to be isotropic, otherwise vertical or horizontal anisotropy occurs, depending on which of the two pools prevails. So, if the sensitivity of each of the two pools is high and their firing activity matches, it means that the visual system is isotropic and highly sensitive to spatial relationship. Under a theoretical point of view it is otherwise possible that isotropy is preserved, despite the sensibility of the two pools turns out to be low. Indeed we have found this pattern in a few eyes of our sample. In this case the ellipse recognition is expected to be impaired (and this impairment is irrespective of the orientation) but perfectly circular targets would be correctly identified.
Nevertheless, a link between anisotropy and spatial relationship sensibility is supported by their positive correlation as shown in Fig.(4, left),so that the more SRP worsens, the more it is imbalanced. In Fig. (4, right) SRA is plotted versus the ratio threshold/SRA. More specifically it can be seen that the relation is linear from thresholds above 4.0, while SRA and threshold look to be rather independent for thresholds lower than 4.0.
In conclusion, the present results confirm that even though a subject is able to recognize an ellipse with high accuracy, a certain value of spatial relationship anisotropy characterises the visual system of almost half of the investigated population. Under this perspective, further researches about the property of shape anisotropy and curvilinear stimuli should therefore confirm and better clarify the role ecologic factors could have in generating different SRP patterns among the normal population.
Apart from theoretical implications in normal subjects, visual spatial distortion and in particular increased anisotropy seems to occur in neuro-ophtalmological diseases such as hemianopia [29-32] and in developmental dyslexia [33-37].
Even though no direct evidence of spatial anisotropy has been provided in glaucoma and optic neuropathy, perceptual distortion of the visual space surrounding a scotoma has been described [38]. Indeed, fascicular scotomas are proper of glaucoma and often remain after remission of demyelinating optic neuritis. So, starting from this assumption and as a working hypothesis we retain it is worth investigating in the next future whether visual space anisotropy does occur even in such pathological conditions.
NOTES
1 We are grateful to an anonymous reviewer for this suggestion.
2 TUnlike circular arcs, for which a single curvature value based on sag and chord length can be assigned, for elliptical arcs the curvature is no longer constant along the contour. As reported by Foster et al [5], to label the elliptical arc with an unique value of c, curvature was defined as the c value of the circular arc with the same chord length and sag as the elliptical arc. This holds true until the difference from the best fitted circular arc is less than 3% of the sag.

