RESEARCH ARTICLE
Glycolysis in Patients with Age-Related Macular Degeneration
Kanako Yokosako 1, Tatsuya Mimura*, 1, Hideharu Funatsu 2, Hidetaka Noma 3, Mari Goto 1, Yuko Kamei 1, Aki Kondo 1, Masao Matsubara 1
Article Information
Identifiers and Pagination:
Year: 2014Volume: 8
First Page: 39
Last Page: 47
Publisher ID: TOOPHTJ-8-39
DOI: 10.2174/1874364101408010039
Article History:
Received Date: 11/4/2014Revision Received Date: 18/7/2014
Acceptance Date: 21/7/2014
Electronic publication date: 26/8/2014
Collection year: 2014

open-access license: This is an open access article licensed under the terms of the Creative Commons Attribution Non-Commercial License (http://creativecommons.org/licenses/by-nc/3.0/) which permits unrestricted, non-commercial use, distribution and reproduction in any medium, provided the work is properly cited.
Abstract
Purpose:
Retinal adenosine triphosphate is mainly produced via glycolysis, so inhibition of glycolysis may promote the onset and progression of age-related macular degeneration (AMD). When glycolysis is inhibited, pyruvate is metabolized by lactic acid fermentation instead of entering the mitochondrial tricarboxylic acid (TCA) cycle. We measured urinary pyruvate and lactate levels in patients with AMD.
Methods:
Eight patients with typical AMD (tAMD group) and 9 patients with polypoidal choroidal vasculopathy (PCV group) were enrolled. Urinary levels of pyruvate, lactate, α-hydroxybutyrate, and β-hydroxybutyrate were measured in all patients.
Results:
The mean urinary levels of pyruvate and lactate were 8.0 ± 2.8 and 7.5 ± 8.3 μg/mg creatinine (reference values: 0.5-6.6 and 0.0-1.6), respectively, with the mean increase over the reference value being 83.6 ± 51.1% and 426.5 ± 527.8%, respectively. In 12 patients (70.6%), the lactate/pyruvate ratio was above the reference range. Urinary levels of α-hydroxybutyrate and β-hydroxybutyrate were decreased by -31.9 ± 15.2% and -33.1 ± 17.5% compared with the mean reference values. There were no significant differences of any of these glycolysis metabolites between the tAMD and PCV groups. Multivariate analysis revealed that none of the variables tested, including patient background factors (age, hypertension, diabetes, hyperlipidemia, cerebrovascular disease, alcohol, smoking, visual acuity, and AMD phenotype), were significantly associated with the lactate/pyruvate ratio.
Conclusion:
A high lactate/pyruvate ratio is a well-known marker of mitochondrial impairment, and it indicates poor oxidative function in AMD. Our results suggest that increased lactate levels may be implicated in the pathogenesis of AMD.
INTRODUCTION
Glycolysis is a critical pathway for the generation of adenosine triphosphate (ATP), and involves the metabolism of both glucose and lactate, an indicator of oxidative capacity [1]. The glycolytic pathway produces pyruvate and lactate from glucose in all mammals [1]. Under aerobic conditions, pyruvate is converted to acetyl-CoA and CO2 in the mitochondria and oxidized via the tricarboxylic acid (TCA) cycle. However, pyruvate is converted to lactate by lactate dehydrogenase (LDH) under anaerobic conditions [2-4]. Thus, glycolysis leads to an increase of lactate production under hypoxic conditions, and higher lactate levels reflect tissue hypoxia. Hypoxic glycolysis is consistently associated with increased tissue levels of lactate and leads to various functional disorders [5-13].
Age-related macular degeneration (AMD) is a leading cause of visual impairment and is also the major cause of blindness in the elderly. However, there have been few reported investigation into the influence of the glycolytic pathway on the progression of AMD. In the normal retina of pigmented guinea pigs, lactate produced by glycolysis is transferred from retinal glial (Müller) cells to the photoreceptors, which then consume both lactate and glucose for oxidative metabolism [14]. Cultured human Müller cells mainly obtain ATP mainly from glycolysis in the presence of both glucose and oxygen, and show low oxygen consumption [15]. Inhibition of glycolysis is likely to be detrimental to retinal cells because more than 50% of retinal ATP is produced by the glycolytic pathway [15]. Although only a few in vitro studies on the role of the glycolytic pathway in the pathogenesis of AMD have been performed so far [16], the findings suggested to us that impaired glycolysis may lead to a reduction in energy metabolism of retinal cells in AMD.
Accordingly, we hypothesized that decreased pyruvate kinase activity in glycolysis would promote the development and progression of AMD. To investigate this possibility, we measured urinary levels of pyruvate and lactate in patients with AMD. We also compared the urinary pyruvate/lactate ratio between typical AMD (tAMD) and polypoidal choroidal vasculopathy (PCV).
MATERIALS AND METHODS
Study Design
This was a prospective, nonrandomized, cross-sectional, consecutive case series study conducted at the Tokyo Women's Medical University Medical Center East hospital and affiliated hospitals. This study was performed in accordance with the Helsinki Declaration. Our institutional review board approved the study and informed consent was obtained from each subject.
Subjects
The study population consisted of seventeen patients with AMD aged 75.5 ± 4.8 years (mean ± SD), with an age range of 66-84 years (Table 1). Seventeen patients with a clinical diagnosis of typical wet-type AMD, who presented to hospitals associated with Tokyo Women's Medical University Medical Center East, were enrolled and were divided into two groups. Eight patients with tAMD were assigned to the tAMD group and 9 patients with PCV formed the PCV group. There were no patients with retinal angiomatous proliferation (RAP) in this study.
Clinical profile of the subjects.
| Total | tAMD | PCV | P Value (tAMD vs PCV) | |
|---|---|---|---|---|
| Number of Patients | 17 | 8 | 9 | - |
| Age (years) | 75.5 ± 4.8 | 75.3 ± 3.2 | 75.7 ± 5.9 | *0.4328 |
| Gender (Female/ Male) | 6/11 | 1/7 | 5/4 | **0.0882 |
| Refraction (D) | 0.2 ± 1.6 | 0.9 ± 1.1 | -0.4 ± 1.8 | *0.0564 |
| LogMAR visual acuity | 0.6 ± 0.5 | 0.5 ± 0.2 | 0.7 ± 0.7 | *0.1479 |
| Systemic Diseases | ||||
| Hypertension | 7 (41.2%) | 3 (37.5%) | 4 (44.4%) | **0.5806 |
| Diabetes | 3 (17.6%) | 1 (12.5%) | 2 (22.2%) | **0.5471 |
| Hyperlipidemia | 1 (5.8%) | 0 (0.0%) | 1 (11.1%) | **0.5294 |
| Coronary heart disease | 0 (0.0%) | 0 (0.0%) | 0 (0.0%) | **NA |
| Renal disease | 0 (0.0%) | 0 (0.0%) | 0 (0.0%) | **NA |
| Liver disease | 0 (0.0%) | 0 (0.0%) | 0 (0.0%) | **NA |
| Cerebrovascular disease | 2(11.8%) | 1(11.8%) | 1(11.1%) | **0.7352 |
| Alcohol intake | 1 (5.8%) | 1 (12.5%) | 2 (22.2%) | **0.5471 |
| Smoking | 2(11.8%) | 2 (25.0%) | 2 (22.2%) | **0.6647 |
| Ocular Diseases | ||||
| Cataract/IOL/Clear lens | 11 /4 / 2 | 6 / 2 / 0 | 5 / 2 / 2 | **0.3607 |
| Glaucoma | 0 (0.0%) | 0 (0.0%) | 0 (0.0%) | **NA |
| Diabetic retinopathy | 0 (0.0%) | 0 (0.0%) | 0 (0.0%) | **NA |
IOL= Intraocular lens. NA=Not applicable. *Unpaired Student’s t-test. **Chi-square test of independence or Fisher’s exact probability test.
Comparison of urinary metabolites between tAMD and PCV groups.
| *Reference Range Female/Male (μg/mg Cr) | Total (N=17) | tAMD (N=8) | PCV (N=9) | P Value tAMD vs PCV | |
|---|---|---|---|---|---|
| Pyruvate | |||||
| Concentration (μg/mg Cr) | 0.6-6.6/0.5-5.9 | 8.0 ± 2.8 | 8.3 ± 3.1 | 7.7 ± 2.4 | **0.3502 |
| % Increase | - | 83.6 ± 51.1 | 93.4 ± 59.0 | 74.9 ± 41.0 | **0.2500 |
| Abnormal level | - | 11/17 (64.7%) | 5/8 (62.5%) | 6/9 (66.6%) | †0.6267 |
| Lactate | |||||
| Concentration (μg/mg Cr) | 0.0-1.6/0.0-1.6 | 7.5 ± 8.3 | 4.6 ± 5.4 | 10.1 ± 9.6 | **0.0960 |
| % Increase | - | 426.5 ± 527.8 | 244.2 ± 343.4 | 588.5 ± 604.7 | **0.0960 |
| Abnormal level | - | 12/17 (70.6%) | 5/8 (62.5%) | 7/9 (77.7%) | †0.4367 |
| α-Hydroxybutyrate | |||||
| Concentration (μg/mg Cr) | 0.2-2.8/0.2-2.8 | 0.6 ± 0.4 | 0.5 ± 0.4 | 0.7 ± 0.4 | **0.1233 |
| % Increase | - | -31.9 ± 15.2 | -36.7 ± 15.6 | -27.6 ± 13.5 | **0.1233 |
| Abnormal level | - | 0/17 (0.0%) | 0/8 (0.0%) | 0/9 (0.0%) | †NA |
| β-Hydroxybutyrate | |||||
| Concentration (μg/mg Cr) | 0.0-1.9/0.0-1.9 | 0.3 ± 0.3 | 0.3 ± 0.3 | 0.4 ± 0.3 | **0.3406 |
| % Increase | - | -33.1 ± 17.5 | -35.1 ± 17.6 | -31.3 ± 17.2 | **0.3406 |
| Abnormal level | - | 0/17 (0.0%) | 0/8 (0.0%) | 0/9 (0.0%) | †NA |
| Lactate/Pyruvate ratio | |||||
| Value | 0.1-0.2/0.1-0.2 | 0.9 ± 0.9 | 0.6 ± 0.7 | 1.2 ± 1.0 | **0.0955 |
| % Increase | - | 315.0 ± 369.9 | 250.8 ± 173.6 | 440.7 ± 411.1 | **0.0734 |
| Abnormal value | - | 12/17 (70.6%) | 5/8 (62.5%) | 7/9 (77.7%) | †0.4367 |
Cr = Creatinine. NA=Not applicable. % Increase means the percent increase relative to the mean + standard deviation. *Reference ranges are gender-specific. NA=not applicable.
** Unpaired Student’s t-test. †Chi-square test of independence or Fisher’s exact probability test.
Correlations between glycolysis metabolites.
| Pyruvate | Lactate | α-HB | β-HB | |||||
|---|---|---|---|---|---|---|---|---|
| r | P Value | r | P Value | r | P Value | r | P Value | |
| Pyruvate | 0.300 | 0.1208 | -0.025 | 0.5380 | 0.312 | 0.1118 | ||
| Lactate | 0.642 | 0.0027 | 0.627 | 0.0035 | ||||
| α-HB | 0.7175 | 0.0006 | ||||||
Correlation coefficients were calculated by Pearson’s product moment formula.
HB = hydroxybutyrate, r = correlation coefficient.
Correlations between the lactate/pyruvate ratio and patient characteristics with multivariate odds ratios and 95% confidence intervals.
| Variable | Correlation Coefficient | Multivariate Analysis | |||
|---|---|---|---|---|---|
| R | P Value | OR | (95% CI) | P Value | |
| Age (years) | 0.099 | 0.3532 | 0.995 | (-0.26 – 0.22) | 0.9613 |
| Hypertension | -0.192 | 0.7704 | 0.427 | (-2.57 – 0.68) | 0.2790 |
| Diabetes | -0.03 | 0.5408 | 0.597 | (-2.46 – 1.22) | 0.5512 |
| Hyperlipidemia | -0.013 | 0.5204 | 0.814 | (-3.86 – 3.06) | 0.8977 |
| Cerebrovascular disease | 0.150 | 0.2831 | 2.465 | (-2.02 – 3.51) | 0.4885 |
| Alcohol | -0.291 | 0.8711 | 0.558 | (-2.88 – 1.47) | 0.5669 |
| Smoking | -0.062 | 0.5928 | 0.743 | (-2.84 – 1.97) | 0.7905 |
| LogMAR visual acuity | 0.087 | 0.3705 | 0.741 | (-2.59 – 1.75) | 0.7662 |
| AMD type (tAMD=0/PCV=1) | 0.328 | 0.0995 | 2.320 | (-0.86 – 2.36) | 0.2794 |
R = Two-tailed Pearson’s correlation coefficients were calculated to assess associations between the Lactate/Pyruvate ratio and patient characteristics (N=17). OR = odds ratio. CI = confidence interval.
Exclusion criteria were (1) age ≤ 60 years, (2) high myopia greater than 5 diopters, (3) best-corrected visual acuity (BCVA) better than 0.20 logMAR (20/30) in the eye affected by AMD, (4) other vitreoretinal diseases (i.e., vitreomacular traction syndrome, epiretinal membrane, macular hole, diabetic retinopathy, and retinal vein occlusion), (5) amblyopia, (6) cataract > grade 3 according to the Emery-Little classification of nuclear hardness [17], and (7) Alzheimer disease or other dementias.
In each patient, the age, gender, medical history, and ocular history were assessed at the initial visit. A diagnosis of hypertension, coronary artery disease, or diabetes was based on data from the medical records. Hypertension was defined as current antihypertensive therapy or a blood pressure > 140/90 mmHg. The diagnosis of diabetes was based on information from the subjects or on use of antidiabetic medications.
The background characteristics of the study population are presented in Table 1. Among the 17 patients, 7 patients (41.2%) had hypertension, 3 patients (17.6%) had diabetes, 1 patient (5.8%) had hyperlipidemia, and 2 patients (11.8%) had a history of cerebrovascular disease. None of the patients had coronary heart disease, renal disease, or liver disease. With respect to ocular diseases, there was none of the patients had glaucoma or diabetic retinopathy. There were no significant differences of patient demographic or disease characteristics between the tAMD and PCV groups (Table 1).
Analysis of Urinary Metabolites
Measurement of urinary metabolites was performed with gas chromatography/mass spectrometry (GC/MS) by US BioTek Laboratories (Seattle, WA) according to the company's published method [18]. The subjects were not allowed to eat or drink on the morning of the test day. Subjects were also not allowed to take any medications or supplements before urine collection. Urine samples were collected in disposable paper cups, after voiding the first urine of the day and a special urine collection strip (Dip 'N Dry; US BioTek, Seattle, WA, USA) was dipped into each urine sample. The strips were packed and sealed in an aluminum foil bag containing desiccant gel, stored under dry conditions at room temperature, and then shipped to US BioTek Laboratories. According to US BioTek Protocol, 4 organic acids in the urine samples (benzoate, lactate, α-hydroxybutyrate, and β-hydroxybutyrate) were measured by GC/MS. Creatinine was also measured and urinary acid levels were normalized by the creatinine level. Persons involved in these analyses were blinded to patient data.
Statistical Analysis
The unpaired Student’s t-test was used to compare mean values between the two groups and the chi-square test was employed to compare percentages. Correlation coefficients were calculated by Pearson’s correlation analysis. Factors associated with the lactate/pyruvate ratio were investigated by multivariate logistic regression analysis, with the explanatory variables including various patient characteristics. Variables were selected in a stepwise fashion according to their significance for discrimination between groups. The level of significance was set at p < 0.05 for all analyses. Statistical analysis was performed with SAS System 9.1 software (SAS Institute Inc., Cary, North Carolina, USA).
RESULTS
The mean urinary pyruvate concentration and the mean percent increase of pyruvate (calculated relative to the mean + standard deviation) were 8.0 ± 2.8 (μg/mg creatinine) and 83.6 ± 51.1 (%), respectively. In 11 patients (64.7%), the urinary pyruvate level was above the reference value (Table 2, Fig. 1). The mean urinary concentration and mean percent increase of lactate were 7.5 ± 8.3 and 426.5 ± 527.8%, respectively, and 12 patients (70.6%) showed an increase of lactate above the reference value (Table 2, Fig. 2).
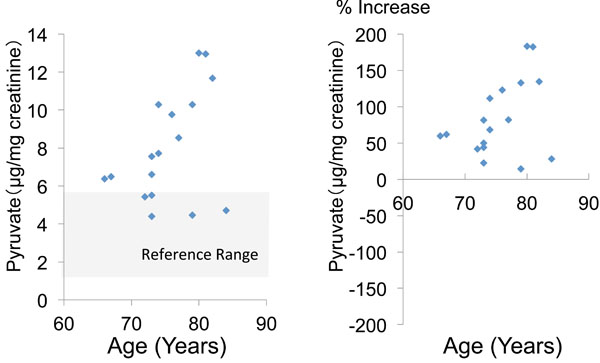 |
Fig. (1). Urinary pyruvate concentration and percent increase of pyruvate relative to the mean reference value. |
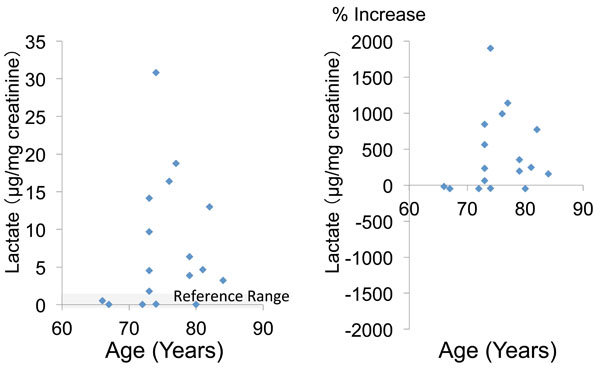 |
Fig. (2). Urinary lactate concentration and percent increase of lactate relative to the mean reference value. |
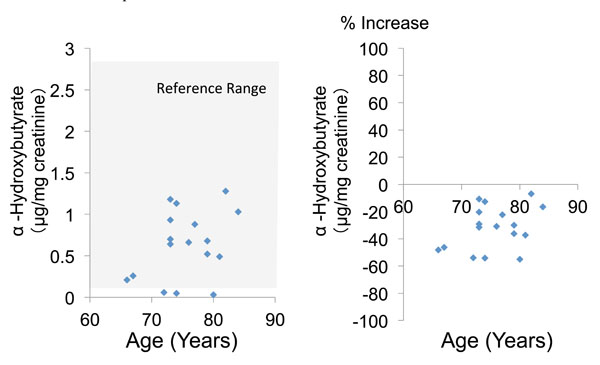 |
Fig. (3). Urinary α-hydroxybutyrate concentration and percent increase of α-hydroxybutyrate relative to the mean reference value. |
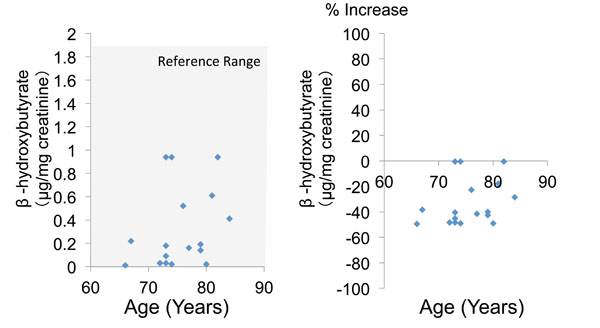 |
Fig. (4). Urinary α-hydroxybutyrate concentration and percent increase of β-hydroxybutyrate relative to the mean reference value. |
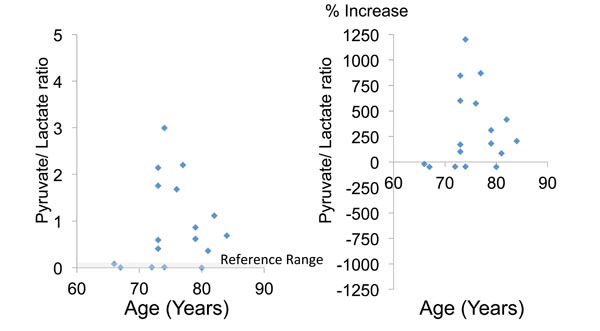 |
Fig. (5). The lactate/pyruvate ratio (a marker of mitochondrial impairment) and the percent increase of this ratio relative to the mean reference value. |
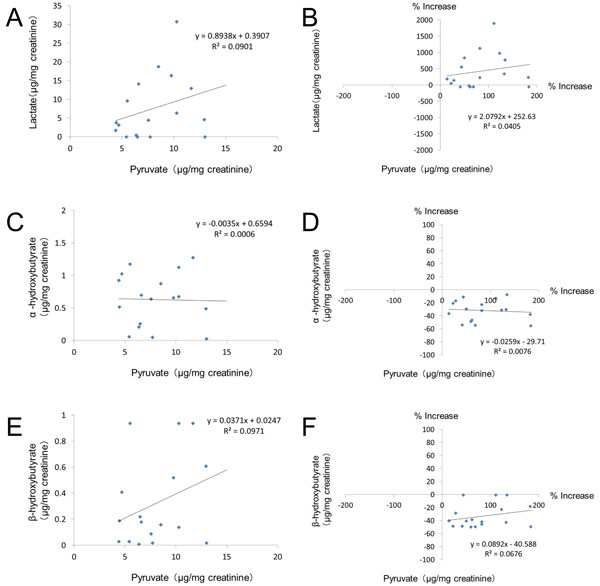 |
Fig. (6). Correlations between the urinary level of pyruvate and other glycolysis metabolites. |
The mean urinary concentration and percent increase of α-hydroxybutyrate were 0.6 ± 0.4 and -31.9 ± 15.2%, respectively (Table 2, Fig. 3). Finally, the mean urinary concentration and percent increase of β-hydroxybutyrate were 0.3 ± 0.3 and -33.1 ± 17.5%, respectively (Table 2, Fig. 4). Both α-hydroxybutyrate and β-hydroxybutyrate were within their reference ranges.
The mean lactate/pyruvate ratio was 0.9 ± 0.9, and 12 patients (70.6%) had a ratio above the reference range (Table 2, Fig. 5). There were no significant differences of these glycolysis metabolites and parameters between the tAMD and PCV groups (Table 2).
Table 3 shows the correlations between the various urinary glycolysis metabolites, while Fig. (6) shows the correlations of the urinary levels of lactate, α-hydroxybutyrate, and β-hydroxybutyrate with pyruvate. There was no significant correlation between pyruvate and any of the other glycolysis metabolites (Table 3). On the other hand, the urinary lactate level was significantly correlated with the level of α-hydroxybutyrate (r=0.642, p=0.0027) and also with that of β-hydroxybutyrate (r=0.627, p=0.0035) according to Pearson’s correlation analysis (Table 3).
When the influence of patient characteristics on the lactate/pyruvate ratio was investigated, the strongest correlation was found with the type of AMD (r=0.328), although it was not significant (p=0.0995, Table 4). Multivariate logistic regression analysis demonstrated that none of the clinical parameters tested were associated with the lactate/pyruvate ratio (Table 4).
DISCUSSION
This prospective study showed that urinary pyruvate and lactate levels were increased in the majority of patients with AMD, and the urinary lactate/pyruvate ratio was also elevated. These findings suggest that decreased pyruvate kinase activity in the process of glycolysis, which may inhibit ATP production, may be associated with the pathogenesis of AMD.
Urinary metabolic profiling using GC/MS has the ability to provide considerable information on the variations of metabolites in human body fluids [19]. The blood metabolic profile may not be specific to a particular disease because it is affected by metabolism in various organ systems [19]. Additionally, measurement of metabolites by GC/MS using the US BioTek system is only for urine samples, so we investigated urinary metabolites in the present study.
We found that pyruvate and lactate levels were increased by 83.6% and 426.5% compared with their mean reference values in our 17 patients with AMD. The increase of urinary pyruvate was probably associated with increased glucose uptake in these patients. On the other hand, urinary α-hydroxybutyrate and β-hydroxybutyrate levels were decreased by 31.9% and 33.1%, respectively. LDH catalyzes the conversion of lactate to pyruvate with simultaneous reduction and oxidation of nicotinamide adenine dinucleotide (NAD+) to form reduced NAD (NADH) [20, 21]. In the presence of oxygen, cells convert glucose to pyruvate and then generate ATP from its oxidation after pyruvate is transported into the mitochondria and converted to acetyl coenzyme A (acetyl CoA). Subsequently, pyruvate is metabolized via the tricarboxylic acid (TCA) cycle. Mitochondrial NADH and flavine adenine dinucleotide (FADH2) provide energy for ATP production through the process of oxidative phosphorylation via the electron transport chain [22, 23]. Under anaerobic conditions, however, pyruvate is converted to lactate by LDH [22, 23], and it is not utilized in the TCA cycle after conversion. Our finding that the percent increase of lactate (426.5%) was 5-fold greater than that the percent increase of pyruvate (83.6%) suggests that glycolysis was shifted toward the production of lactate. Additionally, the lactate/pyruvate ratio was increase by 315.0% compared with the mean reference value. These results suggest that the transition from glycolytic to mitochondrial metabolism is impaired in patients with AMD. The lower urinary levels of α-hydroxybutyrate and β-hydroxybutyrate also support the interpretation that the TCA cycle was inhibited by impairment of the last energy-generating step in the process of glycolysis.
The pyruvate level in the urine showed no correlation with the urinary levels of lactate, α-hydroxybutyrate, or β-hydroxybutyrate. On the other hand, significant positive correlations were found among these three metabolites, because all of them are downstream from pyruvate in the glycolytic process. However, urinary levels of α-hydroxybutyrate (0.6 μg/mg creatinine) and β-hydroxybutyrate (0.3 μg/mg creatinine) were less than one tenth of the lactate level (7.5 μg/mg creatinine), being decreased by 31.9% and 33.1% relative to the mean reference value, respectively. Although statistically significant, the correlations among these metabolites are probably of little clinical importance.
The mean urinary lactate level and the lactate/pyruvate ratio were respectively increased by 244.2% and 250.8% in the tAMD group and by 588.5% and 440.7% in the PCV group. These findings indicate that the amount of pyruvate entering the TCA cycle from the glycolytic pathway was insufficient in both types of AMD, suggesting that tAMD and PCV may share a common mechanism which involves activation of LDH and a shift from aerobic to anaerobic conditions in the mitochondrial-glycolytic interaction. When the lactate level and the lactate/pyruvate ratio were compared between the tAMD and PCV groups, both were higher in the PCV group than the tAMD group (0.6 vs 1.2 μg/mg and 250.8% vs 440.7% increase, respectively), although the differences were not significant. Multivariate analysis did not extract any of the variables as independent predictors of the lactate/pyruvate ratio, but showed a weak positive association with the type of AMD (OR=2.320), and PCV was more closely associated with the lactate/pyruvate ratio than tAMD. The reason why the lactate level was higher in the PCV group than in the tAMD group is unclear but may be partly due to minor differences of choroidal microvascular changes between tAMD and PCV. Additionally, the PCV group may have had more advanced AMD because visual acuity was worse in this group than in the tAMD group, although there was no significant difference between the two groups. Choroidal microvascular abnormalities associated with PCV are reported to include arteriosclerotic vascular wall changes with hyalinization, which differ from the changes of CNV associated with tAMD [24-27]. PCV also shows histopathologic similarities with branch retinal vein occlusion, which features hyaline-like degeneration of the vessel walls [25]. Microvascular endothelial cells sustain their growth and proliferation via aerobic glycolysis, which involves conversion of pyruvate to lactate [28]. Glycolysis may contribute to age-related alterations of the choroidal microvasculature and to the pathogenesis of PCV. However, we cannot comment about the influence of the glycolytic pathway on vascular changes in AMD because no direct evidence of a relationship has yet been obtained in vivo using animal models or in vitro using cultured choroidal endothelial cells.
It is still unknown how glycolysis contributes to the pathogenesis of AMD, which is a multifactorial condition that is chiefly associated with exposure to UV light [29] and aging [30]. There are several possible mechanisms by which glycolysis could promote the progression of AMD [31]. Normal cells obtain ATP via the oxygen-dependent pathway of oxidative phosphorylation and also via the oxygen-independent pathway of glycolysis. Under hypoxic conditions, pyruvate is metabolized to lactic acid instead of entering the TCA cycle, but this process has less capacity to produce ATP from glucose. The primary factor mediating this hypoxic metabolic switch is hypoxia-inducible factor (HIF), an oxygen-sensitive transcriptional activator [32-34]. The retina requires a continuous supply of oxygen and glucose to maintain normal function and viability. Hypoxic metabolism has been reported to occur in the RPE [31, 35] and the retina employs both anaerobic and aerobic glycolysis [36-40]. Approximately 80% of the glucose consumed by the outer retina is utilized for aerobic glycolysis [40], while the RPE has a high rate of lactate production concomitant with high oxygen consumption [41-43]. Elevation of the blood lactate level is associated with visual dysfunction in diabetic patients without retinopathy [44]. Taken together, these reports provide considerable support for our hypothesis that inhibition of glycolysis at the final step, which is the shift from glycolysis (pyruvate to lactate) to mitochondrial oxidative metabolism, may contribute to the pathogenesis of AMD.
The main limitation of this study was that there was no control group without AMD. To overcome this problem, we employed reference values obtained in healthy subjects. Second limitation is that we could not measure the intraocular levels of pyruvate and lactate. Further investigations using animal models of AMD might solve this problem. Third limitation is that our patients took drugs for hypertension (n=7), diabetes (n=3), hyperlipidemia (n=1), and cerebrovascular disease (n=2). Additionally, 11 patients suffered from cataract and 3 patients had diabetes. Although urinary glycolysis metabolites had no correlation with these risk factors, the urinary levels of glycolysis may be liable to bias from these variables.
CONCLUSION
In summary, we performed the first investigation of glycolysis metabolites in patients with AMD. We found that urinary pyruvate and lactate levels were increased in AMD patients. In addition, the lactate/pyruvate ratio may be linked to the prognosis of AMD, which would potentially make it a useful clinical parameter. Abnormalities of glycolysis seem to be involved in the pathogenesis of AMD.
TRIAL REGISTRATION
This trial was approved by the regional ethics committee (H24-2611) and is registered with the UMIN Clinical Trials Registry, number UMIN000013684.
CONFLICT OF INTEREST
The authors report no conflicts of interest. The authors alone are responsible for the content and for writing this paper.
ACKNOWLEDGEMENTS
This work was supported in part by a Grant-in-Aid for Scientific Research from the Ministry of Education, Culture, Sports, Science and Technology of Japan and Health Labour Sciences Research Grant from The Ministry of Health Labour and Welfare of Japan.


