All published articles of this journal are available on ScienceDirect.

In Vivo Confocal Microscopic Evaluation of Corneal Langerhans Cells in Dry Eye Patients§
Authors Info & Affiliations
Abstract
Purpose.
To assess inflammatory involvement of cornea in dry eye by means of confocal microscopy, evaluating the presence and distribution of Langherans cells (LCs).
Methods:
98 eyes of 49 subjects were enrolled: 18 subjects affected by Sjögren Syndrome Dry Eye (SSDE), 17 with Non-Sjögren Syndrome Dry Eye (NSSDE), 14 healthy volunteeers. Dry eye symptoms, tear film, ocular surface damage and corneal confocal microscopy were analized.
Results:
A significant increase of LCs density was observed at sub-basal nerve plexus (SSDE = 79 cells/mm2 andNDE = 22 cells/mm2; p = 0,0031) and sub-epithelial nerve plexus (SSDE = 38 cells/mm2 and NDE = 3 cells/mm2; p = 0,0169) in central cornea of SSDE group. An increased number of LCs from the center to the periphery of the cornea was observed, significant only in healthy volunteers group. In dry eye patients there was an increase in LCs density in both peripheral and central cornea with a significant difference between NDE (14,66 cells/mm2) and SSDE (56,66 cells/mm2) only in central cornea (p = 0,0028). In SSDE group, mean density of LCs in central cornea results also superior to NSSDE group (29,33 cells/mm2).
There was no correlation between LCs density and dry eye symptoms, tear film deficiency and ocular surface damage.
Conclusion:
This study demonstrates the activation of an inflammatory and immunological reaction in cornea of NSSDE and SSDE patients. Confocal microscopy can be an important diagnostic tool in evaluation and follow-up of dry eye disease.
INTRODUCTION
Tear film deficiencies are among the most common eye problems [1]: epidemiologic studies have reported that more than 6% of the population over the age of 40 suffer from dry eye, with the prevalence increasing to 15% of the population over the age of 65 [2-4]. Using a prevalence of 6% and the 2000 census data, there are an estimated 7.1 million people in the US over the age of 40 who experience dry eye symptoms. Most studies have found an increasing prevalence with age and some studies have shown a greater prevalence of dry eye among women [2, 4, 5].
The 2007 International Dry Eye WorkShop (DEWS) [6] defined dry eye as a multifactorial disorder of the tear film and ocular surface that results in eye discomfort, visual disturbance, and often ocular surface damage, characterized
Rheumatologic diseases are often associated with ophthalmic findings, particularly ocular surface diseases and dry eye diseases. Sjögren syndrome (SS) is a multisystem autoimmune disease characterized by hypofunction of the salivary and lacrimal glands. It is among the group of diseases overseen by rheumatologists and its management requires 3 areas of specialty practice: rheumatology, ophthalmology and oral medicine. It is clear that SS is a a systemic, multiorgan autoimmune disease, that it has got a chronic or progressive course and that is characterized by secretory disfunction [7, 8]. The American College of Rheumatology [8] recently proposed a classification which applies to individuals with sign/symptoms that may be suggestive of SS. Particularly it is fundamental to have at least 2 of the following 3 objective features:
- Positive serum anti-SSA/Ro and/or anti-SSB/La or (positive rheumatoid factor and ANA titer ≥ 1:320)
- Labial salivary gland biopsy exhibiting focal lymphocytic sialadenitis with a focus score ≥ 1 focus/4 mm2
- Dry eye disease with keratoconjunctivitis sicca with ocular staining score > 3 (in individuals not using hypotensive eye drops for lowering intraocular pressure and in individuals that did not underwent corneal surgery or cosmetic eyelid surgery in the last 5 years).
In the clinical evaluation of dry eye patients there is no actually established gold standard: several test are used in the clinical practice which analyze patient’s symptoms, tear production, tear quality, ocular surface damage. All of these diagnostic test have low sensibility and little reproducibility, in particularly in patients with severe dry eye [9].
Tear film hyperosmolarity is recognized as an important pathogenetic factor in dry eye syndrome, but its use is currently limited due to the complexity in its measurement.
Purpose of this work is to evaluate the presence and distribution of Langherans cells (LCs) in cornea of dry eye patients by means of confocal microscopy, in order to demonstrate an inflammatory reaction.
Originally described by Engelmann in 1867 [10], dendritic cells (DCs) are antigen-presenting cells (APCs) of bone marrow origin: the current concept is that corneal epithelial DCs are identical to the immunologically active LCs of the epidermis. The distribution of LCs in the central cornea is an issue of ongoing discussion: some investigators have already shown the presence of LCs in patients with herpes keratitis [11], in contact lens wearers and in healthy volunteers [12, 13] by using confocal microscopy.
In dry eye disease, in vivo confocal microscopy has provided new information on the whole-ocular surface morphofunctional unit. It has also improved understanding of pathophysiologic mechanisms and helped in the assessment of prognosis and treatment [14].
Furthermore, confocal microscopy allows quick, noninvasive, steady-state respectful examination of the ocular surface at cellular level to be performed and has potential to be used in the future as a biomarker and to contribute to optimize the tailored management of these diseases [15].
MATERIALS AND METHODS
This study was performed with the ethical standards laid down in the 1964 Declaration of Helsinki and its later amendments.
We consecutively enrolled 3 groups of subjects: 18 patients affected by Sjögren Syndrome (SSDE, Sjögren Syndrome Dry Eye), 17 patients affected by Non Sjögren Sydrome Dry Eye (NSSDE) and 14 healthy volunteers (NDE, Non Dry Eye).
Inclusion criteria in the SSDE group were:
- the diagnosis of Sjögren Sydrome according to the diagnostic criteria of SICCA consensus [8].
- Inclusion criteria in the NSSDE group were:
- dry eye diagnosed by Schirmer’s test without anesthesia < 10 mm/5 minutes, symptoms and signs of dry eye, not recognized as Sjögren Sydrome.
- Inclusion criteria in the normal control subjects group were:
- Schirmer ‘s test without anesthesia > 10 mm/5 minutes
- FBUT (Fluorescein Break Up Time) > 10 seconds
- absence of fluorescein and lissamine green staining.
- Exclusion criteria in all groups included:
- use of contact lenses
- previous ocular trauma or surgery
- drug allergies
- systemic or ocular diseases except dry eye itself and evolving cataract
- patients less than 18 years old
- pregnant or nursing women
- inability to understand and/or complete the OSDI questionnaire and the tests
Each subject, following detailed explanation and acquisition of informed verbal consent, was evaluated by this procedure:
- Ocular Surface Disease Index (OSDI) questionnaire
- slit lamp examination of lid and ocular surface
- tear meniscus height (TMH) assessment
- FBUT measurement
- Schirmer’s test without anesthesia
- Oxford Grading Scheme (OGS) evaluation of ocular surface fluorescein and Lissamine green staining
- corneal confocal microscopy with Heidelberg Retina Tomograph in combination with Rostock Cornea Module: a detachable system equipped with a water contact objective (63x/0.9 W, 670 nm, ∞/0; Zeiss, Jena, Germany). The device includes a contact system under a video control. The focus level was defined and changed in axial direction by both external manual and internal z-scan, generating images of the cornea with precise information on the depth of the analysis. The confocal microscopy was performed, after topical application of anesthesia (oxybuprocaine hydrochloride 0.4%) and a drop of carbomer gel (COMFORT® gel, Bausch & Lomb, Berlin, Germany) in the eye with the lowest Schirmer test for dry eye patients and in the eye with the higher Schirmer test in normal subjects, in two different corneal areas: central and peripheral at six o’clock. A total number of three sections (intermediate epithelial cells, sub-basal nervous plexus and sub-epithelial nervous plexus) in each studied area was examined: the number of LCs was counted manually in the largest ROI (maximum Region Of Interest: 0.1589 mm2) per epithelial section by using a grid system with a 50-μm grid width and is given as cells per square millimetre.
- Intermediate epithelial cells section was defined [16] as the epithelial layer between the surface epithelium cells (that have got light cells boundaries and bright visible nuclei) and basal epithelium cells (smaller cells with light cells boundaries and without visible nuclei). The sub-basal layer [17] was defined as the layer included between the basal epithelial layer (clearly demarcated with reflective cell borders to dark non-reflective cell bodies) and the Bowman layer (that appears as a transitional zone bordered by the basal epithelium and the anterior stroma, distinguished by brunching nerve fibres against an amorphous background).
- The sub-epithelial layer was defined as the anterior 2/3 of the corneal stroma where the large nerve fibers enters [16].
Statistical Analysis
In 98 eyes of 49 subjects enrolled in the study only one eye in each patient was studied by confocal microscopy and used for statistical analysis:
- NDE group: the eye with the highest score at the Schirmer test
- SSDE and NSSDE groups: the eye with the lowest score at the Schirmer test
Differences between qualitative variables were tested using the chi-square test (Pearson) or the Fischer test. Differences between quantitative variables were studied using the variance analysis: for normally allocated data with t-test corrected according to Bonferroni for meaningful differences, for non-normally distributed data with the Kruskal-Wallis test or the Wilcoxon rank-sum (Mann-Whitney) if the variance analysis was significant.
Correlation coefficients (between the number of LCs and OSDI, BUT, TMH, Schirmer test, OSG) were calculated with the Spearman test.
RESULTS
All subjects examined in the study were women and there were not significant differences (p = 0.06) between their mean age.
Symptoms complained by subjects and evaluated by OSDI questionnaire were significantly or marginally significantly different between groups (SSDE versus NDE: p = 0.001; SSDE versus NSSDE: p = 0.052; NSSDE versus NDE: p = 0.054). Higher OSDI scores in the NSSDE and NDE group can be due to the excessive scatter of the index [18].
Examination of ocular surface showed a significant incidence of blepharitis (p = 0.008) in eyes affected by dry eye compared to normal eyes (72.2% SSDE and 70.5% NSSDE), absence of lid keratinisation in normal subjects, significant prevalence of lacrimal meniscus irregularity (5.8% NSSDE and 5.6% SSDE; p = 0.005) and conjunctival redness in dry eyes (58.8% NSSDE and 77.7% SSDE; p = 0.005).
Tears film evaluation showed significant reduction in TMH, BUT and Schirmer test values in dry eyes.
Ocular surface staining with fluorescein and Lissamine green showed a significant prevalence of epithelial damage, graded as the Oxford Grading Scheme (OGS), in subjects affected by dry eye (p = 0.001) (Table 1).
Population characteristics and clinical data.
| Population Characteristics and Clinical Data | SSDE (n = 18) | NSSDE (n = 17) | NDE (n = 14) | P Value |
|---|---|---|---|---|
| Age | ||||
| Average age (years) | 57.33 | 59.82 | 51.43 | 0.06 |
| Range (years) | 34-69 | 38-76 | 39-77 | |
| OSDI Results | ||||
| Average score | 53.84±20.49 | 36.71±23.55 | 18.56±15.99 | SSDE vs NDE 0.0001SSDE vs NSSDE 0.052NSSDE vs NDE 0.054 |
| Range | 20.83-77.77 | 2.08-81.25 | 0-27.73 | |
| Slit Lamp Examination (Number of Patients and %) | ||||
| Eyelid malpositions | 0 (0%) | 0 (0%) | 0 | SSDE and NSSDE vs NDE>0.05 |
| Blepharitis | 13 (72.22%) | 12 (70.59%) | 3 (21.43%) | SSDE and NSSDE vs NDE0.008 |
| Lid keratinisation | 4 (22.22%) | 3 (17.65%) | 0 | SSDE and NSSDE vs NDE0.196 |
| Lacrimal meniscus irregularity | 1 (5.56%) | 1 (5.88%) | 10 (71.43%) | SSDE and NSSDE vs NDE0.005 |
| Conjunctival redness | 14 (77.78%) | 10 (58.82%) | 0 | SSDE and NSSDE vs NDE0.005 |
| Follicles ± papillae (conjunctival) | 3 (16.67%) | 2 (11.76%) | 0 | SSDE and NSSDE vs NDE0.356 |
| Tear Film Evaluation | ||||
| TMH (in mm) average | 0.13 | 0.19 | 0.28 | SSDE and NSSDE vs NDE0.0001 |
| TMH (in mm) standard deviation | 0.07 | 0.07 | 0.05 | |
| BUT (in seconds) median | 3 | 4 | 11.5 | SSDE and NSSDE vs NDE0.0001 |
| BUT (in seconds) range | 2-8 | 2-8 | 10-25 | |
| Schirmer test (in mm) median | 2.5 | 6 | 12.5 | SSDE and NSSDE vs NDE0.0001 |
| Schimer test (in mm) range | 0-10 | 2-10 | 10-32 | |
| Ocular Surface Staining Evaluation | ||||
| FOGS Average | 2.22 | 1.47 | 0 | SSDE and NSSDE vs NDE0.0001 |
| FOGS Standard Deviation | 1.16 | 1.00 | 0 | |
| LGOGS Average | 2.5 | 1.76 | 0 | SSDE and NSSDE vs NDE0.0001 |
| LGOGS Standard Deviation | 1.09 | 1.09 | 0 | |
SSDE: Sjögren Syndrome Dry Eye, NSSDE: Non Sjögren Syndrome Dry Eye, NDE: Non Dry Eye; OSDI: Ocular Surface Disease Index; THM: Tear meniscus height; BUT: break up time; FOGS: Fluorescein Oxford Grading Scheme; LGOGS: Lissamine Green Oxford Grading Scheme.
Presence and distribution of Langherans Cells in different corneal sections and areas.
| Presence of LCs (% of Positivity of LCs) | SSDE | NSSDE | NDE | P Value | |
|---|---|---|---|---|---|
| Central cornea | 1 | 55.55 | 29.41 | 35.71 | |
| 2 | 100 | 88.23 | 92.85 | ||
| 3 | 77.77 | 41.17 | 50 | ||
| Peripheral cornea | 1 | 66.66 | 35.29 | 57.14 | |
| 2 | 100 | 88.23 | 100 | ||
| 3 | 83.33 | 47.05 | 64.28 | ||
| LCs Density in Each Corneal Section (Cell/mm2) | |||||
| Central cornea | 1 (median) | 25 | 0 | 0 | SSDE and NSSDE vs NDE 0.0833 |
| 1 (range) | 0-126 | 0-50 | 0-31 | ||
| 2 (median) | 79 | 44 | 22 | SSDE and NSSDE vs NDE0.0098 SSDE vs NDE 0.0031 | |
| 2 (range) | 13-371 | 0-392 | 0-63 | ||
| 3 (median) | 38 | 0 | 3 | SSDE and NSSDE vs NDE0.0130 SSDE vs NDE 0.0169 | |
| 3 (range) | 0-201 | 0-76 | 0-44 | ||
| Peripheral cornea | 1 (median) | 34,5 | 0 | 16 | SSDE and NSSDE vs NDE0.2343 |
| 1 (range) | 0-107 | 0-164 | 0-44 | ||
| 2 (median) | 119.5 | 88 | 82 | SSDE and NSSDE vs NDE0.0791 | |
| 2 (range) | 25-398 | 0-541 | 6-258 | ||
| 3 (median) | 50 | 0 | 22 | SSDE and NSSDE vs NDE0.0791 | |
| 3 (range) | 0-189 | 0-157 | 0-101 | ||
| Mean LCs Density in Each Corneal Area (Cell/mm2) | |||||
| Central cornea (median) | 56.66 | 29.33 | 14.66 | SSDE and NSSDE vs NDE 0.0061 | |
| Central cornea (range) | 4.33-165.33 | 0-130.66 | 0-42 | ||
| Peripheral cornea (median) | 58.83 | 58.66 | 44 | SSDE and NSSDE vs NDE0.1032 | |
| Peripheral cornea (range) | 21-159.33 | 0-220 | 2-119.33 | ||
| P between central and peripheral 0.4859 (Wilcoxon test) | P between central and peripheral 0.0605 (Wilcoxon test) | P between central and peripheral 0.0019 (Wilcoxon test) | |||
1. Intermediate epithelial cell layers
2. Sub-basal nerve plexus
3. Sub-epithelial nerve plexus
LCs: Langherans Cells; SSDE:Sjögren Syndrome Dry Eye; NSSDE: Non Sjögren Syndrome Dry Eye; NDE: Non Dry Eye.
The number of LCs was counted manually in each corneal section: Table 2 gives the frequency of LCs in central and peripheral corneal sectors and the density of LCs in each corneal section. A significant increase of LCs density was observed at sub-basal nervous plexus (SSDE = 79 cells/mm2 and NDE = 22 cells/mm2; p = 0.0031 - Wilcoxon rank-sum) and sub-epithelial nervous plexus (SSDE = 38 cells/mm2 and NDE = 3 cells/mm2; p = 0.0169 - Wilcoxon rank-sum) in central cornea of patients affected by Sjögren Syndrome.
Table 2 gives also the mean values of LCs density calculated in central corneas and peripheral corneas of each group. There was a difference in LCs distribution: an increasing cell number from the center to the periphery of the cornea, but this trend difference between LCs density in these two corneal areas was significant only in normal subjects (NSSDE: p = 0.0605; SSDE: p = 0.4859; NDE: p = 0.0019 - Wilcoxon test).
There was not a significant difference between the gradient of LCs distribution (calculated from the difference of LCs density in central and peripheral corneas) in each group (p = 0.5093, Kruskal-Wallis test).
Essentially there was an increase in LCs corneal density in both the central and peripheral areas of dry eye patients, with a statistically significant difference between normal subjects (NDE = 14.66 cells/mm2) and dry eye patients with Sjögren Syndrome (SSDE = 56.66 cells/mm2) only in central sectors of the cornea (p = 0.0028 - Wilcoxon rank-sum). In SSDE group the mean value of density in central cornea resulted superior to NSSSDE group (NSSDE = 29.33 cells/mm2).
No correlation was found (p > 0.05 - t test) between LCs density and dry eye symptoms (evaluated with OSDI), tear film deficiency and ocular surface damage (evaluated with FBUT, TMH, Schirmer’s test, staining with fluorescein and lissamine green). The correlation between OSDI and LCs density is displayed in Figs. (1, 2).
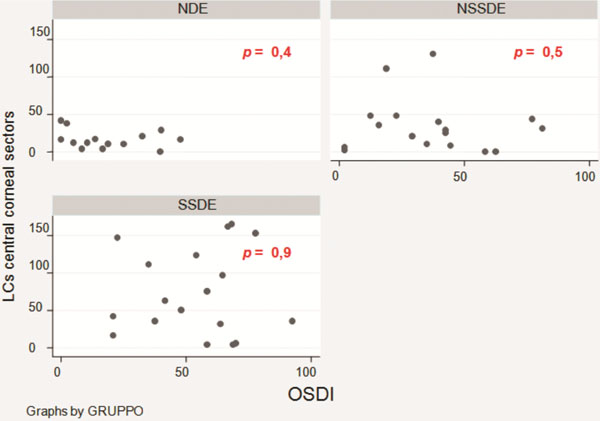
Correlation between LCs density in central cornea and OSDI.
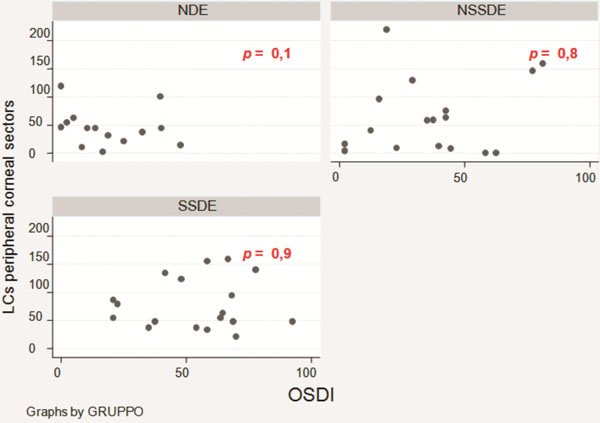
Correlation between LCs density in peripheral cornea and OSDI.
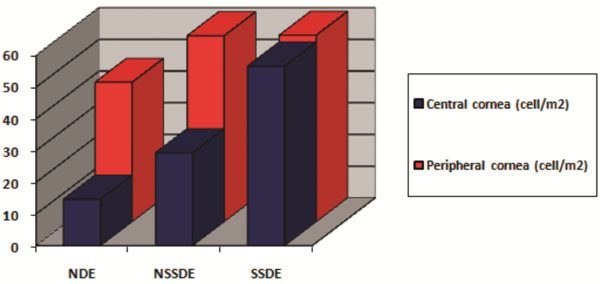
LCs gradient difference between central and peripheral cornea in NDE, NSSDE e SSDE patients.

Confocal microscopic evaluation in SSDE: a. intermediate epithelial cells, central corneal sectors; b. sub-basal nerve plexus, central corneal sectors; c. sub-epithelial nerve plexus, central corneal sectors; d. intermediate epithelial cells, peripheral corneal sectors; e. sub-basal nerve plexus, peripheral corneal sectors; f. sub-epithelial nerve plexus, peripheral corneal sectors.
DISCUSSION
We decided to analyze the intermediate corneal epithelial layers, particularly at the level of basal epithelial cells and sub-basal nerve plexus. It is well described [12] that LCs are located at depth of 35-60 µm, preferentially within the level of basal epithelial cells and sub-basal nerve plexus. This preferential localization of the LCs in the direct vicinity of nerve fibers or at least at the level of nerve bundles might be attributed to and explained by their usage of nerve plexus for intraepithelial movement [12].
We could observe LCs corneal cells (with different frequency and density in the different examined corneal areas) in 47 patients out of 49 subjects (95%). In 2 patients affected by NSSDE we couldn’t find LCs. This percentage is much higher if compared to Zhivov et al. [12, 13] results in normal subjects (31.3%) and in contact lens wearers (59%). This could be partially explained by considering that Zhivov et al. [13] evaluated a different sample of patients: younger and more heterogeneous in sex distribution than our.
Comparing our data to Zhivov et al. [12, 13] it seem that population examinated in the present study has got an higher frequency of cornea LCs, but a lower density of these cells. These Authors calculated an average density of LCs of 34±3 cells/mm2 in central cornea and 98±8 cells/mm2 in peripheral cornea for the normal healthy volunteers and an average density of 78±25 cells/mm2 in central cornea and 210±24 cells/mm2 in peripheral corneal of contact lens wearers. This difference can be explained by the fact that in our study we calculated the average values of LCs density observed in intermediate epithelial sectors, in sub-basal nerve plexus and in the sub-epithelial one (including areas where we didn’t observe LCs). In fact, if we consider the density of LCs in the sub-basal nerve plexus only, data of our study are more similar to Zhivov et al. [11]: NDE: 22 cell/mm2versus 82 cell/mm2; NSSDE: 44 cell/mm2versus 88 cell/mm2; SSDE: 79 cell/mm2versus 119.5 cell/mm2.
LCs were observed especially in the sub-basal nerve plexus in all groups (Table 2). Furthermore the density values of LCs seems to decrease from peripheral corneal to central corneal (Table 2). This gradient difference seems to reduce (even if without statistical significant p = 0.5) in NSSDE patients and particularly in SSDE patients, where the gradient is minimal (NDE: 14.66 cell/mm2versus 44 cell/mm2; NSSDE: 29.33 cell/mm2versus 58.66 cell/mm2; SSDE: 56.66 cell/mm2versus 58.83 cell/mm2) (Fig. 3).
Considering the analysis in the different corneal sections, density of LCs is superior in the SSDE group if compared to NDE group at the sub-basal nerve plexus (SSDE: 79 cell/mm2versus NDE: 22 cell/mm2; p = 0.0031) and at sub-epithelial plexus (SSDE: 38 cell/mm2versus NDE: 3 cell/mm2; p = 0.0169). Difference between SSDE group and NSSDE group is significant only at sub-epithelial plexus (SSDE: 38 cell/mm2versus NSSDE: 0 cell/mm2; p = 0.0109).
Comparing now the mean density values of LCs (average value calculated from the LCs density at the three different corneal sections) we can underline a significant difference between the NDE group and the SSDE group (SSDE: 56.66 cell/mm2versus NDE: 14.66 cell/mm2; p = 0.0028) and between the SSDE group and the NSSDE group (SSDE: 56.66 cell/mm2versus NSSDE: 29.33 cell/mm2; p = 0.0332) in the central corneal. We didn’t observe significant differences in the peripheral cornea. This is in agreement with previous studies [12, 13, 19] which demonstrated that in the corneal limbal epithelium, dendritic cells are present in almost every healthy subject, while in the central cornea only 20-30% of healthy controls show APCs.
Therefore, we found an increase in the Langherans cells number in the central corneal of dry eye patients. This increment is significant only in patients affected by Sjögren syndrome, that usually leads to a more severe keratocon-junctivitis sicca. We didn’t observe a significant difference in LCs density values in the peripheral cornea of dry eye patients and normal patients.
Lin H et al. [20] recently investigated the morphology, distribution and density of inflammatory cells in the corneal epithelium of NSSDE, SSDE and healthy volunteers subjects, finding a significant correlation between LCs and leukocytes density and the severity of the clinical evaluation. The increased density of epithelial DCs observed by Lin may indicate - as our results - a heightened immune status of the cornea.
Marsovszky L. et al. [21] found a prevalence of central and peripheral LCs - together with central LCs morphology values - significantly higher than normal in patients affected by rheumatoid arthritis. This alteration of LCs in rheumatoid arthritis suggests an active inflammatory process in the cornea, which may reflect an increased activation state of the innate immune system, even in inactive stages of the disease and without ocular symptoms.
A recent research studied ocular surface inflammation in relation to systemic disease activity in rheumatoid arthritis (RA) patients with or without secondary Sjögren's syndrome (SSII and non-SSII respectively). Differences in the clinical, cellular and cytokine responsiveness to systemic RA treatments show that the ocular surface pathology is dissimilar for RA SSII and RA non-SSII patients [22].
Little is known about the exact molecular mechanisms that regulating LC maturation in the cornea, or those keeping large numbers of these LCs in an immature state. Centripetal migration of LCs play a critical role in promoting immunoinflammatory responses in the eye, but the molecular mechanisms responsible for ocular LC migration are poorly understood [23], also because corneal tissue is avascular and without lymphatic support.
In the murine corneal epithelium after cauterization of the central cornea, a migration and maturation of resident LCs and expression of MHC II has been demonstrated, without expression of these molecule in peripheral cornea. Hamrah et al. [24] found that in inflammation, the expression of MHC class II and B7 molecules (CD80 and CD86) is potently upregulated. This upregulation was observed in cauterized corneas uniformly at day 3 after cauterization: first near the cautery sites and later throughout the cornea. Although cells migrating into the cornea from the limbus also contribute to the increased density of MHC class II+ and B7+ cells, data of this study suggest that most of these cells, especially in the central and paracentral areas, are resident LCs.
The concept of centripetal LCs migration is well described in literature. Some Authors [25] hypothized the “X,Y,Z theory”, considering “X” the proliferation of basal epithelial cells; “Y” the contribution to the cell mass by centripetal movement of peripheral cells; and “Z” the epithelial cell loss from the surface. The maintenance of corneal epithelium can be defined by the equation: “X + Y = Z”, which states that if the corneal epithelium is to be maintained, cell loss must be balanced by cell replacement.
Banchereau and Steinman [26] underlined that B and T lymphocytes are the mediators of immunity, but their function is under the control of dendritic cells. Dendritic cells in the periphery capture and process antigens, express lymphocyte co-stimulatory molecules, migrate to lymphoid organs and secrete cytokines to initiate immune responses. They not only activate lymphocytes, they also tolerize T cells to antigens that are innate to the body (self-antigens), thereby minimizing autoimmune reactions. We don’t know exactly what determines the direction and the movement of DCs. It is well known that cytokines and chemochines (i.e. GM-CSF, TNF-α and IL-1, MIP-1α and -β) can modulate movements [27, 28] and maturation of DCs. Among these IL-1 e TNF-( are more expressed in tear fluid and conjunctival citology of dry eye patients [29].
Using in vivo confocal microscopy LCs appears as bright corpuscolar particles with different morphologies: individual cell bodies without processes, cells bearing dendrites or cells arranged in a network via long interdigitating dendrites. In Fig. (4) we can observe LCs with confocal microcopy in a SSDE patient (Fig. 4).
Langherans’ cells with dendritis are more frequently described in the peripheral cornea, while Langherans’cells without dendritis are described both in central and peripheral cornea, more frequently in central sectors. The central cornea is endowed with these cells that seems to be the immature and precursor DCs, both in the epithelium and the stroma, where in Langerhans cells and monocytic DC reside, respectively [16, 20, 30].
In the present study we couldn’t observe a significant difference between the morphology of LCs in the central or in the peripheral corneal sectors. We could not appreciate any difference between the morphology of LCs in the central and in the peripheral cornea. Rather in each patient the morphology of the cells was typical: in some patients the cells had a dendritic morphology irrespective of the area investigated.
A correlation between LCs density and evaluation of signs and symptoms of dry eye can’t be established. Recently it has been reported that alterations in nerve cell morphology rather than density, toghether with an increase in APCs, can be responsible for the corneal mechanical hypersensitivity in SSDE patients [31].
In conclusion this study, finding APCs corneal cells (LCs) using confocal microscopy, demonstrated the activation of an inflammatory and immunological reaction in cornea of dry eye patients (both NSSDE and SSDE patients).
Actually we don’t have a precise diagnostic test to assess the amount of inflammation in the ocular surface of dry eye patients to suggest a customized clinical approach. The increased density of APCs in the sub-basal and sub-epithelial layers is not present only in SSDE patients. Recently it has been reported in Meibomian gland disease also [32, 33], although in this group of patients as well as in NSSDE the density is significantly lower than in SSDE patients.
We believe that confocal microscopy can be an important diagnostic tool in the evaluation of dry eye disease, with possible therapeutical implications. The finding of an important inflammatory and immunological activation can suggest a different and more “aggressive” therapeutical protocol, with anti-inflammatories or corticosteroids or ciclosporine. Confocal microscopy might also prove useful in the follow-up of dry eye patients.
CONFLICT OF INTEREST
The authors confirm that this article content has no conflict of interest.
ACKNOWLEDGEMENTS
Declared none.

