
RESEARCH ARTICLE
Double Layer Sign and Pigment Epithelial Detachment in Patients Treated with Subthreshold Laser for Central Serous Chorioretinopathy
Christian Enders1, *, Gabriele E. Lang1, Benjamin Mayer2, Jens Ulrich Werner1
Article Information

Identifiers and Pagination:
Year: 2024Volume: 18
E-location ID: e18743641275908
Publisher ID: e18743641275908
DOI: 10.2174/0118743641275908231228114029
Article History:
Received Date: 17/10/2023Revision Received Date: 14/12/2023
Acceptance Date: 20/12/2023
Electronic publication date: 20/02/2024
Collection year: 2024

open-access license: This is an open access article distributed under the terms of the Creative Commons Attribution 4.0 International Public License (CC-BY 4.0), a copy of which is available at: https://creativecommons.org/licenses/by/4.0/legalcode. This license permits unrestricted use, distribution, and reproduction in any medium, provided the original author and source are credited.
Abstract
Background and Objective
Central serous chorioretinopathy (CSCR) is characterized by serous detachments of the central neurosensory retina. Besides, other alterations of the retinal pigment epithelium (RPE) of the focal detachment of the RPE can occur. We explored the frequency of RPE detachment and double layer sign in OCT in our patient population, the influence of subthreshold photocoagulation (ST-LP) on these parameters and the possibility of correlations with visual acuity.
Materials and Methods
We conducted a retrospective analysis of all patients who underwent ST-LP based on the diagnosis of CSCR in a German university eye clinic from 2009 to 2014. Measurements in OCT were performed regarding pigment epithelial detachment (PED) and double layer sign (DLS).
Results
54 eyes of 49 patients were included in the study. The frequency of PEDs dropped from 66% of cases at baseline to 50% after 3 months. No significant differences in calculated areas of lift-off volume of PED were identified. The frequency of a DLS was significantly lower 8 weeks after ST-LP compared to baseline (63%, p<0.05), but not after 12 weeks.
Conclusion
We conclude that PEDs and DLS are common in CSCR. In this study, no convincing correlation can be identified between BCVA before ST-LP or at the last visit and different characteristics of PED as well as DLS. While the area of PED becomes smaller after ST-LP, the extent of the DLS seems to increase. Further prospective studies are required, and DLS with respect to the occurrence of CNV should also be given attention.
1. INTRODUCTION
Serous detachment of the central neurosensory retina (NR) is typical in patients with central serous chorioretinopathy (CSCR) and may be accompanied by focal detachment of the retinal pigmental epithelium (PED) as well as other changes in the retinal pigmental epithelium (RPE). This can lead to pronounced visual complaints if the serous retinal detachment is located in the macula [1]. In addition to clinical assessment, optical coherence tomography (OCT) plays a crucial role in the diagnosis and follow-up of CSCR [2, 3]. OCT-Angiography can provide additional information in some of these patients [4, 5]. Hence, fast, noninvasive, and reproducible detection of the typical findings of CSCR is possible. Treatment of recurrent CSCR includes laser-therapy, photodynamic therapy and pharmacologic therapy [6, 7].
In about three-quarters of all cases, the photoreceptor outer segments are elongated. In the area of leakage, an elevation of the RPE or even a PED is often found. More frequently in chronic forms of CSCR, the so-called double layer sign (DLS) is observed, which describes an irregular PED. The posterior, continuous and hyperreflective line is attributed to Bruch's membrane OCT signal, followed anteriorly by a signal with hyperreflective material (Fig. 1). Nonhomogeneous and hyperreflective space under an elevated RPE of any length or height indicates an eye with a higher risk of MNV than DLS [8].
Atrophies and proliferations of the RPE show up as window effects or as signal extinction of deeper layers in fluorescein angiography (FA). New technologies in OCT, like “swept source” or “enhanced depth imaging,” allow a complete assessment of the choroid. Often, the subfoveal choroid is thickened, and the choroidal vessels are dilated. In this case, a choroidal thickness of > 395 µm can be considered as a marker for pachychoroid. Areas of dilated choroidal vessels on OCT often correlate with increased vascular permeability of these areas on indocyanine green angiography. The retina may be atrophic and thinned in its entirety. Together with a disruption of the ellipsoid zone in the atrophic areas, this results in a worse final outcome with respect to BCVA. Persistent visual symptoms can also include metamorphopsia and loss of contrast or colour vision [9]
With increasing disease duration, the likelihood of intraretinal hyperreflective deposits increases; these may occur in the outer plexiform layer, outer granular layer, outer limiting membrane and ellipsoid zone and descend to deeper layers as the disease progresses. Cystoid intraretinal degeneration can be detected on OCT, especially in cases of disease activity lasting more than 5 years [1].
We performed further investigations based on previously published results [3] to understand the importance of certain OCT changes in CSCR and also in treatment planning. Early and reliable detection of a recurrence of CSCR and predictivity of treatment response is not satisfactory yet. In particular, we investigated the frequency of pigment epithelial detachment and the double layer sign on OCT in our patient population, the influence of subthreshold laser photocoagulation (ST-LP) with a frequency-doubled Nd: YAG continuous wave laser with a wavelength of 532 nm on these parameters, and whether there are correlations between these and best corrected visual acuity (BCVA) before and after ST-LP.
2. METHODS
Prior to any study activity, approval by the local ethic committee (application number 395/15) was obtained. The study was conducted in accordance with the Declaration of Helsinki as a retrospective analysis. Previous results of this patient cohort and the complete study plan have been published before, including results on visual acuity and OCT parameters [10, 11].
Consecutively, all patients who presented with CSCR in the outpatient clinic of a university eye clinic from 2009 to 2014 and fulfilled the inclusion and exclusion criteria were included. Eyes with insufficient quality OCT images or comorbidities with influence on visual acuity, as well as the history of recent eye surgery, were excluded. Inclusion in the study required a confirmed diagnosis of CSCR with macular involvement and SRF without resorption in the past 4 months or alternatively recurrence of CSCR. In addition, there had to be at least one typical source point in the FA that was accessible to ST-LP (500 µm from the fovea centralis and one optic nerve diameter away from the optic nerve). Subthreshold laser foci were applied to typical source points that were identified in FA.
OCT images analyzed in this study were taken with the Zeiss Cirrus 4000 and with the Zeiss Cirrus 5000 (Carl Zeiss Meditec Inc., Dublin, USA).
To assess whether a DLS or a PED was present, each individual scan of a cube data set was analyzed using the Zeiss Forum software (Carl Zeiss Meditec AG, Jena, Germany; version number: 4.2.1.66). The assessment was performed in the large display (“B-scan large”) of the OCT scans in gray values. All assessments were performed on the same monitor in a room with constant, indirect, and darkened ambient light by the same investigator.
OCT images were analyzed for the presence of a DLS before ST-LP (baseline (BL)), (shortest distance to the ST-LP in the case of multiple exposures), and at 4 weeks (V1), 8 weeks (V2) and 12 weeks (V3) after ST-LP. DLS was defined as a flat, irregular PED with an underlying highly reflective band. The surveyed variables were the presence of a DLS yes/no, the reflexivity of the internal structure, and the maximum length and maximum height of the DLS. Reflexivity was divided into hypo-, iso-, and hyperreflexivity in relation to the reflexivity in the vitreous cavity. In case of not assessable internal structure, e.g., very small DLS, a categorization “not assessable” was made. Both the length and height of the DLS were measured in Zeiss Forum if several DLS were present in a data set that had no spatial connection to each other, the sum of the length of the individual DLS, as well as the maximum height was included in the data analysis.
The cube data set was assessed for the presence of a PED at BL, V1, V2 and V3. Before the ST-LP and at each visit during which OCT was performed, both the PED area and the PED volume were determined in the 5 mm circle of the OCT scan, which were calculated by the Zeiss Forum software in the Retina Workplace module, “Advanced RPE Analysis.”
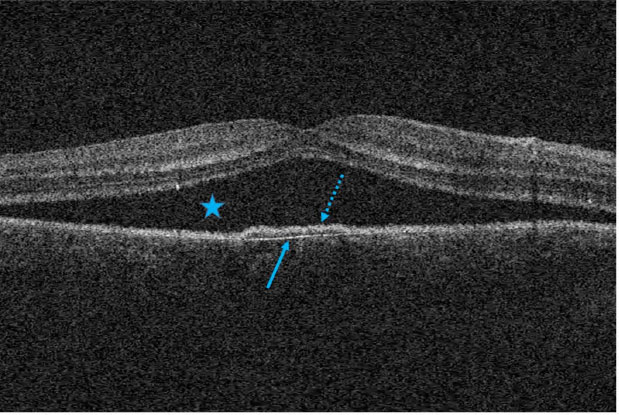 |
Fig. (1). Optical coherence tomography in recurrent central serous chorioretinopathy. The star marks subretinal fluid. The arrow with solid line points to the posterior border of the double layer sign, the arrow with dotted line to the anterior. |
2.1. Statistical Analysis
The data were collected in Microsoft Excel 2013. Statistical analysis was completed using SAS software (www.sas.com, version 9.4). A test for correlations of different parameters was performed using the Spearman rank correlation or its corresponding p-value. For inferential statistical analyses, a one-factor ANOVA was applied. Fisher's Exact Test was applied to analyze the dependence of two variables in partially small samples. The exploratory significance level was set at p<0.05 for all analyses.
3. RESULTS
PED detected in OCT is found at BL in 66% of the cases, at V1 in 67%, V2 in 56% and V3 in 50% of the cases (Fig. 2). The p-value in the Fisher Exact Test for testing a dependence between the time of examination and the frequency of a PED is 0.3944.
The area of a possibly existing PED calculated by the Zeiss Forum software is 0.45 mm2 in the 5 mm circle as an average value at BL and 0.13 mm2 at the time points V1, V2 0.13 mm2 and V3 0.09 mm2 (Supplementary Material Fig. S1). There is no statistically significant change at time V1, V2 or V3 compared to timepoint BL (p>0.05).
Fig. (3) shows the analysis of the PED volume calculated by the Zeiss Forum software in the 5 mm circle. This is 0.06 mm3 as the mean value for BL, V1 0 mm3, V2 0 mm3 and V3 0 mm3. The changes at time V1, V2 or V3 compared to time BL are not statistically significant.
The frequency of occurrence of a DLS at the different time points was measured (Fig. 4). At time point BL, a DLS is found in 63% of the cases, at V1 in 50%, V2 in 35% and V3 in 66% of the cases. The p-value in the Fisher Exact Test for testing a dependence between the time of examination and occurrence of a DLS is 0.4477 (non-significant).
The sum of the measured lengths of the DLS over time is pointed out in (Supplementary Material Fig. S2). It amounts to 45 µm in the median at the time BL, 470 µm at V1, 1180 µm at V2 and 530 µm at V3. Statistical significance is given for the changes V2 in relation to BL, V2 to V1 and V3 to V2.
We studied the median of the maximum measured height of the DLS (Supplementary Material Fig. S3). This is 40 µm at BL, 40 µm at V1, 40 µm at V2 and 30 µm at V3. There is no statistically significant change at time V1, V2 or V3 compared to time BL.
We also investigated the internal structure reflexivity of the double-layer sign with reference to vitreous reflexivity (Fig. 5). At all time points, isoreflexivity is found most frequently. The p-value in Fisher's exact test for a dependency between the time of examination and quality of reflection is 0.5805 (non-significant).
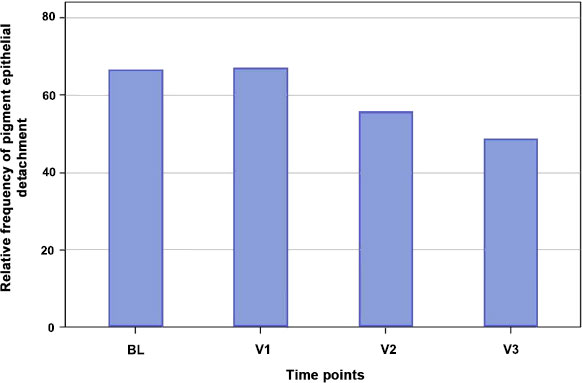 |
Fig. (2). Frequency of occurrence of a pigment epithelial detachment at the different time points. The relative frequency (%) is plotted on the ordinate, the different survey time points are plotted on the abscissa. BL: baseline; V: visit.# |
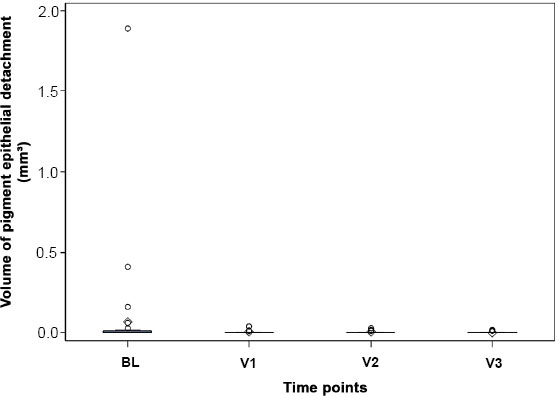 |
Fig. (3). Volume of pigment epithelial detachment at the different time points. The volume of pigment epithelial detachment (mm3) is plotted on the ordinate, the different time points are plotted on the abscissa. The diamond indicates the mean, the horizontal line the median of the visual acuity. The gray box in the Tukey diagram marks the range of values from the first to the third quartile, the whiskers have a length of 2 times the interquartile range. Measured values outside of this range are shown as outliers in the diagram by means of a circle. BL: Baseline; V: Visit. |
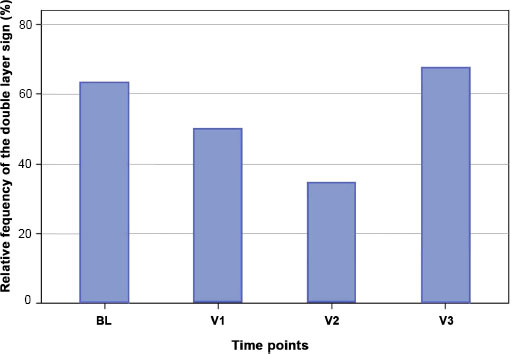 |
Fig. (4). Frequency of occurrence of a double layer sign at the different time points. The relative fre-quency (%) is plotted on the ordinate, the different time points are plotted on the abscissa. BL: baseline; V: visit. |
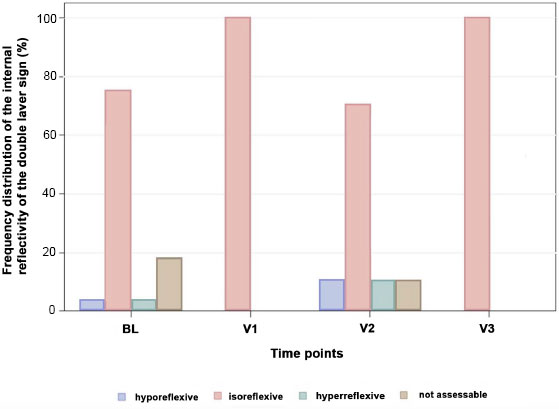 |
Fig. (5). Frequency distribution of the internal reflectivity of the double layer sign with the reference value of vitreous reflectivity at the different time points. The relative frequency (%) is plotted on the ordinate, and the different data collection times are plotted on the abscissa with color coding of the reflectivity. Light blue: hyporeflective; red: isoreflective; green: hyperreflective; brown: not as-sessable. BL: baseline; V: visit. |
| Best-corrected Visual Acuity (logMAR) at Baseline | |||
|---|---|---|---|
| Parameter | Spearman Correlation Coefficient | p-value | Number of Patients Evaluated |
| Length DLS BL | 0,02967 | 0,8880 | 25 |
| Height DLS BL | 0,02524 | 0,9047 | 25 |
| Length DLS V1 | -1,00000 | <0,0001 | 3 |
| Height DLS V1 | -0,00000 | 1,0000 | 3 |
| Length DLS V2 | 0,25698 | 0,5780 | 7 |
| Height DLS V2 | -0,25966 | 0,5739 | 7 |
| Length DLS V3 | -0,79446 | 0,0590 | 6 |
| Height DLS V3 | -0,13636 | 0,7967 | 6 |
| PED area BL | 0,29106 | 0,0684 | 40 |
| PED volume BL | 0,24748 | 0,1237 | 40 |
| RPE area V1 | 0,13427 | 0,4419 | 35 |
| PED volume V1 | 0,19644 | 0,2580 | 35 |
| PED area V2 | 0,13452 | 0,5406 | 23 |
| PED volume V2 | 0,18046 | 0,4099 | 23 |
| PED area V3 | 0,35784 | 0,2090 | 14 |
| PED volume V3 | 0,17990 | 0,5383 | 14 |
| Best-corrected Visual Acuity (logMAR) at the Time of the Last Visit | |||
|---|---|---|---|
| Parameter | Spearman Correlation Coefficient | p-value | Number of Patients Evaluated |
| Length DLS BL | 0,03000 | 0,8893 | 24 |
| Height DLS BL | 0,24371 | 0,2511 | 24 |
| Length DLS V1 | -0,50000 | 0,6667 | 3 |
| Height DLS V1 | -0,86603 | 0,3333 | 3 |
| Length DLS V2 | 0,15811 | 0,7349 | 7 |
| Height DLS V2 | 0,08284 | 0,8598 | 7 |
| Length DLS V3 | -0,77690 | 0,0399 | 7 |
| Height DLS V3 | 0,34442 | 0,4493 | 7 |
| PED area BL | -0,07392 | 0,6592 | 38 |
| PED volume BL | -0,09246 | 0,5809 | 38 |
| PED area V1 | 0,12598 | 0,4709 | 35 |
| PED volume V1 | 0,12240 | 0,4836 | 35 |
| PED area V2 | -0,02083 | 0,9248 | 23 |
| PED volume V2 | 0,08416 | 0,7026 | 23 |
| PED area V3 | 0,66493 | 0,0068 | 15 |
| PED volume V3 | 0,57677 | 0,0244 | 15 |
A Spearman correlation analysis, which investigates a possible relationship between BCVA at BL and various parameters of the patient cohort, was performed (Table 1). A correlation coefficient > + 0.8 or < -0.8 is found for the length of the DLS at V1.
Table 2 displays a Spearman correlation analysis, which investigates a possible relationship between BCVA at V3 and various parameters of the patient collective. A correlation coefficient > + 0.8 or < -0.8 was not found.
4. DISCUSSION
Chronic congestion of choroidal vessels underlying CSCR is thought to cause hyperpermeability of the choroidal vessels. A resulting increased hydrostatic pressure is thought to trigger PED. There is a wide variation in the literature for the incidence from 53% to 100% in CSCR [2]. The pre-ST-LP frequency of 66% found in this study is more in line with the lower range of frequency described. Taken together with the finding that PED is more common in chronic CSCR [12], this tends to argue against a higher-than-average chronic course in our patient population, which had been predefined by inclusion criteria and consisted of 31% patients with first-manifestation of CSCR with chronic course and 69% patients with recurrence of CSCR [10]. This underlines the rather short current disease period of a median of 9 weeks between symptom onset and ST-LP. This is important because, especially in patients with good visual acuity in both eyes, a visual deterioration of one eye is often noticed with substantial delay and therefore, the history of symptom duration may be distorted.
The frequency of a PED remains constant at V1 compared to baseline and decreases discreetly but continuously at V2 and V3. The area and volume of the PED calculated by Zeiss Forum Software also decreased after ST-LP, and this is already from V1. It seems conclusive that area and volume are already reduced at V1, and the frequency only decreases with V2 since a PED can no longer be detected when the fluid is completely resorbed. It is also striking that the extreme range of variation of both area and volume with measurement outliers towards larger values decreases significantly after ST-LP, indicating efficacy of ST-LP even with large PED. Overall, the size of the area of the PED seems to be more suitable for assessing the extent of a PED than the volume of the PED, as more differentiated values are shown here. Moreover, the volume calculation might be complicated by the internal structure, which changes toward a higher protein content in the reflectivity as the fluid is reabsorbed and thus becomes more similar to the retinal reflectivity [1]. The mechanism of reattachment of a PED is not well understood; however, fluid reabsorption may occur independently of SRF reabsorption [1]. Because a 532 nm laser is not thought to have sufficient penetration depth into the choroid, making congestion and hyperpermeability of the choroid inaccessible to this form of treatment [13], the decrease in frequency, area, and volume of a PED observed here may be attributable to altered RPE with improved pump function. The Fisher exact test cannot demonstrate a dependence of the frequency of a PED on the time of the study, and similarly, the decreases in PED area and volume are not statistically significant, so the observed trend could also be due to chance. However, the evolution of each parameter frequency and area of a PED with a slight continuous decrease seems plausible, as well as the decrease in the volume of the PED. Moreover, all three parameters show the same tendency for change, which could indicate a non-random development.
The double-layer sign is understood as a particular form of PED. The irregular PED from the inner layer of Bruch's membrane [14] could be an expression of loss of elasticity of the basement membrane of the RPE and is, therefore, more frequently observed in chronic CSCR [1]. The frequency of DLS observed before ST-LP is 63%, which is within the range of what has been described in a few publications previously. Sheth et al. reported a frequency of 34% in patients with chronic CSCR [14], whereas Yang et al. found a frequency of 63% in acute CSCR and 87% in chronic CSCR [15]. These marked differences could be caused by different OCT techniques but also different display modes such as color-coded display, gray-scale display, or inverted gray-scale display of the generated retinal scans. The measured median height of the DLS at the time of BL is 40 µm, which corresponds quite exactly to previously published data with 43 µm. Because the height of the DLS in chronic CSCR differs significantly from that in polypoidal choroidal vasculopathy and pachychoroidal vasculopathy [14], the height of the DLS could be used as a criterion for differentiation from other diseases in the pachychoroid group. This is important, for example, with regard to automated pattern recognition. The length of the DLS measured in this work is not comparable with previous studies because of the approach of adequately assessing multiple occurrences of a DLS in a data cube by summing the individual lengths. The quality of the inner space in this study was predominantly is reflective compared with the vitreous. Previously published data indicate a largely hyporeflective interior space, which could be serous fluid, at 80% to 91% [14, 15]. These results do not necessarily contradict each other. For one thing, hyperreflective internal space was found extremely rarely in this and the previously cited studies. For another, the assessment of reflexivity in the present study was subjective rather than objective (densitometric). Also, the OCT technology used may have an influence on the reflectivity behavior. In this study, spectral-domain OCT was used, whereas in the other two studies cited, enhanced depth imaging OCT was used, which allows better assessment of choroidal/deeper structures [16]. This might have resulted in different reflectance behavior in different depth slices.
For the first time, this study investigated the effect of ST-LP with a frequency-doubled Nd: YAG laser with a wavelength of 532 nm on the frequency, length, height, and internal space quality of DLS. The decrease in frequency of DLS from V1 to V2, as well as the decrease in PED and SRF, could be due to the resorption of the fluid in the inner space caused by the ST-LP. The renewed increase in frequency of DLS to V3 is somewhat at odds with the other parameters collected, such as frequency of PED, persistent SRF, and macular thickness and volume. It is conceivable that the recurrence of DLS precedes the accumulation of SRF. This could be due to the anatomic proximity to the choroid and damage to the RPE, as is the case with CSCR [9]. However, a possible re-accumulation of fluid does not necessarily have to be due to a recurrence of CSCR, but could also be caused by a secondary CNV. For example, it has recently been shown that secondary CNV is present in 1/3 of all patients with chronic CSCR and DLS [17, 18]. A secondary CNV was not detected in our study. Precisely to prevent secondary CNV we had chosen the subthreshold approach. The Fisher exact test does not suggest a dependence between the time of examination and the frequency of DLS. This could be due to anincrease in the frequency of DLS at V3. However, it must be noted that the ST-LP was not performed in the area of the DLS but in the area of the source point, so only an indirect effect on the DLS was to be expected.
Both the height and the quality of the internal structure remain roughly the same after ST-LP. The changes in height are not statistically significant, and no dependence on the quality of the internal structure at the time of examination can be detected in the Fisher exact test. Consequently, the composition of the presumed serous fluid does not appear to change in patients in whom the DLS does not regress. The sum of the length of the individual DLS increases significantly up to V2, and the results are statistically significant at V2. From V2 to V3, the sum of the lengths of the DLS decreases significantly but does not remain significantly increased compared with BL. This could reflect a chronic event due to a possible loss of elasticity of the basement membrane of the RPE [14]. If the location of the focal ST-LP is not near the DLS, the disease-altered RPE is unlikely to benefit from ST-LP, and the fluid in the inner space of the DLS is not or insufficiently reabsorbed.
Spearman correlation analysis (SCA) was performed with respect to BCVA before ST-LP and BCVA at the last visit to identify possible correlations with selected parameters. In this work, a Spearman correlation coefficient of > 0.8 or < -0.8 was required to detect a strong association between two characteristic values.
Only the DLS at V1, both before ST-LP and at the time of the last visit, suggests a strong correlation with visual acuity. The strongly changing correlation coefficient of the length of the DLS from BL 0.03 (no correlation) to exactly -1.00000 with a p-value of <0.0001 in relation to the visual acuity at BL could indicate that this correlation is spurious. This could be due to the small number of 3 patients with DLS at time V1. Similarly, the level of DLS at V1 seems to be related to the visual acuity at the last visit.
Neither the area nor the volume of a PED shows evidence of an association with BCVA before ST-LP and at the last visit. PED is presumably due to impaired choroidal circulation and appears to be a component of CSCR disease rather than an independent risk factor for poor BCVA, with a frequency of 53% to 100% of cases [1].
CONCLUSION
We conclude that PEDs and the DLS are common in chronic or recurrent CSCR. The quality of the internal structure of the DLS indicates serous fluid. While the area of PED becomes smaller after ST-LP, the extent of the DLS seems to increase. This could be an expression of a chronic disease progress. DLS with the frequent occurrence of CNV should be given special attention in future studies.
No convincing correlations can be identified between BCVA before ST-LP or at the last visit and different characteristics of PED as well as DLS.
AUTHOR’S CONTRIBUTIONS
GE was responsible for the conception and design of the study. CE and JUW were the major contributors in data collection, wrote the main manuscript text and prepared all figures and tables. BM was responsible for the statistical analyses and added corresponding parts of the manuscript. BM and GE revised the manuscript critically. All authors reviewed and approved the final manuscript.
LIST OF ABBREVIATIONS
| CSCR | = Central serous chorioretinopathy |
| PED | = Pigment epithelial detachment |
| DLS | = Double layer sign |
ETHICS APPROVAL AND CONSENT TO PARTICIPATE
This retrospective study was approved by the local ethic committee of Ulm University (application number 395/15). No experimental procedures were performed.
HUMAN AND ANIMAL RIGHTS
No animals were used in this research. All procedures performed in studies involving human participants were in accordance with the ethical standards of institutional and/or research committees and with the 1975 Declaration of Helsinki, as revised in 2013.
CONSENT FOR PUBLICATION
Due to its retrospective and anonymized design the need for informed consent was waived by the ethics committee of Ulm University.
STANDARDS OF REPORTING
STROBE guidelines were followed.
AVAILABILITY OF DATA AND MATERIALS
The datasets generated and/or analyzed during the current study are not publicly available to avoid infringement of copyright but are available from the corresponding author [C.E]. at a reasonable request.
FUNDING
None.
CONFLICT OF INTEREST
The authors declare no conflict of interest, financial or otherwise.
ACKNOWLEDGEMENTS
Declared none.
SUPPLEMENTARY MATERIALS
Supplementary material is available on the Publisher’s website.