All published articles of this journal are available on ScienceDirect.

Prevalence of Visual Disorders among Urban Palestinian Preschool Children
Authors Info & Affiliations
Abstract
Background:
Childhood blindness is a major public health concern since 40% of visual disorders that can cause blindness among children are preventable. Vision screening programs among preschool children have been implemented in several countries as a tool for early detection and intervention of visual disorders. In Palestine, there is a lack of scientific data on the prevalence of visual disorders among children. In addition, vision-screening programs that are currently implemented are neither validated nor effective.
Objective:
Using validated vision screening protocols, a cross-sectional study is conducted to determine the prevalence of visual disorders among urban Palestinian preschool children between the ages of 3 to 5 years in Nablus city.
Methods:
All children attending eight preschools selected using single-stage cluster sampling technique, underwent a validated vision screening administered by trained eye care professionals. The screening protocol was based on a combination of clinical assessment adopted from the Modified Clinical Technique and the Vision in Preschoolers studies, including assessment of visual acuity, ocular alignment, depth perception, color vision, non-cycloplegic retinoscopy, and ocular health. A pass-fail criterion was used to refer all children who did not attend the vision screening for comprehensive eye examination, including cycloplegic retinoscopy and a dilated fundus exam. A chi-squared test was used to determine any association between visual disorders and their independent risk factors.
Results:
A total number of 764 children underwent vision screening. Out of the 290 children who did not attend the vision screening, 127 children responded to the referral call for comprehensive eye examinations. Refractive error was the most prevalent visual disorder with a prevalence of (29.37%), followed by amblyopia (4.10%), color vision deficiency (1.24%), strabismus (1.24%), and ocular health abnormalities (0.70%). There was no age (p=0.35) and gender (p=0.32) variation in children having refractive errors. Anisometropia was the leading cause for amblyopia (1.32%, n=7), followed by significant refractive error (1.13%, n=6) and strabismus (0.37%, n=2).
Conclusion:
Refractive error was the most prevalent visual disorder affecting Palestinian preschoolers in Nablus. Anisometropia and significant refractive errors were found to be the major causes of amblyopia. Effective nationwide preschool vision screening programs should be implemented in Palestine to screen amblyogenic risk factors.
1. INTRODUCTION
It has been estimated that 1.4 million children (0-14 years) are blind worldwide, and 19 million children are visually impaired [1]. This is a major public health concern, especially since 40% of visual disorders that cause blindness among children are preventable or treatable [2]. Visual disorders that can affect the normal vision development early in childhood include strabismus, anisometropia, refractive error, color vision deficiency and ocular pathology, all of which may lead to the development of amblyopia, one of the most common causes of unilateral vision loss [3, 4]. Early detection is essential to prevent the negative long-term outcomes including loss of educational and employment opportunities, loss of economic gain and impaired quality of life [5].
The prevalence of ocular morbidity among children and adolescents has been reported in the literature largely due to refractive error and amblyopia, which are both treatable. Many childhood vision disorders are asymptomatic and can often go undetected and untreated. Globally, there is a lack of coordinated surveillance of vision disorders among preschool children. In the United States, a descriptive study reporting statistics estimated based on prevalence data from 2 major population-based studies reported that approximately 69% of preschool children aged 3-5 years were visually impaired due to refractive error, and 25% due to bilateral amblyopia [6]. Studies have shown that uncorrected hyperopic refractive error is associated with deficits in early literacy and other essential skills from school [7]. Additionally, the overall rate of amblyopia in the United States has been reported to be at 2% to 3%, well above what it could be if efficient and effective vision screening programs are implemented [8, 9]. Amblyopia is one of the visual disorders that should be detected in the preschool age, as it can lead to irreversible loss of vision if not treated early (Kulp, M. T, 2009).
Vision screening programs have been designed as a tool for early detection and intervention of visual disorders within the critical period of a child’s visual development before the age of 8 years. In fact, the development of vision screening programs with an effective referral scheme is one of the Vision 2020 targets for the control of preventable blindness [10]. Although there is no agreed vision screening protocol worldwide, it is recommended that visual assessment of children should be undertaken at birth, 3-6 months, and at 4 years of age, with a strong recommendation that all children should receive a comprehensive eye examination at these intervals [11, 12].
In Palestine, visual assessment is incorporated in school health programs only. The Palestinian vision screening protocol targets first, fifth and eighth grade school children. This is despite the fact that treatment of visual disorders is known to be more effective, with an increased likelihood of treatment compliance and success if detection is before the age of 5 years [11, 13]. The current protocol does not have the necessary components that are required for an ideal vision-screening program, as recommended by Schmidt et al. It also lacks any scientific evidence of its effectiveness, as it uses inadequate measurement tools and insufficiently trained professionals to conduct vision screenings [3].
With a lack of scientific data available on the prevalence of visual disorders among preschoolers in Palestine and in nearby countries, a cross-sectional study was conducted using validated vision screening protocols to determine the prevalence of visual disorders among urban Palestinian preschool children between the ages of 3 to 5 years in Nablus city.
2. MATERIALS & METHODS
2.1. Study Design & Setting
A cross-sectional study was conducted between January 2017 and December 2018. Eight preschools located in the city of Nablus (153, 061 populations, West Bank, Palestine) allowed the study team to conduct vision screenings on their premises. Children who failed vision screenings were referred for a comprehensive eye examination at the optometry and ophthalmology clinics at An-Najah National University and An-Najah National University Hospital.
2.2. Sample Size Calculation
EpiInfo software version 7 (CDC, Atlanta, GA, USA; https://www.cdc.gov/epiinfo/index.html) was used to calculate the required sample size with a 95% confidence value (z= 1.96), a precision (d= 0.05), and an estimated prevalence of 50% (P= 0.5) since the prevalence of visual disorders among preschoolers in Palestine and nearby countries is unknown. A design effect of version 2 was utilized to reach the required level of statistical power [14, 15]. A total sample size of 768 children was determined, and using a 5% non-response rate, an estimated 806 children needed to be recruited to participate in the study.
2.3. Sampling Technique, Inclusion & Exclusion criteria
A list of all 59 preschools in Nablus city was prepared, with each preschool considered as a cluster. A single-stage cluster sampling technique was conducted using Microsoft Excel to meet the required sample size. Eight preschools were selected, all of which had a similar male to female ratio and equal average number of students. After contacting the preschool principals, the list of all students in each school was obtained, and each student was assigned a unique code in a continuous manner. Finally, a total of 806 children, as indicated in the sample size calculation, were selected. Vision screening was performed on all 3-5 years old children attending each preschool. Children without any neurological disorders were included. Subjects absent on the day of screening and those who did not receive parental consent to participate in the study were excluded.
2.4. Data Collection-Vision Screening
A self-administered questionnaire was obtained from parents of all children enrolled in each preschool. It was formulated based on the questionnaire administered in the Orinda study [16] and then modified to achieve the objectives of this study. The questionnaire was translated to Arabic language using forward and backward translation. For validation purposes, the questionnaire was sent to one pediatric ophthalmologist and one general ophthalmologist, and a final validation was conducted through a pilot study on a small group of children [17]. The questionnaire consisted of 75 questions designed to assess the child’s demographical data, social, medical and ocular history.
All eligible children underwent a vision screening program that was based on a combination of clinical assessments from the Modified Clinical Technique (MCT) [18] and Vision In Preschoolers (VIP) study [19]. The screening battery adopted from the MCT program included non-cycloplegic retinoscopy (NCR), cover test, stereopsis and external and internal ocular health evaluation. The screening battery adopted from the VIP program included distance visual acuity using Lea Symbols. In addition, procedures that were not included in the MCT or the VIP battery were added, including near visual acuity and color vision assessment. Forty trained 4th year optometry students, under the supervision of licensed eye care professionals, conducted all procedures during the vision screening. A pass-fail criterion adopted from the MCT study was used to determine whether the child passed the vision screening [16]. Any child who initially failed the vision screening was re-checked by the eye care supervisor to confirm screening results. A report of ocular findings was sent to parents of all children who passed the vision screening. All children who failed the vision screening were provided with reports of ocular findings and referred for comprehensive eye exams.
Monocular visual acuity (VA) was measured with Lea Symbol charts (Good-Lite Company, Elgin, Illinois) at 40cm and 3m. Color vision was assessed using Ishihara pediatric 8 plates (Western Ophthalmic, Lynwood, Washington). Randot Stereotest (Stereo Optical, Chicago, Illinois) was performed at 40cm, with the child wearing a 3-D viewer and with the test book properly adjusted so that the visual axis of the child is vertical. Unilateral and alternating cover test was performed using non-accommodative targets during the screening at 40cm and 3m. NCR was performed at 67cm in a dim-lit room using a streak retinoscope (Welch Allyn, Skaneateles Falls, New York), lens bars, +1.50D fogging glasses, and a non-accommodative 3m target. External and internal ocular health evaluation was assessed using a Welch Allyn ophthalmoscope or panoptic (Welch Allyn, Skaneateles Falls, New York).
The MCT has 98% sensitivity and 99% specificity, and is considered to be the best choice for any screening program till now as it has the best advantages and least disadvantages compared to other screening programs. The sensitivity for each screening test utilized to detect amblyopia, strabismus, refractive error and reduced visual acuity is shown in Table 1 (Peters, 1984).
2.5. Data Collection - Comprehensive Eye Examination
Experienced optometrists and ophthalmologists conducted comprehensive eye exams. A full medical and ocular case history was taken for all children referred. Distance VA, near VA, color vision, and stereopsis were re-assessed in the same manner they were assessed during the vision screening. The cover test was performed using Lea Symbols at 3m and a Lang fixation stick (Lang-Stereotest Company, Kusnacht, Switzerland) at 40cm. Cycloplegic retinoscopy was performed at 67cm in a dim-lit room using a Welch Allyn retinoscope, lens bars, +1.50D fogging glasses, and a 20/400 accommodative target. Cycloplegia was induced with 1-2 drops of Cyclogyl 1% (Alcon Pharmaceuticals Ltd, Switzerland), and retinoscopy was re-assessed 40-60 minutes after drop instillation. External ocular health was performed using slit-lamp examination, and dilated fundus examination was performed with a direct ophthalmoscope or Welch Allyn panoptic ophthalmoscope. Cycloplegic drops were administered on all children, except in cases of parental refusal or when concerns of side effects were evident.
2.6. Study Variables
Visual disorders including strabismus, anisometropia, refractive error, amblyopia, color vision deficiency and ocular health pathology were classified as dependent variables. Independent risk factors associated with these visual disorders were reviewed and considered in the development of the self-administered questionnaire and case history [20-23].
2.7. Data Management
Refractive error was defined as having one of the following: hyperopia >2.5D, myopia < -1.00D, astigmatism ≥1.5D, and oblique astigmatism ≥1.00D [19-21, 24]. Additionally, refractive error was further classified into its subtypes: simple hyperopia, compound hyperopic astigmatism, compound myopic astigmatism, simple hyperopic astigmatism, simple myopic astigmatism, mixed astigmatism, oblique astigmatism, simple myopia and anisometropia. Reduced VA (unilateral and bilateral), amblyopia (unilateral and bilateral), and strabismus were defined according to the data supported from the VIP Study and the Multi-Ethnic Pediatric Eye Disease Study [19, 25]. Latent strabismus (phoria) was defined according to the MCT vision screening referral criteria. A Randot stereoacuity of 100 seconds of arc was defined as the normal range. Color vision deficiency was defined according to the Ishihara Color Test 8 Plate manual. Any anterior or posterior ocular disease was considered abnormal. Table 2 gives an overview of the definition criteria that were utilized to determine the final diagnosis of visual disorders during the comprehensive eye exam.
2.8. Statistical Analysis
Data was entered and analyzed using the SPSS version 22 software program. Double-entry with automatic checking for mismatches was utilized to ensure the accuracy of data entry. Percentage and 95% confidence interval were used to describe the prevalence and distribution of visual disorders among all preschoolers who passed the screening and underwent comprehensive eye exams. Chi-squared test was applied to determine any association between visual disorders and their independent risk factors. A p-value of < 0.05 was considered statistically significant.
| Screening Test |
Overall Sensitivity |
Amblyopia | Reduced VA | Strabismus | Refractive Error | Specificity |
|---|---|---|---|---|---|---|
| Lea symbol VA test | 61% | 76% | 58% | 56% | 70% | 90% |
| NCR | 64% | 85% | 47% | 56% | 81% | 90% |
| Cover test | ___ | 27% | 6% | 60% | 16% | 98% |
| Randot stereopsis | ___ | 44.4% | ___ | ___ | ___ | 98.4% |
| Visual Disorder | Definition |
|---|---|
| Refractive error | |
| Hyperopia | >2.5D [24] |
| Myopia | < -1.00D [19] |
| Astigmatism | ≥1.5D [19] |
| ≥1.00D for oblique astigmatism [19] | |
| Reduced Visual Acuity [19, 25] | |
| Unilateral | VA <20/40 in only one eye or ≥2-line difference between the two eyes with no unilateral amblyogenic risk factor |
| Bilateral | VA <20/40 in one eye and <20/30 in the contralateral eye with no bilateral amblyogenic risk factor |
| Amblyopia (Refractive, deprivation or strabismic) [19, 25] | |
| Unilateral | 2 lines difference in BCVA in the presence of unilateral amblyogenic factor |
| Bilateral | BCVA <20/40 in one eye and <20/30 in the contralateral eye, in the presence of bilateral amblyogenic risk factor |
| Amblyogenic risk factors [23] | |
| Isoametropic | >8.00D myopia |
| Significant Refractive | >5.00D hyperopia |
| Error | >2.50 astigmatism |
| Anisometropic | >3D myopia |
| Significant Refractive | >1D hyperopia |
| Error | >1.50D astigmatism |
| Strabismus | Any prism diopter of heterotopia in primary gaze, whether it was constant, intermittent, or alternating at both near and distance, combined with a reduction in VA |
| Deprivation | Any deprivation stimulus including cataract, corneal opacity, vitreous hemorrhage, etc. |
| Binocular Vision Dysfunction | |
| Strabismus | Any prism diopter of heterotopia in primary gaze, whether it was constant, intermittent, or alternating at both near and distance [19, 25]. |
| Esophoria | >5 for distance [26] |
| >6 for near [26] | |
| Exophoria | >5 for distance [26] |
| >10 for near [26] | |
| Color Vision Deficiency | Failure criteria based on the manual of the Ishihara Color test (8 Plate) |
| Ocular health abnormalities | Any disease in the anterior or/and posterior segment of the eye |
| Stereoacuity | Worse than 100 seconds of arc |
| Demographical Characteristics | N (%) |
|---|---|
| Gender | |
| Female | 332 (45.7) |
| Male | 395 (54.3) |
| Age | |
| Five years | 403 (55.4) |
| 4 years | 266 (36.6) |
| 3 years | 58 (8.0) |
| Residency | |
| City | 501 (75.3) |
| Refugee camp | 113 (17) |
| Town | 26 (3.9) |
| Village | 25 (3.8) |
3. RESULTS
3.1. Vision Screening Results
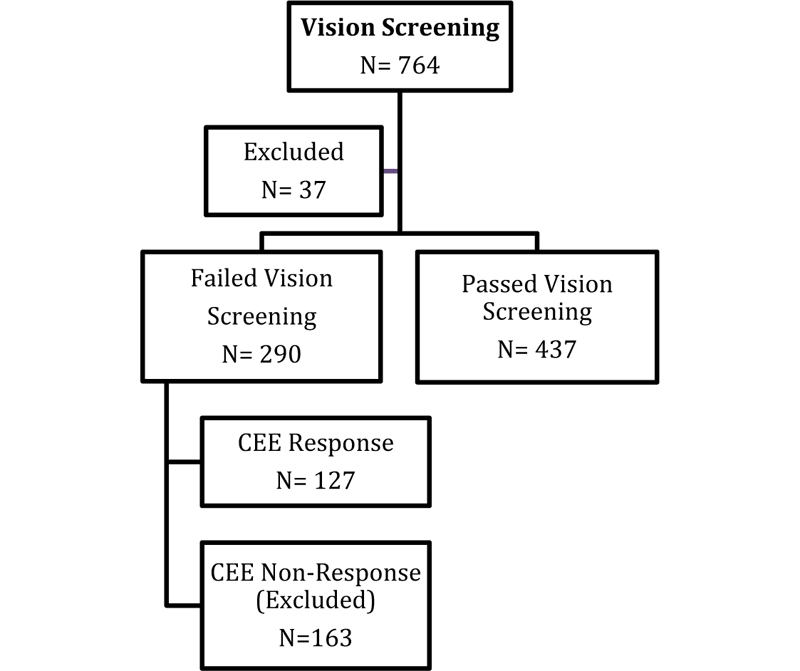
A total of 764 children between 3 to 5 years old underwent vision screening at 8 preschools in Nablus city, Palestine. Thirty-seven participants (n=37, 4.84%) were excluded due to reasons that varied between parental refusal to enroll their children in the study and children not meeting the age criteria. Most participants included in the sample were 5 years old and resided in the city of Nablus. Table 3 shows the demographic characteristics of participants.
3.2. Response Rate
The total number of participants who failed the vision screening was (n=290, 40%). Only 127 of those responded to the call for comprehensive eye exams, resulted in a response rate of 44%. Thus, the total sample size included in the prevalence calculations is 564 participants, including those who passed the vision screening (n= 473) and those who responded to the call for comprehensive eye exams (n= 127). The flow chart in Fig. (1) indicates the number of participants at each stage of the study.
3.3. Referral Reasons
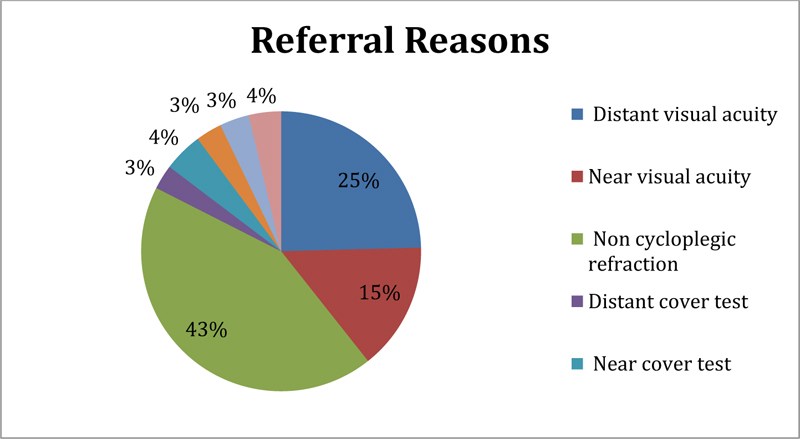
Reasons why participants who failed the vision screening were referred for comprehensive eye exams included not meeting the passing criteria used for NCR assessment (n=312, 43%) and for Distance VA assessment (n=182, 25%), as shown in Fig. (2). Cover Test abnormalities, color vision problems, and reduced stereoacuity were the least common causes for a referral. A small number of participants (n=29, 4%) failed the vision screening due to the inability to cooperate with the study team during the assessment.
3.4. Comprehensive Eye Exam Results
3.4.1. Prevalence of Refractive Errors
Of the 127 participants included, the prevalence of overall refractive error was 29.37%. Utilizing the refractive error definition criteria is shown in Table 2, results showed that 63 participants (11.17%) had astigmatic dioptric power, 50 participants (8.86%) had hyperopic dioptric power, and 2 participants (0.35%) had myopic dioptric power. There was no age (p=0.35) and/or gender (p=0.32) variation in children having refractive errors. Table 4 shows the prevalence of refractive error types, according to the definition criteria, among the participants.
When the refractive error was further classified into its various subtypes, 92 participants (16.3%) had compound hyperopic astigmatism, 24 (4.25%) had anisometropia, and 16 (2.83%) had simple hyperopia, as shown in Table 5.
| Refractive Error | N (%) | Participants (%) | |
|---|---|---|---|
| OD | OS | Total | |
|
Hyperopic Dioptric Power (D) <1.50 1.50-2.50 2.75-5.00 >5.00 |
51(9.04) 18(3.19) 33(5.85) 13(2.30) |
53(9.39) 18(3.19) 33(5.85) 15(2.65) |
54(9.57) 21(3.72) 35(6.20) 15(2.65) |
|
Astigmatism Dioptric Power (D) <1.5 1.5 – 2.50 2.75-5.00 >5.00 |
80(14.18) 24(4.25) 16(2.83) 6(1.06) |
79(14.0) 26(4.60) 15(2.65) 6(1.06) |
83(14.71) 33(5.85) 21(3.72) 9(1.59) |
|
Myopic Dioptric Power (D) <0.50 0.50-1.00 1.00- 8.00 >8.00 |
4(0.70) 2(0.35) 0(0.00) 1(0.17) |
4(0.70) 2(0.35) 1(0.17) 0(0.00) |
4(0.70) 2(0.35) 1(0.17) 1(0.17) |
| Refractive Error Types | N (%) | Participants (%) | |
|---|---|---|---|
| OD | OS | Total | |
| Simple Hyperopia Compound hyperopic astigmatism Compound myopic astigmatism Simple hyperopic Astigmatism Simple Myopic Astigmatism Mixed Astigmatism Oblique Astigmatism Simple Myopia Anisometropia |
11(1.95) 81(14.3) 2(0.35) 2(0.35) 2(0.35) 14(2.48) 9(1.59) 2(0.35) ----- |
12(2.12) 85(15.0) 1(0.17) 3(0.53) 1(0.17) 14(2.48) 9(1.59) 0(0.0) ----- |
16(2.83) 92(16.30) 2(0.35) 4(0.70) 2(0.35) 15(2.65) 9(1.59) 2(0.35) 24(4.25) |
| Type of Amblyopia | N (%) |
|---|---|
| Aneisometropic Significant Refractive Error Isoametropic Significant Refractive Error Strabismus Deprivation |
7 (1.32) 6 (1.13) 2 (0.37) 0 (0.0) |
| Bilateral DVA Reduction | N (%) |
|---|---|
| Caused by refractive errors and/or Amblyopia | 24 (20.7) |
| Unknown cause | 4 (3.40) |
| Unilateral DVA reduction category | N (%) |
| Caused by refractive errors and/or Amblyopia | 9 (7.80) |
| Unknown cause | 5 (4.30) |
3.4.2. Prevalence of Amblyopia
There were 15 participants (2.84%) in the study who met the amblyopia definition. A diagnosis of amblyopia was not determined for 36 participants who were lost to follow up following their initial visit for comprehensive eye exams and thus were excluded from amblyopia prevalence calculations. Anisometropia was the leading cause for amblyopia (n=7, 1.32%), followed by isoametropic significant refractive error (n=6, 1.13%) and strabismus (n=2, 0.37%). Prevalence of amblyopia types is shown in Table 6.
3.4.3. Prevalence of Visual Acuity Reduction
A total of 28 (24.1%) participants met the criteria for reduced bilateral DVA reduction, and for the majority of them (n=24, 20.7%), this was caused by refractive error and/or amblyopia. Only 14 participants (12.10%) met the criteria for unilaterally reduced vision. Table 7 shows the prevalence of reduced bilateral and unilateral vision according to its cause.
3.4.4. Prevalence of Binocular Abnormalities, Color Vision Defects, and Ocular Health Problems
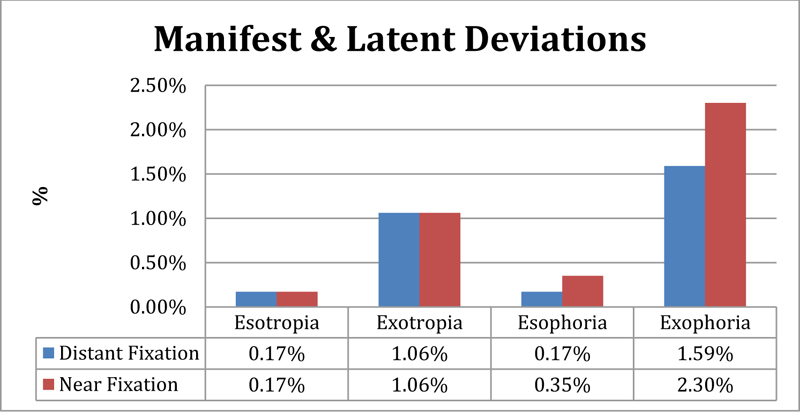
The overall prevalence of binocular vision abnormalities was (n=44, 7.79%), where (n=7, 1.24%) of participants had strabismus, and (n=25, 4.43%) had phoria (latent strabismus), as shown in Fig. (3). High phoria was reported to be associated with spending more than 3 hours of daily near and intermediate work tasks, including watching TV and playing on the computer (p= 0.020). Among the strabismic participants, 3 were diagnosed with accommodative refractive esotropia, 2 had left constant esotropia, and one had right constant exotropia. Stereoacuity of less than 100 seconds of arc was reported in (n=12, 2.12%) participants. Strabismus (p=0.000), amblyopia (p=0.000), and significant refractive errors (p=0.000) were all shown to be significantly associated with reduced stereoacuity.
Anterior segment pathology was noted in (n-4, 0.70%) of participants, including one child with insignificant corneal scarring, one child with significant corneal scarring secondary to an adenoviral infection, and one child with upper lid chalazion. No internal ocular health pathology was detected among the participants.
The prevalence of color vision deficiency among participants was (n=7, 1.24%), with all children having color deficiency being males (p=0.000) and reported to have learning difficulties (p=0.008).
4. DISCUSSION
Visual disorders including refractive errors (RE), anisometropia, amblyopia, strabismus, ocular pathology and color deficiency, had an overall prevalence rate of 36.3%. Refractive error was the most common visual disorder reported in this study. Refractive errors, if remain uncorrected, can lead to clinically identified deficits in cognitive and visual motor functions that may ultimately affect school performance [27]. Compound hyperopic astigmatism, with a prevalence of 16.30%, was reported to be the most common type of RE in our population, while myopia, with a prevalence rate of 0.35% was reported to be the least, and 8.69% of our population had significant amblyogenic RE. Different types and prevalence rates for RE were reported worldwide and in Middle East countries, and estimates varied due to differences in diagnostic criteria, assessment methods and study designs. Hyperopia was found to be the most common type of refractive error in white and African American preschoolers according to the Baltimore pediatric eye study, with a prevalence of 8.9% and 4.4%, respectively [28]. Higher hyperopia prevalence was also reported in Iran and Macedonia [29, 30]. On the other hand, in Turkey, astigmatism was the most common type of RE in school age with a prevalence rate of 14.3%, while myopia has been reported as an epidemic disease in countries like China and Nepal, where the prevalence of myopia is 15.8% and 48%, respectively [31-33].
It should be noted that in this study, astigmatism was reported according to its classifications (compound hyperopic astigmatism, compound myopic astigmatism, mixed astigmatism, etc.), while this was not the case in all other studies reviewed except for the Kuching Pediatric Eye Study in Malaysia, which utilized a different screening methodology than our study [34]. This would explain the different prevalence of hyperopia and astigmatism in this study compared to other countries. Among nearby Arab countries, two studies reported the prevalence of RE in Jordan and Egypt, but the study population included school age children [35, 36]. A study of Saudi Arabian children between 4 to 8 years of age has been conducted but without using cycloplegia, making it difficult to make any comparisons with our study [37].
In this study, anisometropia had an overall prevalence of 4.25%, higher than that reported in preschool middle eastern Australian children in which the definition for anisometropia was different from the one utilized in our study. The Australian study reported prevalence values of anisometropia among different ethnic groups to be 3.00% in European-Caucasians, 1.90% in East-Asians, 5.20% in South-Asians, and 3.60% among Middle-Eastern children between the ages of 6 to 72 months [38].
Amblyopia was diagnosed in 4.10% of preschoolers in our study, with most of the participants having unilateral refractive amblyopia (1.91%) and bilateral refractive amblyopia (1.64%). Amblyopia rates varied from one country to another, where it has been reported to be 3.95% in China, 1.7% in Iran, and 0.8% in African-Americans, and 1.8% in White Americans [28, 29, 32]. It should be noted that the protocol used in this study required an additional follow-up visit following the release of spectacles to determine whether VA improvement had been achieved. In some cases, parents did not show up for follow-up appointments, and this may have caused unreliable prevalence results for amblyopia.
Our reported prevalence of strabismus (1.24%) was similar to that reported in Iran (1.3%) and South Africa (1.2%) [29, 39]. In this study, distance phoria was reported to be 1.76%, and near phoria was reported to be 2.65%, where exophoria was more common at both distance and near. Available studies on the prevalence of latent deviation among preschoolers and school age children reported a higher prevalence of latent deviation compared to our study. In Serbia, distance exophoria and near esophoria were equally represented to be 3.3%, and near phoria was reported to be 84.7% among preschool children [40]. Similar results were also reported among 4 to 15-year old Swedish children, where latent deviation was reported to be 26% at near and distance [41]. The reason for this high prevalence can be explained by the fact that the criteria used for heterophoria diagnosis in those studies were different than the one used in this study.
The prevalence of color vision deficiency (CVD) in this study was 1.24% compared with 1.4%, 3.1%, 2.6%, and 5.6% for African Americans, Asians, Hispanics, and White American preschoolers, respectively [42]. In this study, CVD was diagnosed using only Ishihara 8 plates test, which recommends re testing any preschool child diagnosed with CVD with advanced color vision tests in 2 years to confirm and classify the diagnosis. Interestingly in this study, CVD was found to be associated with learning difficulties (p= 0.008). Although this has been reported in previous studies, the presence of a CVD may serve only to exacerbate an already established learning problem, especially since many children with CVD develop adaptive and alternative cues to distinguish colors with minimal interference with learning abilities [43].
The low prevalence of internal and external ocular health abnormalities among our population was similar to that reported in Sweden [44]. This may be explained by the parental refusal to include children with pre diagnosed significant ocular abnormalities in the vision screening. Two children with retinal abnormalities and congenital cataracts were excluded from the study due to parental refusal. In addition, an ophthalmoscope was used in this study to examine the posterior pole. Thus, peripheral retinal abnormalities in this population may have been underestimated.
Approximately 43% of children participating in our study failed vision screenings due to abnormal NCR results, while only 25% failed to abnormal DVA results. The current screening protocol in Palestine relies only on the detection of refractive error through measurement of distance VA, which is effective for the detection of myopia but has low sensitivity for detecting hyperopia and astigmatism [45]. This is significant because our study results show that compound hyperopic astigmatism is the most common RE among the population examined, and hyperopia is a major risk factor for amblyopia, strabismus and has been linked with poor academic performance [45-50]. Screening for distance VA alone can miss up to 40% of children with other visual disorders such as hyperopia, binocular vision dysfunctions, or ocular disease [51]. NCR, near VA, cover test and the replacement of Snellen acuity with linear crowded Lea symbol VA charts at 3m are the recommended assessments that should be added to the current vision screening battery in Palestine, as they are reported to have the highest sensitivity for detecting children with amblyopia, strabismus, significant refractive error and/or unexplained reduced visual acuity [19, 52]. Such modifications will require eye care professionals to be involved in conducting vision screenings.
The Palestinian Ministry of Health (MoH), along with the Ministry of Education, must implement changes in its current vision screening protocols to ensure validity and effectiveness by adopting the criteria for an ideal vision screening program [3]. A national screening program must be implemented in preschools at the age of 3 years, and during the first grade of each school year. This recommendation is supported by studies that indicate that prevention of amblyopia development and treatment compliance and success is much more effective if screening is implemented between 2-5 years of age [11, 26]. Screening of 3 years old children is highly effective since this age group will more likely attend preschool programs and have the necessary communication skills that allow them to be assessed adequately [3]. Targeting children during their first year at school will additionally ensure higher coverage because of mandatory school attendance [52-54].
The major limitation of our study was the low response rate to follow-up. Noncompliance with follow-up care after vision screenings has been reported by multiple studies to be between 30%-50% in the literature, which is similar to the response rate of 44% reported in our study [55-59]. This could be due to logistic difficulties to schedule follow-up appointments since our study team relied on volunteers to conduct and keep up with appointments. In addition, the lack of parental understanding of the importance of eye care for children could have also contributed to the failure of parents to adhere to follow-up appointments [55, 56, 60-62]. It is possible too that parents felt more comfortable in taking their children to other eye care practitioners for follow-up care. However, our results did not find any statistical significance between the two groups (children who responded and who did not respond).
The prevalence of visual disorders reported in this study is not representative of the entire Palestinian population due to the small sample size. It was difficult to compare this study’s prevalence results with other studies, especially since studies differ in population age, procedure, protocol, and most importantly, different visual disorder diagnostic criteria. Future studies should be conducted across the Occupied Palestinian Territories, specifically in areas that lack access to health care to get a more representative prevalence value. In addition, incorporating parental awareness and educational components to the vision screenings may be one way utilized to improve adherence to follow-up rates in the future.
CONCLUSION
Refractive error was the most common visual disorder among Palestinian preschool children in an urban setting. Uncorrected refractive error is associated with learning problems, and thus early diagnosis and management before the child enters the school system are essential. An effective and evidence-based national preschool vision screening program must be implemented and adopted by the Palestinian Ministries of Health and Education in accordance with the Vision 2020 initiative of disease control and preventative eye care in an effort to control childhood blindness. Awareness campaigns at the family, community, and public health levels will be integral to any screening program to ensure that children are receiving proper ocular evaluations by eye care professionals following initial screening referrals.
LIST OF ABBREVIATIONS
| VI | = Visual Impairment |
| MCT | = Modified Clinical Technique |
| VIP | = Vision In Preschoolers |
| NCR | = Non-cycloplegic retinoscopy |
| VA | = Visual Acuity |
| BCVA | = Best-Corrected Visual Acuity |
ETHICS APPROVAL AND CONSENT TO PARTICIPATE
This study was approved by the Instituional Review Board committee at An-Najah National University, Palestine.
HUMAN AND ANIMAL RIGHTS
No animals were used in this research. All human research procedures were followed in accordance with the ethical standards of the committee responsible for human experimentation (institutional and national), and with the Helsinki Declaration of 1975, as revised in 2013.
CONSENT FOR PUBLICATION
All consent forms entailing study objectives and significance were provided to parents in the Arabic language to ensure they fully understood what their participation required. Written permission to conduct preschool vision screenings was also obtained from the Palestinian Ministry of Education. In addition, oral permission was obtained from the administration of each randomly selected preschool before the initiation of the vision screening. Parental informed consent was obtained prior to vision screenings.
STANDARDS OF REPORTING
STROBE guidelines and methodologies were followed in this study.
AVAILABILITY OF DATA AND MATERIALS
The data supporting findings of this study is present within the article.
FUNDING
None.
CONFLICT OF INTEREST
The authors declare no conflict of interest, financial or otherwise.
ACKNOWLEDGEMENTS
Declared none.

