All published articles of this journal are available on ScienceDirect.

Comparison of Measured Fusional Vergence Amplitudes using Prism Bar and Synoptophore in Sudanese Patients with Near Exophoria
Abstract
Background:
Assessment of the fusional vergence amplitudes constitutes one of the most important diagnostic tools to obtain information about the ability to maintain binocular vision. Several techniques can be used to assess this function. However, those methods are not interchangeable, and the measurement repeatability has been questioned.
Objective:
This study aimed to compare fusional vergence range measurements using prism bars and synoptophore in Sudanese patients with near exophoria
Methods:
The study was a comparative cross-sectional hospital-based, performed in the binocular vision clinic at the Al-Neelain Eye Hospital. Fusional vergence amplitudes (positive and negative) were measured on 122 patients (67 females and 55 males), and the mean age and standard deviation were 16.79 ± 5.22 years old using prism bar and synoptophore methods.
Results:
The findings showed that the higher positive fusional vergence was obtained using the synoptophore method (24.7 ± 7.2 Δ base-out), whereas the prism bar method provided the lower finding (22.6± 7.6 Δ base-out). Conversely, the prism bar method revealed a higher measurement for negative fusional vergence (13.9± 3.9 Δ base-in) than the synoptophore method (12.7± 3.7 Δ base-in). Using the t-test, significant differences were found between all measurements with the two techniques, P<0.05. Measurements of positive and negative fusional vergence amplitudes by the two methods showed no relationship between age and fusional vergence, P>0.05.
Conclusion:
Given the significant difference in the results obtained between the two methods for measuring the positive and negative fusional vergence amplitudes, caution should be taken when making decisions regarding fusional vergence assessment in patients with latent and manifest strabismus.
1. INTRODUCTION
Measuring the strength of Fusional Vergence (FV), positive and negative, constitutes one of the main diagnostic tools to get information about the ability to maintain normal binocular vision [1, 2]. Moving the eyes away from bi-foveal fixation is called phoria (latent strabismus) and is controlled by the strength of FV; Positive Fusional Vergence (PFV) plays a part in controlling exophoria, and Negative Fusional Vergence (NFV) controls esophoria [3, 4]. The FV is responsible for maintaining latent strabismus compensation, consequently assessing what proportion of the total vergence amplitude is required to control a deviation, which is important to eye care professionals [5]. The FV represents the amount of convergence and divergence that can be induced before fusion is lost and the patient maintains binocular single vision [2, 4]. Fusion has two types, sensory fusion is the ability of persons to perceive an image formed on each retina at the same time, while motor fusion is a foundation for eye alignment combined with sensory fusion and stereopsis; both types of fusion are innervated by the oculomotor nerve [1, 3, 6].
In binocular vision clinics, FV is commonly measured at near and distance fixation with variable prism devices, a prism bar, and synoptophore [3, 7, 8]. FV amplitudes measure the extent to which a subject can keep the binocular vision in the presence of gradually increasing vergence demands [9]. The prism power is slowly increased until binocular single vision cannot be maintained, and the subjects will report diplopia (breakpoint) [1, 10]. Noorden and Campos reported that the simulation by prism leads to an increase in the strabismic angle and the breakpoint estimates the amount of deviation the patient can compensate for before eye misalignment [11]. The point at which patients report blurring is known as the (blur-point) and assesses the limits within which accommodation could maintain the fixation point despite increased convergence [1, 11]. Then the prism power is gradually decreased until the patient reported a single image (recovery point). Noorden and Campos stated that the compensated heterophoria must have a recovery point between 2 to 4 prism dioptres (PD) lower than the breakpoint [1, 11].
No validated procedure presents the measurement of the FV amplitudes. However, numerous previous studies report how FV ranges can be measured using different methods such as prism bar, rotary prism, and synoptophore [5, 12]. Earlier studies [13-15] recommended that the most common clinical technique to assess FV range is first measuring NFV, followed by a measurement of PFV to avoid the effect of excessive stimulation on convergence. Despite many measurement methods that can be used to assess FV amplitudes. Nonetheless, those techniques are not interchangeable, and measurement repeatability has been questioned [5]. Fray [13] reported that many of the orthoptist respondents were assessing FV amplitudes using a prism bar. However, other optometrists use synoptophore as an alternative method for measuring FV amplitudes. Thus, this study aimed to compare measured FV amplitudes using prism bars and synoptophore in Sudanese patients with near exophoria.
2. MATERIALS AND METHODS
2.1. Study Design and Setting
The study was a comparative cross-sectional performed in the binocular vision clinic at the Al-Neelain Eye Hospital between February and July 2020.
2.2. Sample
The sample comprised 67 females and 55 males with a mean age of 16.79± 5.22 (range, 10 to 30 years. The mean spherical equivalent for the right eye was (-0.63 ± 1.33D), and (-0.62 ± 1.27D), for the left eye. Measurements of the FV amplitudes were obtained from 122 Sudanese patients who met the study's inclusion criteria.
2.3. The Inclusion and Exclusion Criteria
The inclusion criteria for the study were exophoric subjects who agreed to take part in the study and who signed the consent form, having Visual Acuity (VA) 6/6 in both eyes with correction (if existed) of no amblyopia, strabismus, microtropia, ocular pathology, history of corneal trauma, corneal refractive surgery, and systemic disease (e.g., hypertension, diabetes).
2.4. Ethical Considerations
Ethical approval was obtained from the Al-Neelain University Research Ethics Committee Ref (19-12-06), and the study was performed according to the Declaration of Helsinki guidelines. Informed consent was obtained from all subjects, and the aim of the study was explained to them. The collected data were saved confidentially, and no individual information was obtained.
2.5. Data Collection Procedures
Before measuring the FV amplitudes, demographic information, history, and symptoms were collected from all participants, followed by measurement of VA at near and distance. The cover test was performed at near fixation (33 cm) to assess any heterophoria and to measure the size of the deviation using Maddox Wing. The subjects underwent ocular motility tests to evaluate the integrity of the eye muscles. Objective refraction of each subject was assessed using retinoscopy (NeitzRX, Japan) and then refined with subjective refraction, which included the best vision sphere, Jackson cross-cylinder technique, and binocular balancing using the alternate occlusion [16]. The subjects with refractive errors were given their best vision correction and wore it during all FV amplitude measurements. FV amplitudes were measured binocularly using the two techniques, prism bar, and synoptophore. The testing sequence was randomized for all subjects.
A pilot study was conducted outside the main area of the study with 20 subjects and was not included in the study sample. Measurements were performed using all two methods by a single examiner to assess the repeatability of the test. The two procedures are described independently below.
2.5.1. Prism Bar
Fusional Vergence amplitudes PFV and NFV were measured using a prism bar at 33cm and it is considered gold standard test for measuring FV. In the current study, NFV was measured first to control the effect of excessive stimulation on convergence [5]. The prism bar (Base-in for measuring NFV and Base-out for measuring PFV) was moved downwards at the speed of about one step per two seconds, and the prism power slowly increased until the patient reported double vision when the “breakpoint” was reached, the first prism value at which the patient was unable to fuse the target was registered as the breakpoint. In the current study, the target for the prism bar used for measuring FV amplitudes was accommodative, and it is the size equivalent to the vision of 6/6 at 33 cm. All measurements were taken in the binocular vision clinic by the same examiner, who performed all tests using the same method [3].
2.5.2. Synoptophore
Synoptophore is an instrument for the assessment and treatment of ocular motility disorders, which includes the following: grades of the binocular single, objective and subjective angle of deviation, and horizontal and vertical FV amplitudes [5]. In the present study, to compensate for the problem of measuring FV amplitudes from zero positions of the visual axes by synoptophore, we added -3.00DS to each tube for stimulating accommodation or to change viewing at a distance corresponding to 33 cm. In this study, fusional convergence and divergence amplitudes were measured using a synoptophore about 40 minutes after the prism bar examination to allow sufficient time for recovery of fusion. Horizontal fusional vergence (PFV and NFV) was measured with fusion slides subtending a visual angle of 6 degrees horizontally and 8 degrees vertically [17]. Again, NFV was measured first to control the effect of excessive stimulation of convergence on the findings. The breakpoints were measured using the synoptophore and were recorded in prism dioptres.
2.6. Data Analysis
The data were entered into an Excel sheet, and descriptive statistical analysis was performed using SPSS version 24 (Inc., Chicago, IL, United States) and Excel. Paired t-tests and correlation analysis were used to compare the mean findings from the prism bar and synoptophore. Wilcoxon tests were used for ordinal data, with p < 0.05 considered statistically significant in this study.
3. RESULTS
A total of 122 Sudanese exophoric patients aged between 10 to 30 years, with a mean age of 16.79 ± 5.22 years, met the inclusion criteria for the study. Based on subjective refraction, the mean of the right and left spherical equivalents was (-0.63 ± 1.33D), and (-0.62 ± 1.27D), respectively. The subjects were classified according to the spherical equivalent as 40 emmetropic (-0.25 to +0.50 D), 22 myopic (≥-0.50 D), 13 hyperopic (≥ +0.50 D), and 47 astigmatic (≥ +-.50 D). Of the 122 patients, 67 (54.9%) were females and 55 (451%) males. There was no significant difference between the mean ages of the male and female subjects (p = 0.053).
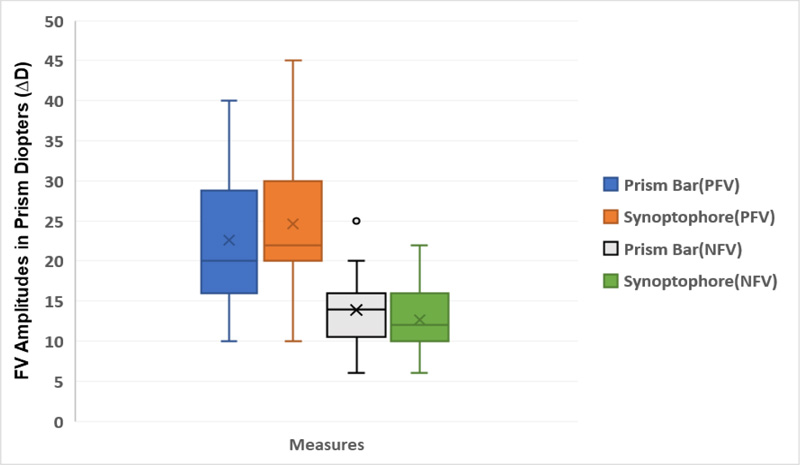
Table 1 shows the descriptive analysis for the prism bar and synoptophore measurements for fusional vergence amplitudes (PFV and NFV). The Shapiro–Wilk test revealed that the measurements of the fusional vergence amplitudes were distributed normally with a p > 0.05. All measurements were taken binocularly, means PFV amplitudes ranged from 24.7 (95% CI, 23.2–26.2) Δ base-out to 22.6 (95% CI, 21.1–24.1) Δ base-out; the synoptophore had the highest average, while the prism bar method had the lowest average. However, the means NFV amplitudes ranged from 13.9 (95% CI, 13.1–14.7) Δ base-in to 12.7 (95% CI, 12.0–13.4) Δ base-in; the prism bar method had the highest average, while the synoptophore had the lowest average as shown in Fig. (1).
| Statistics |
Prism Bar PFV (95% CI) |
Synoptophore PFV (95% CI) |
Prism Bar NFV (95% CI) |
Synoptophore NFV (95% CI) |
|---|---|---|---|---|
| Means | 22.6(21.1- 24.1) | 24.7(23.2- 26.2) | 13.9(13.1- 14.7) | 12.7(12.0- 13.4) |
| Standard deviations | 7.6(6.7- 8.4) | 7.2(6.1- 8.2) | 3.9(3.4- 4.4) | 3.7(3.1- 4.0) |
| Skewness | 0.5 (.17 - .79) | 0.7(0.28- 1.) | 0.4(-.03- .79) | 0.7(0.4 -1.1) |
| Kurtosis | -0.5(-.99- 1.0) | 0.04(-0.65- 1.0) | -.1(-1.0- .69) | -0.5(-1.0- .41) |
| Variance | 57.9(44.9- 70.7) | 51.9(37.8- 66.7) | 15.3(11.7- 19.5) | 13.5(10.2- 16.7) |
| Minimums | 10 | 10 | 6 | 6 |
| Maximums | 40 | 45 | 25 | 22 |
NFV=Negative Fusional Vergence.
Note: The units are in Prism diopters (∆D).
Table 2 shows the mean difference, standard deviations, standard error of the mean, 95% confidence interval difference, and p-value for paired comparisons of the two methods. The T-test was used to determine the difference in the average amplitude of fusional vergence of the two methods.
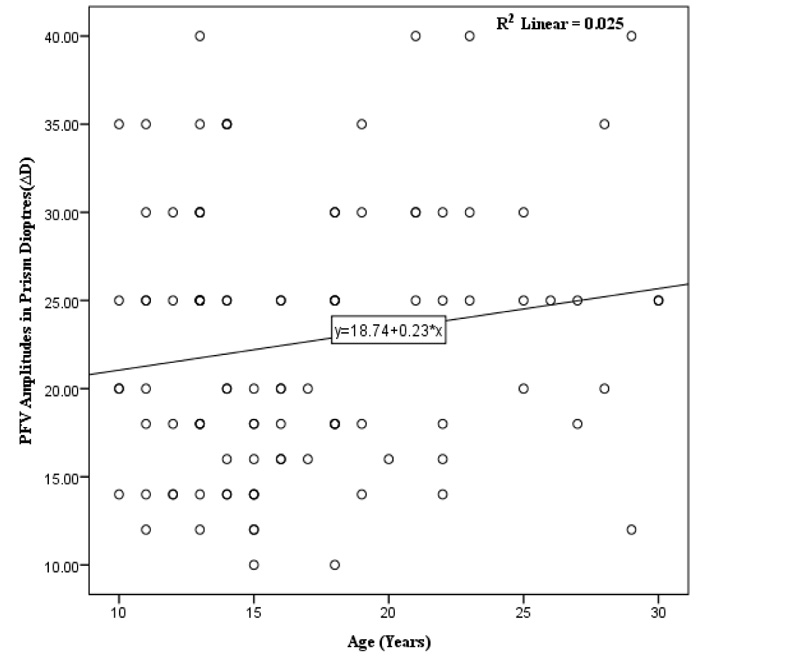
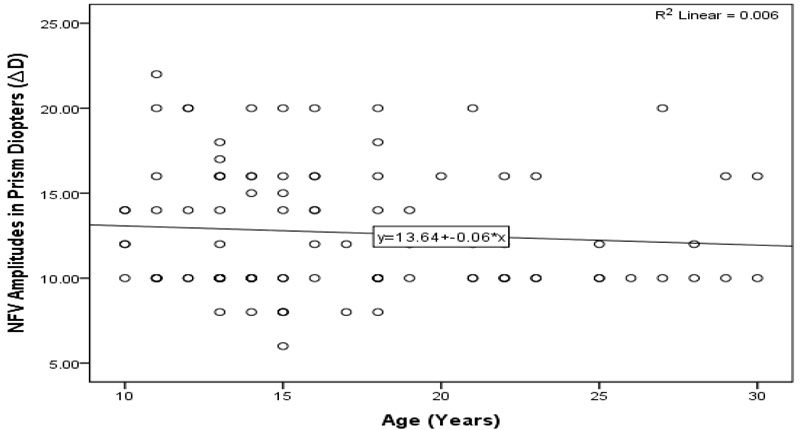
The T-test showed that the higher mean difference was between the prism bar and synoptophore for PVF amplitude (-2.04 ∆D), and the lower mean difference was between the prism bar and synoptophore for NVF amplitude (1.21 ∆D). However, the results obtained by prism bar and synoptophore were a statistically significant difference between p=0.001 and P=0.023 for measuring PFV and NFV amplitudes, respectively, as shown in Table 1 and Fig. (1). The measurements of positive and negative fusional vergence amplitudes by the two methods showed no relationship between age and fusional vergence P=˃ 0.05, as illustrated in Figs. (2 and 3).
| Paired Procedures | Mean Differences | Std. Deviation | Std. Error Mean | 95% Confidence Interval of the Difference | P-value | |
|---|---|---|---|---|---|---|
| Lower | Upper | |||||
| Prism Bar and Synoptophore PFV | -2.04 | 5.69 | 0.56 | -3.17 | -0.91 | 0.001 |
| Prism Bar and Synoptophore NFV | 1.21 | 5.22 | 0.52 | 0.17 | 2.24 | 0.023 |
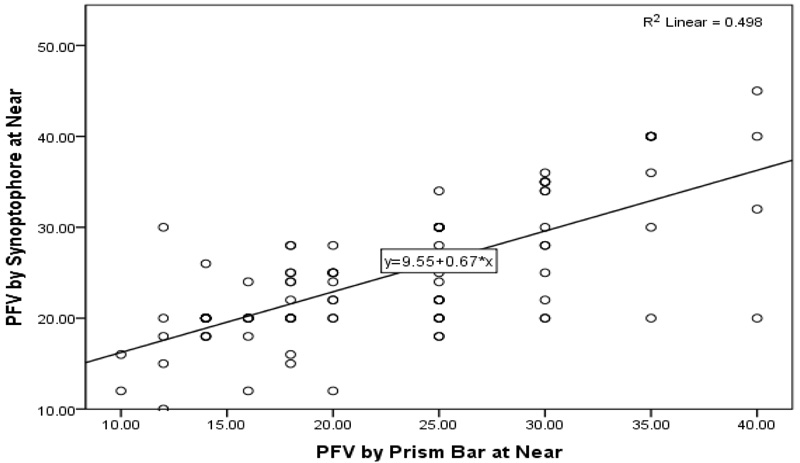
Using the t-test and regression calculation, significant differences were found between all measurements obtained by prism bar and synoptophore techniques, P<0.05, as shown in Table 2 and Fig. (4).
In Fig. (1), the whisker plot shows the distribution of the fusional vergence amplitude measurements by the two methods, prism bar and synoptophore, for PFV and NFV amplitudes. The mean markers and mean line of PFV by prism bar average measurements were below 25.00 ∆D. In contrast, PFV by synoptophore average measurements were at 25.00 ∆D.
4. DISCUSSION
Measurement of the fusional vergence amplitude (positive and negative) is a recommended procedure for a routine clinical examination of binocular vision worldwide. The detection and management of common binocular vision anomalies, including latent and manifest strabismus, are normally assisted by determining the FV [18]. Sheard postulated that FV opposing the heterophoria should be at least twice the magnitude of the angle of deviation to overcome the symptoms, and this criterion appears mostly applicable in exophoria [19, 20]. Percival assumed that the FV should be balanced within the limits that one should not be less than half of the other to overwhelm esodeviation symptoms [21, 22]. Several authors reported different methods that can be used to measure FV ranges and stimuli, leading to different amplitudes being reported in previous studies. The repeatability of the different techniques available and the equivalence between them is also essential [3, 12, 14]. Thus, the purpose of the current study was to compare the prism bar and synoptophore to determine the FV range in Sudanese patients near exophoria.
Our study revealed that the synoptophore measurements showed a higher mean of positive fusional vergence, whereas the prism bar measurements provided lower findings of the positive fusional vergence range. However, the prism bar measurements revealed a higher measurement for negative fusional vergence than synoptophore measurements. This study showed that fusional vergence measurements differ significantly between the two methods, P=0.001. Measurements by the two methods showed no relationship between age and fusional vergence amplitudes, p=0.591. Earlier studies [13, 23] indicated that measurements of FV amplitudes could be influenced by order of assessment, encouragement, and target size. In the present study, the negative fusional range was measured first to control the effect of excessive stimulation on convergence. In addition, all measurements of synoptophore were performed on fusion slides subtending a visual angle of 6 degrees horizontally and 8 degrees vertically.
Sreenivasan et al. [24] reported that the coefficient of repeatability using objective measurements of FV amplitudes with the step vergence technique, such as prism bars, indicates a greater variability for positive fusional vergence. This agreed with the result of the present study that the mean and standard deviation for the positive fusional range was 22.6± 7.6 Δ base-out. This finding is associated with higher standard deviations that might reflect the unequal sizes of the prism bar, with larger steps at the higher end of the bar. In addition, the prism steps increase by irregular step size up to 5Δ starting at 20Δ in prism bars [5]. Previous studies [5-12] reported that in comparison with smooth vergence, measurements such as by synoptophore showed less variation and lower standard deviations than step vergence measurements. However, there are still significantly high standard deviations for positive fusional vergence measurements, confirming the tendency for convergence
Daum et al. [25] found differences in positive fusional vergence amplitudes when using prism bars compared to the synoptophore, which showed no significant differences. These results are in agreement with the present study, but our results found significant differences in measurements between the two methods. Goss and Becker [26] demonstrated that the prisms bar vergence tended to give higher findings, especially for negative fusional vergence. This agrees with our findings that the prism bar technique showed higher measurements for negative fusional vergence in comparison to the synoptophore method. Many authors [27, 28, 5] reported that the higher measurements using the prism bars can be due to greater input from peripheral vision. However, measurements taken by this technique have advantages, including the presence of peripheral cues representing a more natural environment for testing when compared with the phoropter and synoptophore. Previous studies [5, 29] reported that there is an association between fusional vergence and age. Conversely, the finding of the current study is contrary to this result which revealed no relationship between age and fusional vergence amplitudes.
LIMITATIONS
This study has some limitations. The study was cross-sectional and included only exophoric patients. The sample of the study was small and only included the age of 10 to 30 years old. Subjects with amblyopia ocular symptoms, or who underwent refractive surgery did not participate in the study, and the findings from such groups may show some differences in their measurements. Measuring fusional vergence by the prism bar method takes a longer time to achieve the precision of the measurements and could vary with the practitioner's skills. Despite the limitations mentioned, the present study provides information about the variation of measurements of the fusional vergence amplitudes using two methods.
CONCLUSION
In comparison, smooth vergence measurements show less variation and lower standard deviations than step vergence measurements. Nevertheless, the step vergence method gives a higher measurement for negative fusional vergence than the smooth vergence method. Showing the significant variance in the results obtained between the two methods for measuring the positive and negative fusional vergence amplitudes, caution should be taken when deciding on fusional vergence range assessment in patients with latent and manifest strabismus.
LIST OF ABBREVIATIONS
| FV | = Fusional Vergence |
| PFV | = Positive Fusional Vergence |
| NFV | = Negative Fusional Vergence |
| VA | = Visual Acuity |
ETHICS APPROVAL AND CONSENT TO PARTICIPATE
Ethical approval was obtained from the Al-Neelain University Research Ethics Committee Ref (19-12-06).
HUMAN AND ANIMAL RIGHTS
No animals were used for studies that are the basis of this research. All the humans were used in accordance with the ethical standards of the committee responsible for human experimentation (institutional and national), and with the Helsinki Declaration of 1975, as revised in 2013 (http://ethics.iit.edu/ecodes/node/3931).
CONSENT FOR PUBLICATION
Informed consent was obtained from all subjects, and the aim of the study was explained to them. The collected data were saved confidentially, and no individual information was obtained.
STANDARDS OF REPORTING
STROBE guidelines were followed.
AVAILABILITY OF DATA AND MATERIALS
The authors confirm that the data supporting the findings of this study are available within the manuscript.
FUNDING
None.
CONFLICT OF INTEREST
The authors declare no conflict of interest, financial or otherwise.
ACKNOWLEDGEMENTS
Declared none.

