All published articles of this journal are available on ScienceDirect.

Corneal Curvature, Anterior Chamber Depth, Lens Thickness, And Vitreous Chamber Depth: Their Intercorrelations With Refractive Error In Saudi Adults
Abstract
Background:
Ocular biometrics, such as corneal curvature, axial length, anterior chamber depth, and lens thickness, play a significant role in the development of refractive error and are essential in many clinical and research applications.
Objective:
To determine means and ranges for corneal curvature, axial length, anterior chamber depth, lens thickness, vitreous chamber depth, and their intercorrelations with refractive error in Saudi adults.
Methods:
A total of 120 eyes of 60 hyperopic and 60 myopic subjects aged 19-26 years old were enrolled in this comparative cross-sectional study. Axial Length (AL), Anterior Chamber Depth (ACD), Lens Thickness (LT), and Vitreous Chamber Depth (VCD) were measured by the SONOMED ultrasound E-Z SCAN AB5500+, A-scan, with a contact technique. An ophthalmometer measured the refractive status objectively by auto-refraction and the corneal radius of curvature.
Results:
The findings showed that the myopic eyes had a deeper ACD(3.70±0.27mm) than hyperopic eyes (3.28±0.32mm), P=0.0001. However, the hyperopic eyes had a thicker LT (3.84±0.24mm) than the myopic eyes (3.81±0.19mm), P=0.640. The mean of the corneal radius of curvature for the myopic eyes was slightly more curved (7.87±0.23mm) than for the hyperopic eyes (7.95±0.27mm), P=0.602. The myopic eyes had a higher axial length/corneal radius AL/CR ratio (3.12±0.11) than hyperopic eyes (2.89±0.06), with P=0.0001. Myopic spherical equivalent (SPH) positively correlated with VCD and AL/CR ratio, P=0.0001. Vitreous chamber depth/Axial length ratio (VCD/AL) in the myopic eyes was higher (0.693±0.041) than in the hyperopic eyes (0.677±0.018), P=0.000. Hyperopic SPH was positively associated with the VCD/AL ratio, P=0.0001.
Conclusion:
Myopic eyes had a deeper VCD than hyperopic eyes; there was a strong positive correlation between VCD and myopic SPH. There was a strong positive correlation between the AL/CR ratio and myopic SPH and a VCD/AL ratio and the hyperopic SPH. Thus, the study suggests the possible utility of the AL/CR ratio while assessing the development of myopic refractive error and the VCD/AL ratio when evaluating hyperopic eyes and their associated complications.
1. INTRODUCTION
The growth of the human eye has fascinated eye care professionals for a long time; most of the studies about it have been performed around refractive error development, associated complications, and their control and management [1]. Earlier studies [1-3] reported that the human eye's size mainly depends on a visual sensation. This is because the growth of the outer layers of the eye, which ultimately determine axial length, are affected by the retinal image and the direction of its defocus [3]. Many studies have found that after imposed hyperopic or myopic optical defocus on the human eyes, they rapidly compensate, becoming myopic or hyperopic, respectively, by altering the depth of the vitreous chamber. Based mainly in animal studies [2, 4], it has been suggested that choroidal changes play a significant role in axial length growth, but conflicting results have been reported in humans [5-7]. Ocular biometric dimensions differ between ametropic subjects, and knowledge of their variations is essential to understanding the pathogenesis, diagnosis, and best management of refractive errors [8].
A study of the growth of the ocular component and its relation to the development of the refractive error reveals that myopia is most likely due to a change in growth. At the same time, emmetropia and hyperopia are a product of the initial size of the eye. On the other hand, it has also been suggested, based on keratometric findings, that myopic corneas are steeper than hyperopic ones. These points are currently under active study [9, 10]. An earlier study revealed that Anterior Chamber Depth (ACD) is significantly deeper in keratoconic eyes as compared with normal eyes, which could be due to the steeper corneal curvature [11]. Previous studies [12, 13] on the development of the ocular components reported that the eye had reached its adult emmetropic axial length by 13 years of age. However, the anterior chamber has reached its maximum depth, and the crystalline lens has its minimum thickness around 15 years of age since the crystalline lens decreases in power throughout the slow coordinated development period of the eye in childhood. During adulthood, axial length remains unchanged in almost all cases. In adults, frequently, there is a slight but steady trend toward hyperopia, especially after 40 years of age, but not related to changes in axial length but to the diminution of the amplitude of accommodation and the manifestation of latent hyperopia. The full-term neonate eye has a mean Axial Length (AL) of 16-18 mm and means Anterior Chamber Depth (ACD) of approximately 1.5-2.9 mm. The adult values for AL are between 22 and 25 mm, the mean crystalline lens power has been reported to be 20.34 ± 2.24 Diopters, and the mean ACD in an adult emmetropic eye is about 3-4 mm [14, 15].
Ocular biometric dimensions vary between races, ethnicities, and age groups. Some studies showed that there is a relationship between refractive error (myopia and hyperopia) and ocular biometric dimensions; they found a positive correlation between AL and ACD and an inverse correlation between AL and Lens Thickness (LT) [16]. The previous studies showed that the myopic eye had deeper ACD and long AL than the emmetropic and hyperopic eyes [17, 18]. While most of the earlier investigators have also found shallow ACD and short AL in the hyperopic eyes compared to the emmetropic eyes and myopic eyes [19, 20]. Several studies reported that myopic eyes had a thinner lens while hyperopic eyes had a thicker lens [21, 22]. To the best of our knowledge, no study was conducted to assess the association between ocular biometric dimensions and ametropia in Saudi adults. Thus, the present study was performed to determine means and ranges for corneal curvature, axial length, anterior chamber depth, lens thickness, vitreous chamber depth, and their intercorrelations with refractive error in Saudi adults.
2. MATERIALS AND METHODS
2.1. Study Design and Setting
The study was a comparative cross-sectional performed in the department of optometry clinic at Qassim University between February and June 2021.
2.2. Sample
The sample comprised 120 subjects (60 myopic eyes and 60 hyperopic eyes) with a mean age of 22.11± 1.57 (range, 20 to 26 years). The mean spherical equivalent for myopic eyes was (-2.27 ± 1.05D), and (+1.73 ± 0.75D), for the hyperopic eyes. Measurements of the ocular biometric dimensions were obtained from 120 ametropia Saudi adults who met the study's inclusion criteria.
2.3. The Inclusion and Exclusion Criteria
The inclusion criteria for the study groups were hyperopic and myopic adults who agreed to participate and signed the consent form. Myopia from (spherical equivalent from -1.00 to -4.00 D) and hyperopia (spherical equivalent from +1.00 to +4.00), with refractive astigmatism up to -0.50 D. Exclusion criteria include amblyopia, strabismus, microtropia, ocular pathology, history of corneal trauma, corneal refractive surgery, and systemic disease (e.g., hypertension, diabetes).
2.4. Ethical Considerations
Ethical permission for performing the study was obtained from the Qassim University Health Research Ethics Committee under approval number (21-10-03), and the study was conducted according to the Declaration of Helsinki guidelines. Informed consent was obtained from all subjects, and the aim of the study was explained before the examinations. The collected data were saved confidentially, and no individual information was obtained.
2.5. Data Collection Procedures
Before measuring ocular biometric dimensions, demographic information such as history, and symptoms were collected from all participants, followed by measurement of visual acuity (VA) at near and distance. Each participant was objectively refracted using a NIDEK autorefractor (RK-310) and then refined with subjective refraction, which included the best vision sphere, Jackson cross-cylinder technique, and binocular balancing using the alternate occlusion [23]. Both objective and subjective refractions were performed without cycloplegia. Each subject's corneal radius of curvature was measured using a TOPCON-JAPAN manual ophthalmometer. Before each measurement, the keratometer calibration was regularly tested to ensure the accuracy of the K-reading obtained. The corneal radius of curvature along the two principal meridians was measured and the average was calculated.
Ocular biometric dimensions were measured by the principal investigator using SONOMED E-Z SCAN (AB5500+ USA) with the contact method. The Acoustic velocity is different in the dense and stiffer lens or cortex, compared with the aqueous and vitreous. SONOMED ultrasound E-Z SCAN AB5500+ devices are calibrated to compensate for this, with different examination modes such as phakic, non-phakic (aphakic), dense cataract, and pseudophakic. The average tissue velocity will be automatically adjusted for the selected examination modes. In the present study, we used the phakic mode for the measurement of ocular dimensions in hyperopic and myopic subjects. All subject corneas were anesthetized with one drop of 0.5% Alcaine (Proparacaine hydrochloride). Measurements for the ocular dimensions were made with the subject lying in a supine position and watching a distant objective. Before each measurement A-scan portion was verified using the calibration procedure beforehand performing actual measurements. As recommended by the manufacturer verify the measurement obtained by the calibration cylinder is 10.00 ±0.1 mm. During measurements, the lids of the subjects were held apart with the fingers, and care was taken not to put on excessive pressure by the probe on the cornea. The examiner observed the waveform to confirm that it had four clean points each from the cornea, anterior and posterior lens surfaces, and the retina. Finally, the examiner took the average of a minimum of six acceptable measurements. A pilot study was conducted outside the main area of the study with 10 subjects and was not included in the study sample. Measurements of ocular biometric dimensions were performed using one procedure by a single examiner to assess the repeatability of the test.
2.6. Data Analysis
The data were entered into an Excel sheet, and descriptive statistical analysis was performed using SPSS version 24 (Inc., Chicago, IL, United States) and Excel. Paired t-tests and bivariate correlation analyses were used to compare myopic and hyperopic subjects' mean findings for ocular biometric dimensions. Wilcoxon tests were used for ordinal data, with p < 0.05 considered statistically significant in this study.
3. RESULTS
A total of 120 subjects aged between 20 to 26 years were included in this study, with a mean age of 22.11± 1.57 years, who met the inclusion criteria. Based on objective refraction, the mean and standard deviation of the spherical equivalent of the myopic and hyperopic eyes were (-2.27 ± 1.05D), and (1.74 ± 0.75D), respectively. There was no significant difference between the mean ages of the myopic and hyperopic subjects (p = 0.05). Table 1 shows the descriptive analysis for ocular biometric dimensions for myopic and hyperopic eyes. The Shapiro–Wilk test showed that the measurements of the ocular biometric dimensions were distributed normally with a p > 0.05.
3.1. Corneal Curvature
The mean of the corneal radius of curvature for the myopic eyes was slightly more curved or had a smaller radius of curvature (7.87±0.23mm) than the hyperopic eyes (7.95±0.27mm). However, the difference was not statistically significant P=0.602, as shown in Tables 1-3. There was a strong negative correlation (-0.457**) between the corneal radius of curvature and the spherical equivalent (SPH) of hyperopia, which was highly significant P= 0.01. Nevertheless, there was a very weak positive correlation (0.002) between the corneal radius of curvature and the myopic SPH, which was not significant, P= 0.991, as shown in Table 4.
|
Myopes (N=60) |
Hyperopes (N=60) |
|||||||||||||
|---|---|---|---|---|---|---|---|---|---|---|---|---|---|---|
| Statistics | Age | SPH(D) | KAV | AL | LT | ACD | VCD | Age | SPH(D) | KAV | AL | LT | ACD | VCD |
| Means | 22.05 | -2.27 | 7.87 | 24.5 | 3.81 | 3.70 | 17.05 | 22.20 | 1.74 | 7.95 | 23.01 | 3.84 | 3.28 | 15.6 |
| SD | 1.67 | 1.05 | 0.26 | 0.90 | 0.19 | 0.29 | 0.89 | 1.4 | 0.75 | 0.27 | 0.76 | 0.24 | 0.32 | 0.62 |
| Skewness | 0.58 | -0.74 | 0.04 | 0.14 | 0.34 | 0.27 | 0.87 | -0.51 | 1.46 | -0.12 | 0.70 | -0.1 | 0.62 | 1.3 |
| Kurtosis | -0.36 | -0.41 | -0.4 | 0.61 | -0.3 | -.02 | 1.01 | -0.99 | 2.26 | -1.3 | 0.20 | -0.2 | -0.3 | 2.1 |
| Variance | 2.80 | 1.1 | 0.07 | 0.82 | 0.04 | 0.09 | 0.79 | 1.98 | 0.56 | 0.07 | 0.59 | 0.06 | 0.11 | 0.39 |
| Minimums | 20 | -1.00 | 7.39 | 22.05 | 3.47 | 2.89 | 14.97 | 20 | 1.00 | 7.5 | 21.76 | 3.36 | 2.82 | 14.67 |
| Maximums | 26 | -4.00 | 8.43 | 26.51 | 4.32 | 4.34 | 19.18 | 24 | 4.00 | 8.38 | 25.13 | 4.40 | 4.10 | 17.63 |
|
Myopes (N=60) |
Hyperopes (N=60) |
|||||||||
|---|---|---|---|---|---|---|---|---|---|---|
| Statistics | CR | AL | VCD | AL/CR | VCD/AL | CR | AL | VCD | AL/CR | VCD/AL |
| Means | 7.87 | 24.5 | 17.05 | 3.12 | 0.693 | 7.95 | 23.01 | 15.6 | 2.89 | 0.677 |
| SD | 0.26 | 0.90 | 0.89 | 0.11 | 0.041 | 0.27 | 0.76 | 0.62 | 0.065 | 0.018 |
| Minimums | 7.39 | 22.05 | 14.97 | 2.84 | 0.66 | 7.5 | 21.76 | 14.67 | 2.73 | 0.63 |
| Maximums | 8.43 | 26.51 | 19.18 | 3.34 | 0.69 | 8.38 | 25.13 | 17.63 | 3.05 | 0.72 |
| Myopia n=60(-2.27 ± 1.05D) | Hyperopia n=60(1.74 ± 0.75D) | |||||||
|---|---|---|---|---|---|---|---|---|
| P | Correlation | 95% CI | Mean ± S. D | P | Correlation | 95% CI | Mean ± S.D | Parameter |
| 0.991 | 0.002 | 7.78,7.92 | 7.86±0.264 | 0.006 | -0.457** | 7.85,8.031 | 7.94±0.27 | Corneal curvature |
| 0.000 | 0.610** | 24.24,24.74 | 24.49±0.90 | 0.007 | -0.447** | 22.78,23.28 | 23.01±0.77 | Axial length |
| 0.374 | -0.120 | 3.76,3.87 | 3.81±0.21 | 0.323 | -.172 | 3.76,3.91 | 3.84±0.24 | Lens thickness |
| 0.112 | 0.213 | 3.64,3.78 | 3.69±0.29 | 0.347 | 0.164 | 3.18,3.39 | 3.28±0.32 | Anterior chamber |
| 0.000 | 0.501** | 16.8,17.29 | 17.05±0.89 | 0.657 | -0.078 | 15.39,15.79 | 15.59±0.62 | Vitreous Chamber |
| 0.000 | 0.634** | 3.09,3.14 | 3.12±0.11 | 0.939 | 0.013 | 2.87,2.92 | 2.89±0.07 | AL/CR |
| 0.385 | 0.117 | 0.69,0.701 | 0.69±0.018 | 0.008 | 0.443** | 0.67,0.68 | 0.68±0.018 | VCD/AL |
| Paired Procedures | Mean differences | Std. Deviation | Std. Error Mean | 95% Confidence Interval of the Difference | P-value | |
|---|---|---|---|---|---|---|
| Lower | Upper | |||||
| KAV Myopia and KAV Hyperopia | -.037 | 0.411 | 0.069 | -0.177 | 0.105 | 0.602 |
| AL Myopia and AL Hyperopia | 1.745 | 1.206 | 0.204 | 1.329 | 2.159 | 0.000 |
| LT Myopia and LT Hyperopia | -0.025 | 0.312 | 0.053 | -0.132 | 0.82 | 0.640 |
| ACD Myopia and ACD Hyperopia | 0.435 | 0.494 | 0.083 | 0.265 | 0.605 | 0.000 |
| VCD Myopia and VCD Hyperopia | 1.587 | 1.166 | 0.197 | 1.186 | 1.986 | 0.000 |
| AL/CR Myopia and AL/CR Hyperopia | 0.235 | 0.111 | 0.019 | 0.197 | 0.273 | 0.000 |
| VCD/AL Myopia and VCD/AL Hyperopia | 0.015 | 0.023 | 0.004 | 0.007 | 0.024 | 0.000 |
3.2. Anterior Chamber Depth (ACD)
The myopic eyes had a deeper average ACD (3.70±0.27mm) than the hyperopic eyes (3.28±0.32mm), the difference was highly significant, P=0.0001 as shown in Tables 1 and 3. A positive correlation between ACD and the hyperopic SPH was not statistically significant, P=0.347. However, a weak positive correlation between ACD and myopic SPH was not statistically significant, P=0.112 as shown in Table 4.
3.3. Lens Thickness (LT)
The hyperopic eyes had slightly thicker lenses (3.84±0.24mm) than the myopic eyes (3.81±0.19mm). Conversely, the difference was not statistically significant P=0.640, as shown in Tables 1 and 3. Bivariate correlation showed a negative association between LT and the spherical equivalent of hyperopia P=0.323. On the other hand, there was also a weak correlation between LT and the myopic SPH P=0.374 as shown in Table 4.
3.4. Vitreous Chamber Depth (VCD)
The myopic eyes had a longer VCD (17.05±0.89mm) than the hyperopic eyes (15.60±0.62mm), the difference was very significant P=0.0001 as shown in Tables 1 and 3. Bivariate correlation revealed a weak negative association between vitreous chamber depth and the hyperopic SPH P=0.657. Conversely, there was a strong positive correlation (0.501**) between VCD and the myopic SPH, which was highly significant P=0.0001, as shown in Table 4.
3.5. Axial Length (AL)
The myopic eyes had a longer AL (24.5±0.90mm) than the hyperopic eyes (23.01±0.76mm), the difference was extremely significant, P=0.0001 as shown in Tables 1 and 3. Bivariate correlation revealed a strong negative correlation (-0.447**) between the AL and the hyperopic SPH, which was significant P= 0.01. Conversely, there was a strong positive correlation (0.610**) between AL and the myopic SPH, which was highly significant P=0.0001, as shown in Table 4.
3.6. Axial Length/corneal Radius Ratio (AL/CR)
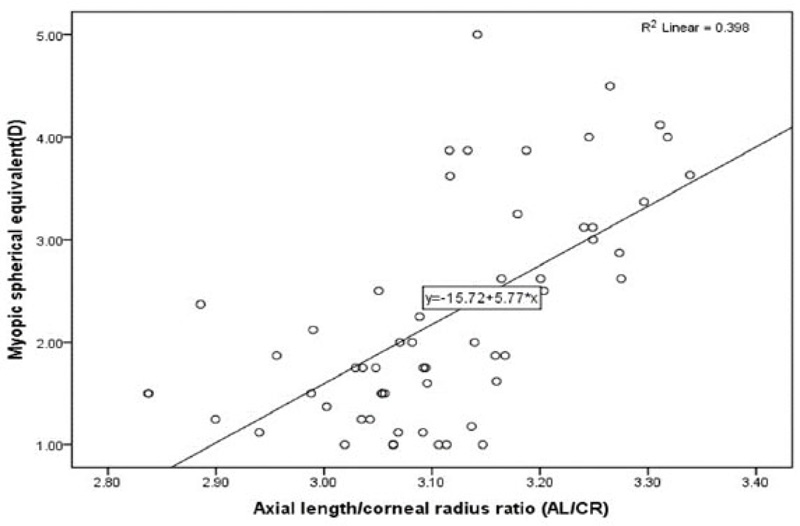
The myopic eyes had a higher AL/CR ratio (3.12±0.11) than the hyperopic eyes (2.89±0.06). The difference was extremely significant, P=0.0001 as shown in Tables 1 and 3. Bivariate correlation revealed a weak positive correlation (0.013) between the AL/CR ratio and the hyperopic SPH, which was not statistically significant P= 0.939. On the contrary, there was a strong positive correlation (0.634**) between the AL/CR ratio and the myopic SPH, which was strongly significant P=0.0001, as shown in Table 4 and Fig. (1).
3.7. Vitreous Chamber Depth/Axial Length Ration (VCD/AL)
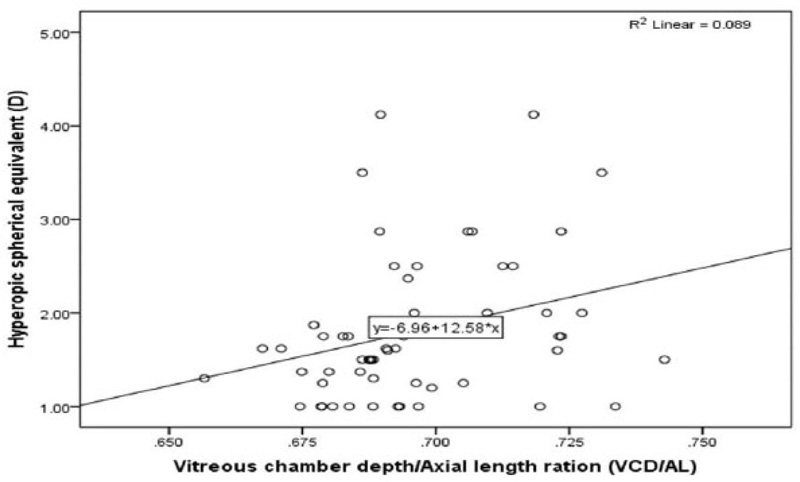
Interestingly VCD/AL ratio in the myopic eye was higher (0.693±0.041) than in the hyperopic eyes (0.677±0.018). The difference was highly significant P=0.0001 as shown in Tables 2 and 3. Bivariate correlation revealed a strong positive correlation (0.443**) between the VCD/AL ratio and the hyperopic SPH, which was strongly significant P= 0.008. On the contrary, there was a weak positive correlation (0.117) between the VCD/AL ratio and the myopic SPH, which was not statistically significant P=0.385 as shown in Table 4 and Fig. (2).
4. DISCUSSION
The present study describes the intercorrelations between refractive errors (hyperopia and myopia) and biometric dimensions such as corneal curvature, axial length, anterior chamber depth, lens thickness, and vitreous chamber depth in Saudi adults. The study revealed that the myopic eyes had a deeper ACD than the hyperopic eyes. The difference was strongly significant P=0.0001. Conversely, the hyperopic eyes had a thicker LT than the myopic eyes, the difference was not statistically significant, P=0.640. The myopic eyes had a higher AL/CR ratio than the hyperopic eyes. The difference was highly significant, P=0.0001. Myopic spherical equivalent was strongly positively correlated with VCD and AL/CR ratio, which was strongly significant P=0.0001. Vitreous chamber depth/Axial length ratio (VCD/AL) in the myopic eyes was higher than in the hyperopic eye. The difference was extremely significant, P=0.0001. Hyperopic spherical equivalent was strongly negatively correlated with AL and corneal power and strongly positively associated with AL/CR ratio, which was strongly significant P=0.0001.
Our findings are in agreement with previous studies [24-26], which showed that VCD and ACD were significantly longer in the myopic eyes than in hyperopic eyes. The current results showed that hyperopic eyes had a thicker LT than myopic eyes. This could be due to the hyperopic eyes tending to accommodate to keep the image in focus, resulting in increased lens thickness, particularly on the anterior surface of the lens, which might be correlated with a decrease in ACD. Conversely, the accommodation process in the myopic eye is inactive and this causes the lens to be thinner and associated with increased ACA and VCD [17, 26]. The present study revealed that there was a strong negative correlation between the corneal power and the spherical equivalent of hyperopia, which was highly significant. However, there was a weak positive correlation between corneal power and the myopic spherical equivalent. These results, in line with preceding studies [17, 19] showed that the changes in corneal power associated with the level of ametropia being higher corneal power in myopic eyes and lower corneal power in hyperopic eyes. This study's bivariate correlation revealed a strong negative correlation (-0.447) between the AL and hyperopic spherical equivalent, which was strongly significant P=0.0001. Whereas there was a strong positive correlation (0.610) between AL and myopic spherical equivalent, which was highly significant P=0.0001. The association between longer AL and myopia has been investigated in several studies [27-29]. However, Strang et al. [30] reported that there was a correlation between axial length and hyperopic spherical equivalent, similar to the myopic eye, but did not mention whether this association was positive or negative.
Interestingly our study showed that the myopic eyes had a higher AL/CR ratio (3.12±0.11) than the hyperopic eye (2.89±0.06), the difference was highly significant P=0.0001. Bivariate correlation revealed a strong positive correlation (0.634) between AL/CR ratio and myopic spherical equivalent, while a weak positive correlation between the AL/CR ratio and hyperopic spherical equivalent. Our findings are like what was reported by Benjamin et al. [31] they found that AL/CR in myopic eyes (-0.51 to -4.00D) was 3.24 and in hyperopic eyes (+0.51 to +4.00D) was 2.98. The current study suggests the possible utility of the AL/CR ratio while assessing the development of myopic refractive error because this ratio had a strong positive correlation with the spherical equivalent of myopia than other ocular biometric dimensions. Surprisingly, there was a strong significant positive correlation between the VCD/AL ratio and the hyperopic spherical equivalent. On the contrary, there was a weak correlation between the VCD/AL ratio and myopia's spherical equivalent, which was not statistically significant. Our study suggests the possible utility of the VCD/AL ratio while assessing the development of hyperopia and their associated complications, such as glaucoma and other ocular disorders, because this ratio had a strong positive correlation with the spherical equivalent of hyperopia than other ocular biometric dimensions. Takkar et al. [2] reported that there is a lack of information about VCD in literature, despite it occupying a greater part of the eye. They found that VCD is highly correlated with axial length compared to the anterior segment or any sub-parameter of the anterior segment. Moreover, their study showed that the VCD/AL ratio has the most constant association with ocular biometrics dimensions. Our findings are similar to what was reported by Greene [32] showed that refraction strongly correlates with axial length and vitreous depth in the rhesus eye. Conversely, Hughes [33] reported changes in ocular biometry during the accommodation mechanism, revealing that AL increased with increasing accommodation levels, whereas ACD and VCD decreased significantly with increasing accommodation.
5. LIMITATIONS
Limitations of our study include. The study was cross-sectional and comprised only male subjects. The study included myopic and hyperopic subjects, and the finding of ocular dimensions may differ from those reported for emmetropic subjects. Subjects with ocular disorders such as strabismus and amblyopia who experienced refractive surgery did not include in the current study, and the findings from such groups may show some differences in their ocular dimension measurements and intercorrelations. Intraocular pressure was not assessed in our study, which may also affect the accuracy of measuring ocular dimensions. Notwithstanding the limitations mentioned above, our study provides information about axial length, anterior chamber depth, lens thickness, vitreous chamber depth, and their intercorrelations with refractive error in Saudi adults
CONCLUSION
We found myopic eyes had a deeper vitreous chamber depth than hyperopic eyes. There was a strong positive correlation between vitreous chamber depth and the myopic spherical equivalent. However, there was a weak negative association between vitreous chamber depth and the hyperopic spherical equivalent. The study showed a strong positive correlation between the AL/CR ratio and the spherical equivalent of myopia and a strong positive correlation between the VCD/AL ratio and the spherical equivalent of hyperopia. Thus, our study suggests the possible utility of the AL/CR ratio while assessing the development of myopic refractive error and VCD/AL ratio when evaluating hyperopic eye and their associated complications such as glaucoma and other ocular disorders.
LIST OF ABBREVIATIONS
| AL | = Axial Length |
| ACD | = Anterior Chamber Depth |
| LT | = Lens Thickness |
| VCD | = Vitreous Chamber Depth |
| VCD/AL | = Vitreous chamber depth/Axial length ratio |
| LT | = Lens Thickness |
| VA | = Visual Acuity |
ETHICS APPROVAL AND CONSENT TO PARTICIPATE
Ethical approval was obtained from the Qassim University Health Research Ethics Committee under approval number (21-10-03).
HUMAN AND ANIMAL RIGHTS
No animals were used for studies that are the basis of this research. All the humans were used by the ethical standards of the committee responsible for human experimentation (institutional and national) and with the Helsinki Declaration of 1975, as revised in 2013 (http://ethics. iit.edu/ecodes/node/3931).
CONSENT FOR PUBLICATION
Informed consent was obtained from all subjects, and the aim of the study was explained to them. The collected data were saved confidentially, and no individual information was obtained.
STANDARDS OF REPORTING
STROBE guidelines were followed.
AVAILABILITY OF DATA AND MATERIALS
The data sets used and/or analysed during this study are available from the corresponding author upon request.
FUNDING
None.
CONFLICT OF INTEREST
The authors declare no conflict of interest, financial or otherwise.
ACKNOWLEDGEMENTS
The authors extend their sincere thanks to Thamer Alharbi and Yasser Alnafesah for their help in data collection.

