All published articles of this journal are available on ScienceDirect.

Prevalence of Computer Vision Syndrom and Predisposing Factors Among Engineering Students in Hawass University Institution of Techenology Campus, Hawassa, Ethiopia, 2019
Authors Info & Affiliations
Abstract
Objective:
Lack of detail information about the magnitude of the computer vision syndrome (CVS) and the factors which predominantly cause CVS. This study has an importance for further studies as a baseline data. The purpose of this study was to assess the magnitude of CVS and associated factors on students of Hawassa university institution of technology, Hawassa, Ethiopia, 2019.
Methodology:
Institution based cross sectional study design was used from March 30 to May 2019. A multi stage sampling was used. Four departments were selected by using simple random sampling. Among each selected departments students was selected by using systematic random sampling and calculating proportion (K) on each selected department based on the proportion of the number of students in each department. And the final sample size was 896. Each student was assessed whether he/she was exposed to any kind of visual display terminal (VDT). Face to face interview, ocular examination and observation during VDT use was performed by five optometrists from March 30 to May 2019. After collected data was cleaned and coded, EPI info 2002 for data entry and SPSS version 16.0 software for data analysis was used. Odds ratio with a 95% CI will be used to display results. P value less than 0.05 in multivariate logistic regressions was used to show statistical significance.
Results:
The prevalence of Computer vision syndrome is 41.7% and urban(OR =1.66; CI = (1.14, 2.43)), no glass use(OR = 6.01 ; CI = (1.67, 21.63)), reading playing game with VDT (OR = 2.33; CI = (1.33, 4.08)), reading and watching movies with VDT (OR = 1.49; CI = (1.02, 2.18)), using Smartphone (OR = 0.60; CI = (0.38, 0.95)), remote NPC (OR= 3.19; CI = (1.64, 6.25)) and moderate size of VDT (OR = 0.63; CI = (0.41, 0.96)) were significantly associated with CVS. There is 0.39Ds reduction of amplitude of accommodation in students who has CVS.
Conclusion:
The prevalence of CVS was high in engineering students, mostly having symptoms of tearing. It is better to avoid using VDT like Smartphone for multiple activities like reading, playing game and watching movies and need an eye examination and protective glass to prevent CVS.
1. INTRODUCTION
1.1. Background Information
The worldwide prevalence of CVS ranges from 25-93%. CVS is the most frequently reported health problem occurring among 70% of computer users. 1 out of 6 patients requiring eye examinations has computer-related eye problems [1, 2]. Without proper vision correction, worker productivity can decrease by as much as 20% [4, 5].
Prolonged use of computers, position, light intensity, and spectacle wear are the factors associated with CVS. Males had a higher risk of developing dry eyes (OR = 1.8, 95%), which was statistically significant. On the other hand, males were at lower risk of developing headache (OR = 0.6) and neck and shoulder pain (OR = 0.6,) compared to females, which was statistically significant. A significant correlation was found between taking less frequent breaks while working on computers with blurred vision and dry eyes [6].
Individuals who develop CVS have reduced work effectiveness and many ocular complications. Several times, CVS is treated when a patient complains about it and when they visit the clinic, but by conducting this study, it is possible to prevent the predisposing factors for developing CVS. Currently, the number of individuals who are visiting the eye clinic due to CVS is increasing dramatically. There is a lack of detailed information about the magnitude of the problem and the factors that predominantly cause CVS in the study area. Besides that, there is a lack of previous studies done in this area, even if the number of victims has increased. This study also has importance for further studies as baseline data (Fig. 1).
1.2. Objectives and Hypothesis
- To assess the prevalence of CVS and associated factors on students of Hawassa university, the institution of technology, 2020.
- To determine the magnitude of CVS on students of Hawassa university, the institution of technology, 2020.
- To identify the associated factors for CVS on students of Hawassa university, the institution of technology, 2020
- CVS has a high magnitude among engineering students and the main predisposing factors are ergonomic factors mainly.
- CVS reduces the amount of amplitude of accommodation.
2. MATERIALS AND METHODS
The institution-based cross-sectional study design was used from March to May 2020. Hawassa city is situated 273km from Addis Abeba, and it is the capital city of south Ethiopia. Hawassa University, the faculty of technology, was established almost 10 years ago. The faculty has 7410 students, 417 academic staff, 17 expatriate staff, and 95 administrative staff.
The initial sample (n) was estimated using the statistical formula:
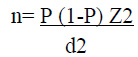 |
Among the calculated sample sizes, by considering the general and specific objectives, the largest sample size was 896.
Multi-stage sampling was used. The participants were asked in-depth and assessed in what method they have been using the VDT based on the ergonomic standard use of VDT. After the collected data was cleaned and coded, EPI info 2002 for data entry and SPSS version 16.0 software for data analysis was used. First binary logistic regression was computed, and then factors with the P-value of less than 0.20 were re-entered to multinomial logistic regressions to identify the strength of association with the dependant variable. An odds ratio with a 95% CI was used to display the results. P values less than 0.05 were used to show statistical significance. Oral consent was obtained from each participant after explaining the purpose and importance of the study. The ocular examinations and evaluations were performed by professional optometrists, and study participants were informed that they do have a right to not be a part of the study. Confidentiality, as well as privacy of the study participants, was maintained during and after data collection. Advice regarding the prevention of CVS and proper utilization of VDT was given. Individuals who were diagnosed with the problem have taken a medication prescription and protective spectacle for their future use of VDT.

Visual display terminals (VDT) are any kind of technological tools used for day-to-day activity with a screen and needs a visual demand like desktop computers, laptops, tablets, smartphones, iPods, computerized monitoring devices, and others are VDT.
Computer vision syndrome (CVS) is having ocular symptoms after prolonged use of VDT either intermittently or continuously for at least one week during the last twelve months. Ocular symptoms are the presence of pain in and around the eyes, headache, blurred near vision, blurred distant vision, dry eyes, sore/irritated eyes, red eyes, excessive tearing, double vision, twitching of eyelids, and changes in visualizing colors were assessed as symptoms of CVS in this study. Individuals who have reported one of the above signs and symptoms were considered positive for CVS [1, 3, 7].
3. RESULTS
Among the study participants (81.5% respondent rate), 454 (55.9%) were male students and the mean age of the study participants were 21± 5.29 years, and 609 (75%) of the students came from urban area. Most of the students (72.9%) had less than 20 dollars in monthly income (Table 1).
3.1. Prevalence of Computer Vision Syndrome
The prevalence of CVS was 41.7% (339). CVS was more prevalent on 18 – 24 yrs of age 97.9% (332), male 61.4% (208), urban 83.8% (284), income per month less than 20 dollars 66.4% (225) and 3rd year students 21.2% (72).
Symptoms more prevalent in students who have CVS were mild tearing 52.8% (179), eye tiredness 44.8% (152), and blurring of vision 38.6% (131) (Table 2).
| - | Female | Male | Total |
|---|---|---|---|
| Age 18 – 24 yrs | 353 (43.5%) | 441 (54.3%) | 794 (97.8%) |
| 25 – 30 yrs | 4 (0.5%) | 11 (1.4%) | 15 (1.8%) |
| >30 yrs | 1 (0.1%) | 2 (0.2%) | 3 (0.4%) |
| Residence urban | 233 (28.7%) | 376 (46.3%) | 609 (75%) |
| Rural | 125 (15.4%) | 78 (9.6%) | 203 (25%) |
|
Income per month less than 10 dollars |
66 (8.2%) | 102 (12.5%) | 168 (20.7%) |
| 10- 20 dollars | 196 (24.1%) | 228 (28.1%) | 424 (52.2%) |
| >20 dollars | 96 (11.8%) | 124 (15.3%) | 220 (27.1%) |
| Academic year 1st year | 42 (5.2%) | 63 (7.8%) | 105 (12.9%) |
| 2nd year | 124 (15.3%) | 121 (14.9%) | 245 (30.2%) |
| 3rd year | 102 (12.6%) | 134 (16.5%) | 236 (29.1%) |
| 4th year | 37 (4.1%) | 52 (6.4%) | 89 (10.9%) |
| 5th year | 53 (6.5%) | 84 (10.3%) | 137 (17.1%) |
| - | Computer Vision Syndrome | Total | |
|---|---|---|---|
| Yes | No | ||
| Age 18 - 24 | 332 (40.9%) | 462 (56.9%) | 794 (97.8%) |
| 25 - 30 | 5 (0.6%) | 10 (1.2%) | 15 (1.8%) |
| Above 30 | 2 (0.2%) | 1 (0.1%) | 3 (0.4%) |
| Sex male | 208 (25.6%) | 246 (30.3%) | 454 (55.9%) |
| Female | 131 (16.1%) | 227 (27.9%) | 358 (44.1%) |
| Residence urban | 284 (34.9%) | 325 (40%) | 609 (75%) |
| Rural | 55 (6.8%) | 148 (18.2%) | 203 (25%) |
| Academic year 1styr | 52 (6.4%) | 53 (6.5%) | 105 (12.9%) |
| 2nd yr | 88 (10.8%) | 157 (19.3%) | 245 (30.2%) |
| 3rd yr | 97 (11.9%) | 139 (17.1%) | 236 (29.1%) |
| 4th yr | 37 (4.56%) | 52 (6.4%) | 89 (11%) |
| 5th yr | 65 (8%) | 72 (8.9%) | 137 (16.8%) |
|
Income per month < 10 dollars |
72 (8.9%) | 96 (11.8%) | 168 (20.7%) |
| 10 – 20 dollars | 153 (18.8%) | 271 (33.4%) | 424 (52.2%) |
| >20 dollars | 114 (25.1%) | 106 (13%) | 220 (27.1%) |
| Computer vision syndrome | total | ||
| yes | no | ||
| VDT use hour per day 1 – 3 hours | 36 (4.4%) | 37 (4.6%) | 73 (9%) |
| 3 – 6 hours | 174 (21.4%) | 257 (31.7%) | 431 (53.1%) |
| 6 – 8 hours | 98 (12.1%) | 137 (16.9%) | 235 (28.9%) |
| >8 hours | 31 (3.8%) | 42 (5.2%) | 73 (9%) |
|
VDT use duration 1 – 2 yrs |
37 (4.6%) | 44 (5.4%) | 81 (10%) |
| 2 – 4 yrs | 150 (18.5%) | 237 (29.2%) | 387 (47.7%) |
| 4 – 6 yrs | 121 (14.9%) | 157 (19.3%) | 278 (34.2%) |
| >6 yrs | 31 (3.8%) | 35 (4.3%) | 66 (8.1%) |
|
Position during VDT use Up ward |
5 (0.6%) | 1 (0.1%) | 6 (0.7%) |
| Same level | 94 (11.6%) | 180 (22.2%) | 274 (33.7%) |
| Down ward | 240 (29.6%) | 292 (35.9%) | 532 (65.5%) |
|
Distance from VDT <20 cm |
9 (1.1%) | 5 (0.6%) | 14 (1.7%) |
| 20 – 50 cm | 165 (20.3%) | 285 (35.1%) | 450 (55.4%) |
| 50 – 100 cm | 165 (22%) | 165 (20.3%) | 344 (42.4%) |
| >100 cm | 0 | 4 (0.5%) | 4 (0.5%) |
|
Room light condition Dark |
64 (7.9%) | 77 (9.5%) | 141 (17.4%) |
| Illuminated | 263 (32.4%) | 384 (47.3%) | 647 (79.7%) |
| Extreme illuminated | 12 (1.5%) | 12 (1.5%) | 24 (3%) |
|
Activities on VDT reading |
43 (5.3%) | 71 (8.7%) | 114 (14%) |
| Watching movies | 3 (0.4%) | 3 (0.4%) | 6 (0.7%) |
| Drafting &designing | 7 (0.9%) | 3 (0.4%) | 10 (1.2%) |
| Reading & movie | 88 (10.8%) | 93 (11.5%) | 181 (22.3%) |
| Reading & game | 39 (4.8%) | 27 (3.3%) | 66 (8.1%) |
| Numerous activities | 159 (19.6%) | 276 (34%) | 435 (53.6%) |
| Type of VDT Smartphone | 63 (7.8%) | 108 (13.3%) | 171 (21.1%) |
| Tablet | 10 (1.2%) | 17 (2.1%) | 27 (3.3%) |
| Lap top | 61 (7.5%) | 103 (12.7%) | 164 (20.2%) |
| Computerized machineries | 0 | 1 (0.1%) | 1 (0.1%) |
| Tablet & lap top | 14 (1.7%) | 28 (3.4%) | 42 (5.2%) |
| Phone & lap top | 180 (22.2%) | 212 (26.1%) | 392 (48.3%) |
| Break yes | 92 (11.3%) | 105 (12.9%) | 197 (24.3%) |
| no | 247 (30.4%) | 368 (45.3%) | 615 (75.7%) |
| Screen filter yes | 17 (2.1%) | 11 (1.4%) | 28 (34.5%) |
| no | 322 (39.7%) | 462 (56.9%) | 784 (96.6%) |
| Size of VDT small | 57 (7.1%) | 53 (6.5%) | 110 (13.5%) |
| Medium | 212 (26.1%) | 358 (44.1%) | 570 (70.2%) |
| Large | 70 (8.6%) | 62 (7.6%) | 132 (16.3%) |
|
Brightness of VDT low |
133 (16.4%) | 149 (18.3%) | 282 (34.7%) |
| Medium | 192(23.6%) | 310 (38.2%) | 502 (61.8%) |
| Intensive | 14 (1.7%) | 14 (1.7%) | 28 (2.4%) |
| Table use yes | 90 (11.1%) | 106 (13.1%) | 196 (24.1%) |
| No | 249 (30.7%) | 367 (45.2%) | 616 (75.8%) |
| Awareness yes | 44 (5.4%) | 72 (8.9%) | 116 (14.3%) |
| No | 295 (36.3%) | 401 (49.4%) | 696 (85.7%) |
Computer vision syndrome was more prevalent on students who spent on medium period of VDT use 51.3% (174), medium duration of VDT use 44.2% (150), near distance from VDT 48.7% (165), down ward viewing position 70.5% (239), illuminated room condition 77.6% (263), both Smartphone and laptop users 36.6% (124), medium size of VDT user 62.5% (212), medium VDT brightness 56.6% (192) and numerous activities on VDT 46.6% (158).
| Variables | COR (CI) | AOR (CI) | P - value |
|---|---|---|---|
| Sex male | 0.68 (0.51, 0.91) | - | - |
| Residence urban | 2.33 (1.64, 3.29) | 1.66 (1.14, 2.43) | 0.008 |
| Academic year 1st | 1.09 (0.65, 1.81) | - | - |
| 2nd | 0.62 (0.41, 0.95) | - | - |
| 3rd | 0.77 (0.51, 1.18) | - | - |
| 4th | 0.79 (0.46, 1.35) | - | - |
| Glass no | 0.15 (0.04, 0.52) | 6.01 (1.67, 21.63) | 0.006 |
| Position upward | 6.08 (0.71, 52.4) | - | - |
| Same level | 0.64 (0.47, 0.86) | - | - |
|
Activities with VDT reading |
1.05 (0.69, 1.62) | - | - |
| Drafting &designing | 4.06 (1.04, 15.9) | - | - |
| Watching movies | 1.74 (0.35, 8.73) | - | - |
| Reading & movies | 1.64 (1.16, 2.34) | 1.49 (1.02, 2.18) | 0.039 |
| Reading & game | 2.52 (1.48, 4.26) | 2.33 (1.33, 4.08) | 0.003 |
|
VDT type Smartphone |
0.68 (0.47, 0.97) | 0.60 (0.38, 0.95) | 0.03 |
| tablet | 0.68 (0.30, 1.52) | - | - |
| Laptop | 0.68 (0.47, 0.99) | - | - |
| Tablet & laptop | 0.79(0.45, 1.42) | - | - |
| Size of VDT small | 0.93(0.56, 1.56) | - | - |
| Moderate | 0.51 (0.35, 0.76) | 0.63 (0.41, 0.96) | 0.032 |
|
NPC remote normal |
0.28 (0.15, 0.54) | 3.198 (1.64, 6.25) | 0.001 |
3.2. Factors Associated with CVS
Factors with the P value <0.25 in binary logistic regression were included in multinomial logistic regression and urban(OR =1.66; CI = (1.14, 2.43)), no eye glass use(OR = 6.01 ; CI = (1.67, 21.63)), reading and playing game with VDT (OR = 2.33; CI = (1.33, 4.08)), reading and watching movies with VDT (OR = 1.49; CI = (1.02, 2.18)), using Smartphone (OR = 0.60; CI = (0.38, 0.95)), remote NPC (OR= 3.19; CI = (1.64, 6.25)) and moderate size of VDT (OR = 0.63; CI = (0.41, 0.96)) were significantly associated with CVS (Table 3 and Fig. 2).
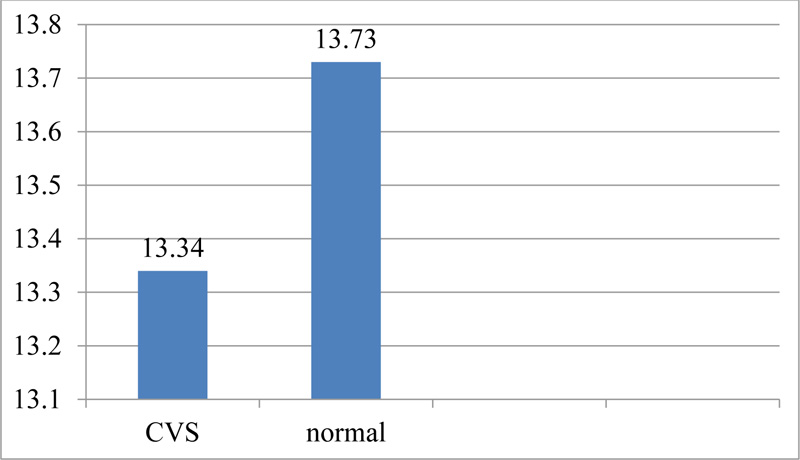
3.3. Amplitude of Accommodation with CVS
The minimum amplitude of accommodation was 6.50Ds and the maximum amplitude of accommodation was 20.50Ds. The mean amplitude of accommodation for individuals with CVS was 13.34Ds ± 2.22, but for normal individuals, it was 13.73DS. There was a 0.39Ds reduction in the mean amplitude of accommodation in individuals with CVS compared with the mean amplitude of accommodation in normal individuals.
4. DISCUSSION
The prevalence of CVS in this study was 41.7%, which was between the worldwide prevalence range (25- 93%), and it was higher when compared with studies done in Brazile (40.4%) and Pakistan (25%). But, it was lower than studies done in India (51.56%), Malaysia (68.1%), Chennai (81.9%), and Sir Lanka (67.4%). The reason for the difference between the prevalence in this study and the others was the type of study participants; their occupation and the type of activities performed with VDT were too different. In the other studies, their occupation was secretaries and office workers. The study in Chennai included both medical and engineering students because their exposure to VDT may be different. This difference can raise the prevalence either lower or higher than in this study [8-10].
Similarly, the prevalence of CVS was lower in this study compared with the study done in Gondar (73%), related to the larger sample size and the study participant difference, which lowers the prevalence in this study [11].
Computer vision syndrome was more prevalent in this study in males (61.4%), moderate period of VDT use (51.3%), moderate duration of VDT use (44.2%), downward viewing position (70.5%), illuminated room condition (77.6%), both Smartphone and laptop users (36.6%) and medium-sized VDT use (62.5%). On contrary, in studies done in India and Sir Lanka females, duration, >2 hours working hours, upward viewing position, using a filter, and brightness were more prevalent. There were similarities in VDT working hours but the other factors were differently prevalent in this study [12-14].
The most compliant symptoms in Sir Lanka and Gondar were headaches (45.7%), dryness (31.1%), blurring of vision (31%), and eye strain (25%), but in this study, tearing (52.8%) and eye tiredness (44.8%) were more prevalent [11, 13].
In Hyderabad, there was a significant association with close distance from VDT(less than 25inches), 4 – 8 hours per day of VDT use, and no filter use. But none of those factors were significantly associated with CVS in this study [14].
Duration with VDT, sitting arrangement with VDT, and filter use were significantly associated with CVS in Bengaluru, which is different from this study; the factors associated with CVS in this study were urban residence, no glass use, reading and playing with VDT, reading and watching movies with VDT, moderate size of VDT and remote NPC [15].
CONCLUSION
In general, engineering students had a significant frequency of CVS, with tearing as the most common symptom. It is best to avoid using VDTs such as smartphones for a variety of activities such as reading, playing games, and watching movies. Moreover, eye examinations and protective glass should be considered to prevent CVS. It is better to conduct further studies on the effect of an eye medication treatment and glass protection to treat and prevent CVS.
LIST OF ABBREVIATIONS
| VDT | = Visual Display Terminals |
| CVS | = Computer Vision Syndrome |
AUTHORS' CONTRIBUTIONS
All authors made substantial contributions to the conception and design, acquisition of data, analysis, and interpretation of data, critical revision of the manuscript, read and approved the final version to be published, and agreed to be accountable for all aspects of the work.
ETHICS APPROVAL AND CONSENT TO PARTICIPATE
The study was approved by the Hawassa University ethical review board.
HUMAN AND ANIMAL RIGHTS
No humans were used for studies that are the basis of this research. All the human experiments were performed in accordance with the ethical standards of the committee responsible for human experimentation (institutional and national), and with the Helsinki Declaration of 1975, as revised in 2013 (http://ethics.iit.edu/ecodes/node/3931 ).
CONSENT FOR PUBLICATION
Informed consent was obtained from all participants.
STANDARDS OF REPORTING
STROBE guidelines have been followed in this study.
AVAILABILITY OF DATA AND MATERIALS
Not applicable.
FUNDING
None.
CONFLICT OF INTEREST
The authors declare no conflict of interest, financial or otherwise.
ACKNOWLEDGEMENTS
The authors would like to thank with the deepest gratitude to Hawassa University, the research program directorate, for facilitating and coordinating this research to be conducted, and the study participants for their active participation and cooperation.

