All published articles of this journal are available on ScienceDirect.

Assessment of Globulin Levels and Albumin-to-globulin Ratio in Patients with Type 2 Diabetes and Retinopathy: A Retrospective Single-center Study
Authors Info & Affiliations
Abstract
Background:
Diabetes is a global health burden, with diabetic retinopathy (DR) repeatedly arising as an inflammatory complication. This study aims to evaluate routine blood measures as inflammatory markers in DR.
Methods:
A cross-sectional study was conducted on patients with type 2 diabetes (T2D) attending an outpatient clinic at a tertiary care hospital. Data on glycated hemoglobin (HbA1c), C-reactive protein (CRP), total protein, albumin, and globulin were retrospectively collected from medical records. Data analysis involved independent t-tests, Mann-Whitney, and Pearson's correlation.
Results:
Encrypted data were collected and analyzed for 139 diabetic patients (70 DR, 69 non-DR). The mean globulin levels were significantly higher in the DR group compared to the non-DR group (30.1g/L±5.04 and 18g/L±9.14, respectively, p<0.001). Moreover, the DR group had a lower mean albumin-to-globulin ratio than the non-DR group (1.3±0.33 and 2.8±2.06, respectively, p<0.001) and a higher mean HbA1c level (8±1.49 and 7.4±1.58, respectively, p=0.020). A weak negative correlation between globulin and albumin levels was detected, with a Pearson's correlation coefficient of -0.085 (p=0.482). Mean values of total protein, albumin, and CRP differed between groups but were not statistically significant (p=0.133, 0.763, 0.396 respectively).
Conclusion:
The study highlights the potential use of routine blood biomarkers as useful indicators for DR in T2D. The observed increase in serum globulin levels and the negative correlation with albumin provide important insights into the pathophysiology of DR. However, further research is necessary to elucidate the mechanisms behind these associations and evaluate the clinical usefulness of these biomarkers.
1. INTRODUCTION
Diabetic retinopathy (DR) is a prevalent retinal vascular disease that stems from the microvascular complications of diabetes mellitus (DM). It affects approximately 75% of individuals with diabetes who have had the disease for 15 years or more [1]. In 2020, DR was identified as the sixth leading preventable cause of blindness and moderate to severe vision impairment in individuals aged 50 and over [2].
Several extraocular factors have been associated with an increased risk of DR and its progression, including poor glycemic control, hypertension, dyslipidemia, duration of diabetes mellitus, pregnancy, and genetic factors [3-7]. DR develops after several years of inadequate diabetes management and progresses through several stages, starting with mild abnormalities characterized by vascular hyperpermeability, to moderate and severe non-proliferative diabetic retinopathy characterized by progressive retinal capillary leakage or loss leading to retinal ischemia, and finally to proliferative diabetic retinopathy characterized by the emergence of new vessels on the optic disc and retina. These new vascular formations often lead to the development of fibrous tissue, which may contract, causing vitreous hemorrhage and tractional retinal detachments [8].
DR is linked to low-grade and chronic inflammation, oxidative stress, and alterations in the retina microvasculature [9]. There are several potential systemic and ocular inflammatory biomarkers for diabetic retinopathy, including C-reactive protein (CRP), tumor necrosis factor-alpha, interleukins (IL-6, 8, 12), vascular endothelial growth factor, pigment epithelium-derived factor, placental growth factor, intracellular adhesion molecule-1, vascular cell adhesion molecule-1, insulin-like growth factor-1, transforming growth factor beta, basic fibroblast growth factor, hepatocyte growth factor, connective tissue growth factor, retinol-binding protein 4, chemokine-10, monocyte chemotactic protein-1, and chemokine ligand 5 [10].
Albumin, a significant component of serum protein, exhibits a negative correlation with inflammation [11-13] and hypoalbuminemia serves as a biomarker for inflammation [14]. Conversely, serum globulin, which includes complements, IL-6, and immunoglobulins, is closely linked to inflammation [12, 15-17]. Although the albumin-to-globulin ratio has been proposed as an inflammation biomarker [18, 19], its ability to detect RP has not been extensively researched. The purpose of this study is to evaluate relevant routine blood biomarkers of inflammation in DR.
2. METHODS
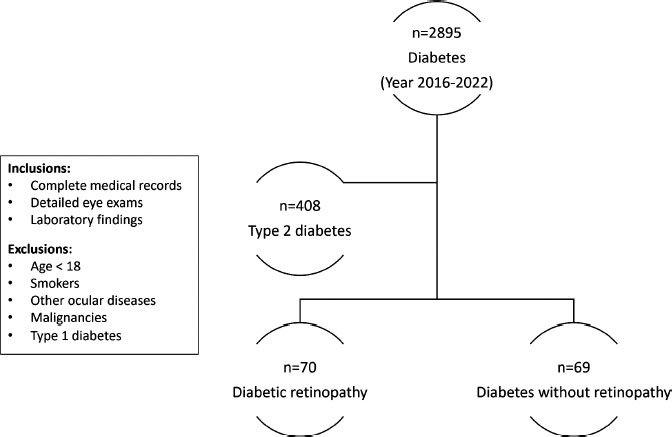
A retrospective cross-sectional study was conducted at a tertiary care hospital, King Abdulaziz Medical City in Jeddah, Saudi Arabia. Encrypted data of patients with type 2 diabetes were extracted from medical records, Jan 2016-May 2022, as shown in Fig. (1). The cases were divided into two groups based on the presence or absence of retinopathy, as indicated in their medical records using the international classification of diseases codes (10th revision), capturing all stages of retinopathy. Patients with complete medical records, including eye exams and laboratory findings, were selected for the study, while those with other ocular diseases or malignancies were excluded. Institutional review board approval from King Abdullah International Medical Research Center was obtained (approval #RSS22J-006-07), and all patients provided their consent following the guidelines of the declaration of Helsinki. Data on patient demographics, including age and gender, as well as laboratory data such as HbA1c, CRP, serum total protein levels, albumin, and globulin were extracted from patient files in an encrypted format. Laboratory measurements were conducted at the clinical chemistry laboratory of the hospital. All statistical analyses were conducted using SPSS software (version 20.0, IBM Corp, Armonk, NY). Descriptive statistics, such as frequencies and percentages for categorical variables, and means and standard deviations for quantitative variables were used to analyze the data. Chi-squared tests were employed to compare frequencies, while Pearson's correlation test was used to evaluate the correlation among factors. The threshold for significance was set at p≤0.05.
3. RESULTS
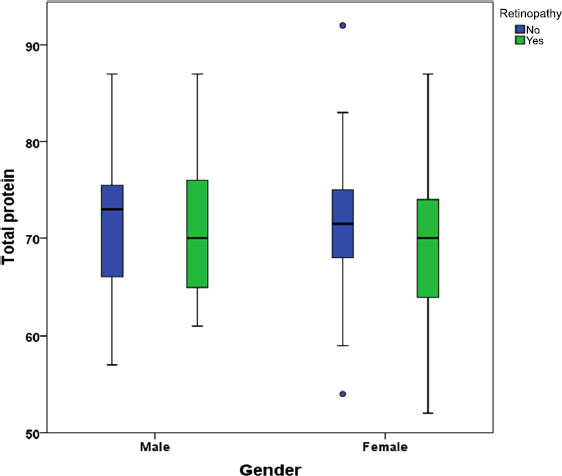
This retrospective analysis included 139 diabetic patients, with 60 (43.2%) males and 79 (56.8%) females, and a mean age of 63.1 (SD=11.45) years. The mean and standard deviation for the following parameters were calculated: HbA1c (mean=7.7%, SD=1.56), albumin (mean=38.6g/L, SD=6.60), total protein (mean=70.1g/L, SD=7.95), and globulin (mean=24.1g/L, SD=9.52). The mean C reactive protein (CRP) level was 29.5mg/L. Out of 139 patients, 70 (50.4%) had retinopathy, while 69 (49.6%) did not. The mean age of the patients with retinopathy was 62.9 (SD=12.76) years, while the mean age of the patients without retinopathy was 63.3 (SD=10.03) years (95% confidence interval -3.47 to 4.22, p=0.847). The study examined the differences in various biochemical markers between diabetic patients with and without retinopathy (Table 1). In order to augment the sample size, the study aggregated the retinopathy cases, consisting of 51 cases of background to early-stage retinopathy and 19 cases of proliferative retinopathy, into a single group. The results showed that there was no significant difference in total protein levels between the two groups (no retinopathy: mean 71.1g/L, SD 7.79; retinopathy: mean 69.1g/L, SD 8.04; P = 0.133). Similarly, there was no significant difference in albumin levels between the two groups (no retinopathy: mean 38.8g/L, SD 5.96; retinopathy: mean 38.5g/L, SD 7.22; P = 0.763). However, there was a significant difference in globulin levels between the two groups (no retinopathy: mean 18.0g/L, SD 9.14; retinopathy: mean 30.1g/L, SD 5.04; P < 0.001). The albumin-to-globulin ratio was also significantly different between the two groups (no retinopathy: mean 2.8, SD 2.06; retinopathy: mean 1.3, SD 0.33; P < 0.001). Additionally, HbA1c levels were significantly higher in individuals with retinopathy compared to those without retinopathy (no retinopathy: mean 7.4%, SD 1.58; retinopathy: mean 8.0%, SD 1.49; P = 0.020). No significant difference in CRP levels between the two groups was found (no retinopathy: mean 22.4mg/L, SD 39.38; retinopathy: mean 29.8mg/L, SD 61.73; P = 0.396). The Mann-Whitney U test was used to compare the CRP levels between diabetic patients with and without retinopathy (Table 2). However, no significant difference between the two groups was identified (Z= -0.013, p=0.990). The total protein levels in diabetic patients with and without retinopathy were compared using a t-test (Fig. (2). The mean values for the male+no retinopathy, male+retinopathy, female+no retinopathy, and female+ retinopathy groups were 71.8, 69.7, 70.6, and 68.7 g/L, respectively. There were no significant differences between the male groups (p=0.323), female groups (p=0.281), or male versus female (p=0.373).
| Laboratory Parameters | Retinopathy | N | Mean | SD | 95% CI | p* | |
|---|---|---|---|---|---|---|---|
| Total protein (g/L) | No | 69 | 71.1 | 7.79 | (-0.63 | 4.69) | 0.133 |
| Yes | 70 | 69.1 | 8.04 | ||||
| Albumin (g/L) | No | 69 | 38.8 | 5.96 | (-1.88 | 2.56) | 0.763 |
| Yes | 70 | 38.5 | 7.22 | ||||
| Globulin (g/L) | No | 69 | 18.0 | 9.14 | (-14.57 | -9.60) | <0.001 |
| Yes | 70 | 30.1 | 5.04 | ||||
| Albumin-to-globulin ratio | No | 69 | 2.8 | 2.06 | (1.01 | 2.02) | <0.001 |
| Yes | 70 | 1.3 | 0.33 | ||||
| Glycosylated hemoglobin A1c (%) | No | 69 | 7.4 | 1.58 | (-1.13 | -0.10) | 0.020 |
| Yes | 70 | 8.0 | 1.49 | ||||
| C-reactive protein (mg/L) | No | 69 | 22.4 | 39.38 | (-24.88 | 9.90) | 0.396 |
| Yes | 70 | 29.8 | 61.73 | ||||
| Retinopathy | N | Mean Rank | Z | p | |
|---|---|---|---|---|---|
| CRP | No | 69 | 69.96 | -0.013 | 0.990 |
| Yes | 70 | 70.04 |

The globulin levels in diabetic patients with and without retinopathy were compared using a t-test (Fig. 3). The mean value for the no retinopathy group was 18 g/L, while the mean value for the retinopathy group was 30.1 g/L. The difference between the two groups was statistically significant (p<0.001). Similar levels of elevated globulin were observed in both male and female patients who had retinopathy.
Pearson's correlation coefficient was used to assess the relationship between globulin levels and albumin levels in diabetic patients with and without retinopathy (Fig. 4). In the group of patients with no retinopathy, there was a weak negative correlation between globulin and albumin levels, with a Pearson's correlation coefficient of -0.146 (p=0.231). Similarly, in the group of patients with retinopathy, there was
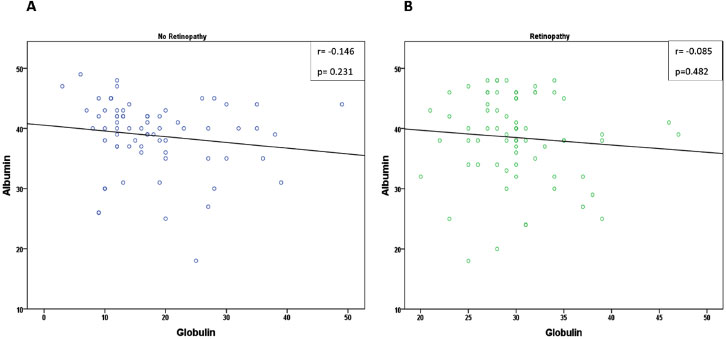
also a weak negative correlation between globulin and albumin levels, with a Pearson's correlation coefficient of -0.085 (p=0.482). However, neither of these correlations was statistically significant.
4. DISCUSSION
The primary aim of this study was to identify potential risk factors associated with retinopathy, a condition that often progresses silently and poses a threat to vision over an extended period. To achieve this goal, the study analyzed differences in routinely performed blood markers between diabetic patients with and without retinopathy. The study's findings could shed light on the underlying pathophysiological mechanisms involved in DR's development and suggest potential targets for future interventions aimed at reducing the burden of this condition.
While several studies have indicated a connection between hypoalbuminemia and inflammation, the relationship between serum albumin levels and DR in individuals with type 2 diabetes remains unclear. Few studies have reported a correlation between total serum protein and serum albumin levels and the severity of DM [20-22]. However, in our study, there was no significant difference in total protein and albumin levels observed between the two groups, and all mean values were within the standard reference range for adults and the elderly [23]. This could be explained by the fact that the majority of the patients in the study were in the early stages of non-proliferative retinopathy we were comparing diabetic individuals with and without DR.
CRP can be elevated in various inflammatory conditions [24]. Several studies have suggested a possible association between higher CRP levels and more severe diabetic retinopathy (reviewed by Song et al., 2015 [25]). In this study, no significant difference was observed in CRP levels between diabetic patients with and without retinopathy. Notably, both groups already had elevated CRP levels that exceeded the upper normal level described by Borai et al., 2016. CRP is an acute-phase protein synthesized primarily in hepatocytes as a response to tissue damage, inflammation, or infection [26]. Previous studies have shown that both type 1 and type 2 diabetes patients have elevated levels of CRP [27, 28], which is associated with a higher risk of diabetic microvascular complications, including nephropathy, neuropathy, and retinopathy [25, 29, 30]. According to a study conducted by Fangfang Qiu et al., CRP induced the overproduction of reactive oxygen species and pro-inflammatory factors through CD32/NF-kB signaling, resulting in retinal cell apoptosis and subsequent retinal dysfunction in both diabetic and non-diabetic states [31].
In contrast, we found that globulin levels and the albumin-to-globulin ratio were significantly different between diabetic patients with and without retinopathy. Lindsay et al. discovered a favorable association between globulin and the prevalence and progression of diabetes [32]. Elevated globulin levels have been associated with chronic inflammation and are known to be a risk factor for various diseases, including diabetes [32]. Serum globulin contains acute phase response proteins, complements, immunoglobulins, and other proteins that participate in inflammatory responses, making it a reliable marker of inflammatory status [33]. However, the relationship between globulin and DR has been largely overlooked. Liu et al. suggest that regulating TNF through globulin elevation could decrease BCL2 expression [34]. Animal studies have revealed that globulin can exacerbate kidney damage by increasing the production of TNF-, IL-6, and IL-1 [35]. Additionally, globulin may inhibit the expression of various miRNAs by promoting inflammatory cells to secretion [36]. According to Nakazawa D et al., elevated globulin levels can induce neutrophil secretion, which is a risk factor for diabetes complications [37]. The results of our study suggest that there is a positive correlation between globulin levels and DR. This discovery can provide additional support for the connection between inflammation and DR and could be utilized as a potential treatment strategy for DR patients in the future.
The albumin-to-globulin ratio, which represents the proportion of albumin proteins compared to globulins in the blood, is normally higher than 1 due to the body's production of more albumin than globulins. Previous work has indicated that anomalous ratios can be indicative of an individual's inflammatory status over a medium to long-term period [38, 39]. Despite this, the relationship between the albumin-to-globulin ratio and DR has not been fully explored. Our study discovered a lower ratio in the DR group, indicating that this ratio could also function as a valuable biomarker for the disease.
Another significant finding of the study was the elevated levels of HbA1c observed in subjects with retinopathy compared to those without retinopathy. This finding is consistent with prior research that has established a positive correlation between HbA1c levels and the risk of developing retinopathy in diabetic patients [40-42]. Other studies have also reported that HbA1c is more accurate in detecting DR than fasting blood glucose levels [43, 44]. Moreover, Matsushita et al. demonstrated that HbA1c alone could potentially predict the likelihood of developing DM, as reflected by the increasing incidence of retinopathy correlated with rising HbA1c levels over a four-year period [45]. The higher HbA1c levels found in individuals with retinopathy may be attributed to poor glycemic control, a known risk factor for the development of diabetic retinopathy.
One limitation of our study is that it may not have fully captured the correlation between blood components and DR by not considering DR severity in the analysis. This was mainly due to the small sample size and the fact that most cases were diagnosed with background retinopathy to moderate non-proliferative DR. Therefore, future studies should strive to incorporate DR severity assessments to provide a more comprehensive understanding of the relationship between DR, visual outcomes, and inflammatory markers. Moreover, it is imperative to acknowledge the constraint of generalizability, as the study was conducted in a single clinical setting.
CONCLUSION
The study highlights the potential utility of routine blood biomarkers as indicators for retinopathy in type 2 diabetes, particularly the observed increase in serum globulin levels, HbA1c, and decrease in the albumin-to-globulin ratio. These findings suggest that inflammation and poor glycemic control may equally contribute to the development of DR. However, further research is needed to determine the underlying mechanisms and clinical relevance of these biomarkers.
AUTHORS' CONTRIBUTIONS
The study was conceptualized by AYA and NSS. RYB and HAA collected and double-checked the dataset, while AYA, MAK, and NSS performed data analysis and interpretation. NSS and AYA authored the manuscript. All authors reviewed and approved the final version of the manuscript.
LIST OF ABBREVIATIONS
| CRP | = C-reactive protein |
| DM | = diabetes mellitus |
| DR | = diabetic retinopathy |
| HbA1c | = glycated hemoglobin A1c |
| IL | = interleukins |
| SD | = standard deviation |
| T2D | = type 2 diabetes |
ETHICS APPROVAL AND CONSENT TO PARTICIPATE
IRB approval was obtained from King Abdullah International Medical Research Center (#RSS22J-006-07).
HUMAN AND ANIMAL RIGHTS
No animals were used in this research. All procedures performed in studies involving human participants were in accordance with the ethical standards of institutional and/or research committee and with the 1975 Declaration of Helsinki, as revised in 2013.
CONSENT FOR PUBLICATION
Consent was provided by all patients following the guidelines of the declaration of Helsinki.
STANDARDS OF REPORTING
STROBE guidelines were followed.
AVAILABILITY OF DATA AND MATERIALS
The data that support the findings of this study are available from the corresponding author [N.S], on special request.
FUNDING
None.
CONFLICT OF INTEREST
The authors declare no conflict of interest financial or otherwise.
ACKNOWLEDGEMENTS
Our appreciation is extended to ChatGPT for the provision of English proofreading services for our document.

