All published articles of this journal are available on ScienceDirect.

The Investigation of Type 2 Diabetic Retinopathy in Conjunction with Dry Eye Disease: A Pilot Study
 iD
iD
Authors Info & Affiliations
Abstract
Introduction
Dry Eye Disease (DED) is a prevalent eye condition, with Type 2 Diabetes (T2D) being a risk factor for DED. However, there remains limited up-to-date national research on the association and etiological relationship between Type 2 diabetic retinopathy and dry eye disease (DR-DED). This study aims to compare glycemic biomarkers and ocular surface health in patients with DR-DED and those with DR-only.
Methods
This is a pilot exploratory study; we included adult patients (aged ≥ 18) with type 2 diabetes (T2D). This study consists of two groups: DR-DED (n=11) and DR-only (n= 7). Type 1 diabetes mellitus patients, patients with terminal diagnoses such as cancer, and patients who use chemotherapy as a treatment were excluded. All the patients' data were collected from the electronic health system of the Ibsar Specialist Center between January 2023 and December 2023. Statistical analysis was performed with GraphPad Prism. Continuous data were presented as medians with Interquartile Ranges (IQR), and categorical variables were presented as frequencies and percentages. Between-group comparisons were performed using relevant nonparametric statistical tests. Correlations between variables were tested using Spearman’s rank correlation coefficient. A two-sided P value of <0.05 was considered statistically significant.
Results
The DR-DED group showed decreases in both ocular tests (Tear break-up time and Schirmer test) compared to the DR-only group, with statistically significant differences (P < 0.0010 and P < 0.0052, respectively). In addition, the median fasting blood glucose level was lower in the DR-DED group than in the DR-only group, but the difference was not statistically significant. Glycated hemoglobin (HbA1c) was not different across groups. The DR-DED group presented a higher prevalence of systemic comorbidities. The DR-only group was more frequently treated with oral antidiabetic medications instead of insulin. There was a negative correlation, with no statistically significant difference, between HbA1c levels and Schirmer test scores in the DR-DED group, whereas the opposite was observed in the DR-only group.
Discussion
This pilot study reports that DR-DED patients have blood glycemic biomarkers similar to those in patients with DR-only but differ in ocular surface health. Additionally, DR-only patients taking insulin injections showed improvements in ocular surface health compared to DR-DED patients. Consequently, it is recommended to perform ocular surface screenings as routine alongside routine retinopathy checks to manage early diagnosis of DED in DR populations.
Conclusion
This study shows that patients with DR-DED had a significantly greater ocular tear health burden than those with DR-only, even though their blood sugar levels were controlled to the same extent. These data indicate that factors beyond glycemic management may contribute to ocular surface deterioration in patients with diabetic retinopathy. Further investigation of hypothesized pathways and the influence of systemic treatment on ocular outcomes would require larger prospective studies.
1. INTRODUCTION
Dry Eye Disease (DED) is a multifactorial ocular surface disease characterized by tear-film instability and is common among individuals with Diabetes Mellitus (DM) [1]. DM is a chronic endocrine disorder characterized by β-cell dysfunction, leading to increased blood glucose concentrations due to various insulin-related factors. DM was ranked as one of the causes of death with worldwide global prevalence and growth [2]. Type 2 diabetes mellitus (T2D) is the most common type, with an estimated 95% of all DM types. Moreover, it is known that T2D has complications leading to cardiovascular disease, cancer, diabetic nephropathy, diabetic neuropathy, and Diabetic Retinopathy (DR) [3], and diabetic keratopathy [4]. Type 2 diabetes is a prevalent endocrine disorder with complications involving multiple systems, including the ocular surface and retina. Among these complications, DR is common, and DED frequently co-occurs with DR.
DR is a common complication of T2D, with less than half of patients developing it, which can lead to loss of vision [5]. Additionally, a study reveals a significant correlation between the severity of DR and DED, an ocular surface disorder resulting from the dysregulation of tear-film homeostasis and inflammation [6]. A prior investigation conducted by Mohammed et al. reported a reduction in tear-film stability as indicated by Schirmer test results and Tear-Break-Up Time (TBUT). Furthermore, a correlation exists between the severity of dry eye and diabetic retinopathy, suggesting decreased corneal sensitivity [7]. The severity of dry eye and diabetic retinopathy can cause damage to the eye's surface, leading to permanent vision loss in the most severe cases [4, 6, 8, 9]. The chronic inflammation associated with diabetes has resulted in damage to the optic nerve and ocular surface, which adversely affects the quality and function of tear production [10].
Most patients presenting to the clinics with complaints related to ocular surface involvement are far advanced in DM or already have Type 2 diabetic retinopathy [11]. Patients with diabetes who have experienced a longer duration of the condition and exhibit poorly managed blood glucose levels demonstrate a heightened susceptibility to the development of severe ocular surface disease [12]. Furthermore, inflammation arising from these microvascular changes increases the likelihood of visual impairment and blindness, thereby exacerbating retinal dysfunction and progression of ocular disease [13].
From a pathological perspective, systemic inflammatory biomarkers, such as glycated hemoglobin (HbA1c), are significant markers of T2D progression, and elevated levels have been frequently observed in DR [14]. A previous study reported a statistically significant positive correlation between the duration of diabetes and the prevalence of DED [15]. Another study shows that a higher mean HbA1c level is associated with DR [16]. Besides HbA1c, DR has several abnormal inflammatory pathways, including protein kinase C, which increases inflammatory factors such as Interleukin 6 (IL-6), Tumor necrosis factor alpha (TNF-α), Interferons (IFNs), and Vascular Endothelial Growth Factor (VEGF).
Several proinflammatory signals stimulate the transcription factor nuclear factor-κB (NF-κB) either in canonical or non-canonical pathways [17]. The non-canonical pathway is triggered by limited stimuli, such as TNF-α, a key proinflammatory cytokine involved in inflammation, leading to the activation of NF-κB-inducing kinase [17]. In detail, NF-κB is a key transcription factor that drives the expression of IL-6, as it is involved in acute responses such as glucose metabolism [18].
Moreover, C-Reactive Protein (CRP) is a routine biomarker of systemic inflammation, and elevated levels have been reported in patients with DR in tear samples [5]. Alhalwani et al. reported a positive correlation between HbA1c and several systemic inflammatory biomarkers, including CRP, in T2D-DED patients [19, 20]. These biomarkers warrant investigation of potential differences in systemic glycemic biomarkers for assessing systemic inflammation, as indicated by routine clinical laboratory metrics and glycemic control, in patients who develop DED.
Nonetheless, more recent national research is needed in the region to examine the association between T2D and DED. However, a study done in 2023 showed a high prevalence of DED among the Saudi population, likely due to environmental factors [21]. DED is highly prevalent among diabetes patients, along with DR and diabetic cataracts.
However, it is unclear how DM and DED are related due to multifactorial etiology. Therefore, the proposed study aims to discuss the etiology and the tendency to develop DED by comparing Type 2 diabetic retinopathy patients with Type 2 diabetic patients without retinopathy at the Ibsar Specialist Center clinic in Jeddah, Saudi Arabia. In either case, dry eyes must be recognized and managed early to prevent complications.
The rationale for studying DED in DR patients is that DR involves sensory nerve damage in the anterior segment, which can lead to microvascular complications and posterior segment complications, such as lacrimal dysfunction, and can predict ocular surface failure. Fewer studies have focused on DR and DED, but to our knowledge, no study has screened for glycemic blood biomarkers, tear stability, and medication simultaneously [6, 22, 23].
To our knowledge, this is the first study to investigate glycemic blood biomarkers, ocular health tests, and medication type in DR-DED and DR-only patients. Examining this relationship will help identify the potential to promote early diagnosis and treatment of DED in patients with diabetic retinopathy. The study hypothesized that DR patients with DED would have poorer glycemic control and burden in ocular surface health than DR patients without DED. This study aims to explore the relationship between glycemic levels and tear health status in patients with DR, with and without DED.
2. MATERIALS AND METHODS
2.1. Study Population
This is a pilot, exploratory, retrospective, case-control study of patients with Type 2 diabetes who visited the Ibsar Specialist Center (a specialized ophthalmology clinic) in Jeddah, Saudi Arabia, between January 2023 and December 2023. Patients were selected consecutively (all eligible cases in that period) and divided into two groups after applying exclusion criteria: study group (DR-DED, n=11): T2D patients with diabetic retinopathy who also had dry eye disease, and control group 2 (DR-only, n=7): T2D patients with diabetic retinopathy without DED. A power analysis for this study group was performed to assess the study's statistical power using the Clinical Sample Size Calculator on the website [24]. The sample size was determined by the number of study groups and the prevalence of DR (n=7, 19.7%) [25]. Also, resulting in a control group and a prevalence of DR-DED (n=11, 54.3%) [26]. To improve statistical power, a 2:1 enrollment ratio was used in the power analysis with a dichotomous primary endpoint and a two-sided alpha of 0.05. Based on the study group of [Group 1%] in the control group and [Group 2%], the study power was 80%. The calculated sample size was 18, with 11 in the study group and 7 in the control group. This is a retrospective clinical study that included adults (age ≥ 18) and excluded patients with Type 1 diabetes, cancer, and those on chemotherapy.
All groups were diagnosed with T2DM based on confirmed clinical records using glycemic systemic biomarkers: fasting blood glucose (FBG > 126 mg/dL) and glycated hemoglobin (HbA1c ≥ 6.5%).
All groups were diagnosed with DR based on confirmed clinical records, using the interpretation protocol for retinal Optical Coherence Tomography (OCT) imaging. DR classification: Patients were classified as having DR if any diabetic retinal changes were detected on fundus examination, including mild, moderate, or severe non-proliferative diabetic retinopathy or proliferative diabetic retinopathy, according to the International Clinical Diabetic Retinopathy Disease Severity Scale. OCT was performed for all suspected cases and served as an adjunctive diagnostic tool, particularly in eyes with subtle or early retinal changes, where clinical examination alone was insufficient for a definitive diagnosis. OCT findings were reviewed by experienced ophthalmologists and used to confirm retinal abnormalities consistent with diabetic retinal involvement. All clinical examinations and OCT acquisitions were performed by trained ophthalmic personnel in accordance with standardized institutional imaging protocols. Image interpretation was conducted by an experienced ophthalmologist. In cases of diagnostic uncertainty, images were reviewed by a second examiner, and a consensus diagnosis was reached.
All groups were diagnosed with DED using the Ocular Surface Disease Index (OSDI) questionnaire, as well as tests such as Fluorescein tear break-up time (TBUT) and Schirmer without anesthesia. The threshold used was TBUT ≤ 10 seconds to measure tear-film stability [27]. The threshold used was a Schirmer score ≤10 mm to measure tear production [28]. The Schirmer test and TBUT are used for clinical diagnosis of DED. The Schirmer test evaluates tear production in the eyes with or without anesthesia. For basal tear secretion without a tear reflex, the test is performed without anesthesia, and a cotton swab is used to dry the cul-de-sac in the eye. Then, the paper strip, scaled from 0 mm to 35 mm, is placed over the lower lid for 5 min. To evaluate the tear production result, there are four categories: 0 to 5 mm, severe dry eye; 5 to 10 mm, moderate dry eye; 10 to 15 mm, mild dry eye; and greater than 15 mm, normal [29]. TBUT is an invasive method that uses a fluorescein strip or solution in the eye to test film stability, with a reported specificity and sensitivity of 75%. The mean of TBUT for the normal eye is 27 seconds. Values under 10 seconds are considered indicative of dry eye disease [27].
All patients with diabetes who had incomplete results for required glycemic systemic biomarker tests, retinal imaging, and ocular surface evaluation were excluded from the study.
Systemic comorbidities, defined as the presence of co-occurring systemic diseases, including hypertension and cardiac disease, were recorded as present or absent based on medical record data. Antidiabetic medications were also collected, with an indication of whether insulin or oral medications were used.
Due to the retrospective design and limited data availability, we did not perform a formal sample size calculation prior to the study. Instead, the sample size was determined by the number of patients meeting the inclusion criteria within the specified timeframe.
2.2. Data Collection and Analysis
All statistical analyses were performed using GraphPad Prism (GraphPad Software, USA) after the data had been gathered in Microsoft Excel and exported for analysis. Because the study groups were small, nonparametric statistical approaches were applied throughout. Continuous variables (age, Fasting Blood Glucose [FBG], glycated hemoglobin [HbA1c], Tear Break-Up Time [TBUT], and Schirmer test score) are reported as medians and Interquartile Ranges (IQRs). The two-tailed Mann-Whitney U test was used to compare groups. Due to limited numbers in several cells, categorical variables (gender, body mass index category) were examined using Fisher’s exact test.
Spearman’s rank correlation coefficient (ρ) was used to evaluate correlations between tear parameters and laboratory results. Correlation coefficients can range from +1 (the perfect positive monotonic association) to -1 (the perfect negative monotonic association). All correlation analyses were two-tailed. All statistical tests were two-sided, and P values of <0.05 were considered statistically significant.
3. RESULTS
3.1. Demographic Characteristics and Laboratory Findings Data
The demographic characteristics across groups for a total of n = 18 patients, comprising n = 11 in the DR-DED group and n = 7 in the DR-only group (Table 1).
| Parameter | DR-DED (n = 11) | DR-only (n = 7) | P-value |
|---|---|---|---|
| Age, years | |||
| Mean (SD) | 66.09 (9.50) | 52.86 (20.44) | |
| Median | 65.00 | 47.00 | 0.1439* |
| IQR | 59.00 - 75.00 | 37.00 - 72.00 | |
| Gender n (%) | Male: 2 (18.2%) | Male: 3 (42.9%) | 0.3260** |
| Female: 9 (81.8%) | Female: 4 (57.1%) | ||
| Body Mass Index (BMI), n (%) | |||
| Normal: 1 (9.1%) | Normal: 1 (14.3%) | 0.7484** | |
| Overweight: 8 (72.7%) | Overweight: 6 (85.7%) | ||
| Obese: 2 (18.2%) | Obese: 0 (0.0%) | ||
| Fasting Blood Glucose (mg/dL) | |||
| Mean (SD) | 106.0 (13.77) | 120.0 (35.36) | 0.5714* |
| Median | 110.0 | 120.0 | |
| IQR | 91.5 - 118.5 | 95.0 -145.0 | |
| HbA1c (%) | |||
| Mean (SD) | 7.46 (1.42) | 7.50 (0.96) | 0.9151* |
| Median | 7.00 | 7.50 | |
| IQR | 6.50 - 8.50 | 7.00 - 8.00 | |
| Tear Break-Up Time (seconds) | |||
| Mean (SD) | 6.91 (1.14) | 10.86 (1.95) | 0.0010* |
| Median | 7.00 | 11.00 | |
| IQR | 6.00 - 8.00 | 10.00 - 12.00 | |
| Schirmer Test (mm) | |||
| Mean (SD) | 7.46 (1.75) | 11.14 (2.41) | 0.0052* |
| Median | 7.00 | 12.00 | |
| IQR | 6.00 - 9.00 | 11.00 - 13.00 | |
Note: BMI scale: normal <25 kg/m2, overweight= 25-30 kg/m2, obese >30 kg/m2.
*Continuous variables compared using two-tailed Mann-Whitney U test (exact P values).
**Categorical variables compared using the Fisher Exact test due to small cell counts.
Median age was greater in the DR-DED group than in the DR-only group (65.0 [59.0-75.0] compared to 47.0 [37.0-72.0] years), but the difference was not statistically significant (P = 0.1439). There was a higher percentage of females and males in the DR-DED group (81.8% and 18.2%) than in the DR-only group (57.1% and 42.9%), but this was not significantly different across groups (P = 0.3260). Most individuals in both groups were overweight, and there was no significant difference in the distribution of BMI categories between groups (P = 0.7484).
For metabolic parameters, the median Fasting Blood Glucose (FBG) was partially lower in the DR-DED group than in the DR-only group (110.0 [91.5–118.5] mg/dL vs. 120.0 [95.0–145.0] mg/dL). However, the difference was not significant (P = 0.5714). Median HbA1c levels were also similar between groups (7.0 [6.5–8.5] compared to 7.5 [7.0–8.0] %) and not statistically different (P = 0.9151).
However, there was considerable variation in clinical diagnostic tools, such as Tear Function Parameters (TBUT) and the Schirmer test. Median TBUT was considerably shorter in the DR-DED group than the DR-only group (7.0 [6.0–8.0] compared to 11.0 [10.0–12.0] seconds; P = 0.0010). The median Schirmer test results were significantly lower in the DR-DED group (7.0 [6.0-9.0] mm vs. 12.0 [11.0-13.0] mm; P = 0.0052).
3.2. The Medical Information Data
Regarding systemic comorbidities, the DR-DED group was more likely to have co-existing systemic conditions (e.g., hypertension, cardiac disease) than the DR-only group (8% versus 25%). However, both groups had similar rates of prior ocular surgery, smoking history, and contact lens use, as shown in Fig. (1).
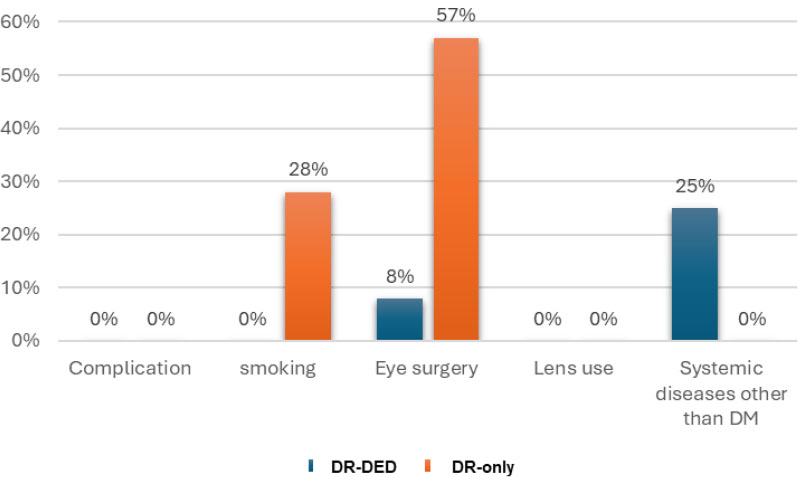
Some medical history information for DR-DED patients (blue) and DR-only patients (orange).
3.3. Characteristics of Antidiabetic Medications
In the DR-DED group, the majority of patients (100%) were managed with oral medication. In the DR-only group, 71% required insulin, while 28% were on oral medications, as shown in Fig. (2). The statistical significance of these differences was assessed using Fisher's exact test (P < 0.004). These results indicate a substantial disparity in medication methodologies between the two groups.
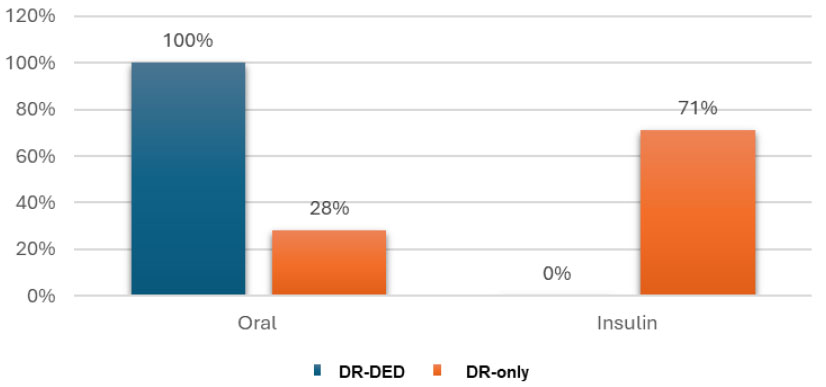
The medication types (oral tablet versus insulin injection) for DR-DED patients (blue) and DR-only patients (orange).
3.4. Correlation Study between the Schirmer Test and HbA1c
Figure 3 illustrates the correlation between glycemic management and tear production, examined in each study group using Spearman’s rank correlation analysis of HbA1c (%) and Schirmer test scores (mm). There was no statistically significant correlation between HbA1c levels and Schirmer test scores in the DR-DED group (n = 11) (ρ = -0.25, 95% CI -0.75 to 0.43; P = 0.459), indicating a weak negative but non-significant association (Fig. 3A).
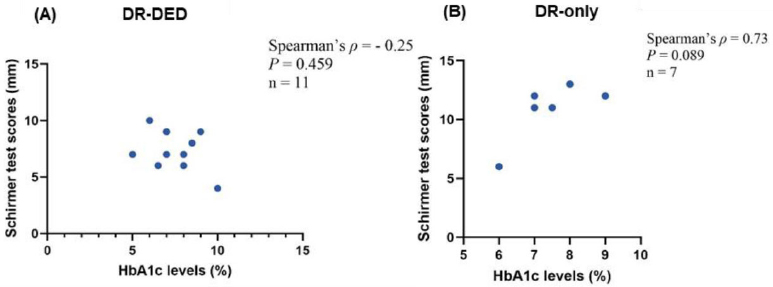
Scatterplots for correlation between HbA1c levels and Schirmer's Test scores for DR-DED patients (A) and DR-only patients (B).
In the DR-alone group (n = 7), a positive trend between HbA1c levels and Schirmer test scores was also noted but was not statistically significant (ρ = 0.73; P = 0.089) (Fig. 3B).
In patients without DED, a positive trend was identified between HbA1c levels and Schirmer test scores; no trend was observed in patients with DED. However, the relationships did not approach statistical significance in either group. These findings should be interpreted cautiously due to the potential influence of small sample sizes.
4. DISCUSSION
In this pilot exploratory study, Type 2 diabetic patients with retinopathy and dry eye (DR-DED) showed worse tear-film metrics (shorter TBUT, lower Schirmer scores) than those without dry eye disease, despite similar HbA1c levels. They also differed in systemic comorbidities and patterns of diabetes medication. A previously reported study found that ocular surface disease is common among patients with Type 2 diabetes [1]. The pathophysiology of diabetic retinopathy has been linked to retinal inflammation and dysfunction that promote disease progression [13]. Adults with Type 2 diabetic retinopathy are more likely to develop microangiopathies as well as further neurosensory complications [6, 9, 30]. Furthermore, inflammation is a major cause of vision impairment and blindness in Type 2 diabetic retinopathy due to microvascular complications [31]. These findings suggest that optimizing glycemic control and reducing systemic inflammation could potentially delay the onset or progression of DED in patients with DR.
The median age of DR-DED patients was in the elderly adult range, aligning with previous studies that have shown increasing age is a risk factor for DED in diabetics [32, 33]. Additionally, the DR-DED group in this study was predominantly female. DR and DED have significant gender associations or higher prevalence in females, as supported by prior studies, which also indicate that both DR [16, 34] and DED [6] are more common in females, suggesting sex hormones or health-seeking behaviors might contribute to this observation. High BMI could exacerbate both diabetes and ocular surface stress; however, in this study, BMI did not differentiate between those with and without DED, as both groups were overweight on average.
High BMI could exacerbate both diabetes and ocular surface stress; however, in this study, BMI did not differentiate between DR patients with and without DED, as both groups were overweight on average. A previous prospective cohort study that was done in the UK showed that high BMI may indicate potential causal risk to diabetic microvascular complications [35].
This study's data show that DR-DED patients had a lower median fasting blood glucose level than DR-only patients. This suggests that DED incidence may not be predictable solely based on glycemic control. It highlights the importance of close diabetic patient monitoring along with ocular surface testing to prevent DED in DR patients.
Both DR-DED and DR-only groups had similar HbA1c, consistent with poor long-term glycemic control in people with diabetes with retinopathy [36]. This is supported by Manaviat et al. [26], who found a significant association between DED and the duration of DR, which invites further investigation into the intricate interplay among DR, DED, and glycemic control factors.
The ocular examination findings, including TBUT and Schirmer test results, indicate a significant difference between DR-DED and DR-only. This finding is consistent with a previous study by Shaikh et al. [37], which found a higher incidence of DED among patients with DR, underscoring that ocular surface evaluations should accompany retinal exams in diabetic care [6, 38]; it matches the existing literature that suggests an association between DR and the risk of having DED [16, 34]. This aligns with the understanding that microangiopathy in diabetes can affect not only the retina but also the lacrimal gland and corneal innervation, contributing to DED [6, 30].
Strict glycemic control (through appropriate antidiabetic therapy) is known to reduce the progression of diabetic retinopathy [39]. The current study adds to this body of knowledge by noting a stark difference in diabetes management between the groups: DR-only patients were much more likely to be on insulin therapy, whereas DR-DED patients were primarily managed with oral medications. DR-DED patients (28%) were using insulin, compared to DR-only patients (71%). This finding aligns with prior studies by Çakır et al. [40] and Roy Chowdhury et al. [41], who reported that diabetic patients on oral hypoglycemics exhibited shorter TBUT (i.e., a less stable tear film) than those on insulin, even when HbA1c levels were comparable. Conversely, a recent study indicates that patients using insulin medication have a significantly higher Ocular Surface Disease Index score than those using oral medication [42]. In this study, oral antidiabetic medication was utilized more frequently by patients with DR-DED compared to those with DR-only. Therefore, the medication's impact on the ocular surface and inflammatory pathways should be investigated further. A recent study indicates that oral antidiabetic medications exert systemic effects that extend beyond glycemic control, including Ocular side effects [43]. Therefore, understanding the effects of oral antidiabetic medications, such as metformin, on meibomian gland health is imperative [44]. Meibomian gland dysfunction is a significant contributor to DED, with both type 2 diabetes and retinopathy recognized as risk factors for alterations in the ocular surface [45]. Conversely, patients with DR-only were administered insulin, which may add benefit to the management of DED. A meta-analysis study showed that antidiabetic medication GLP-1, such as albiglutide and semaglutide, has been associated with increases in the risk of early-stage DR. In contrast, decreasing late-stage DR compared to insulin. Therefore, understanding the effects of oral antidiabetic medication on ocular microvascular disease is essential [46].
In DR-DED patients, the correlation results show a negative relationship between increased HbA1c and decreased Schirmer test scores, consistent with previous studies showing retinal microvascular dysfunction in patients with dry eye disease [47-49]. Although prior literature established that DR is associated with a higher risk of DED (29), this study adds nuance by demonstrating differences in the correlation between HbA1c and tear production (Schirmer test) in DR patients with versus without DED [34]. The current study identifies a potential predictor by examining the association between HbA1c and Schirmer test scores in patients with DR with and without DED. This suggests an important association of ocular health status in DR patients as a prognosis tool for DED risk.
This study has limitations worth consideration. Firstly, the limited sample size constrains both statistical power and the generalizability of the findings. Secondly, the retrospective design conducted at a single center may introduce biases in patient selection, as this tertiary facility predominantly attracts a more symptomatic population seeking medical care. Finally, reliance on data available in electronic health records led to missing data, including DR severity stratification and certain systemic inflammatory biomarkers such as CRP, thereby necessitating cautious interpretation of the results regarding their broader applicability.
Future research should address these limitations by adopting a prospective approach, conducting a multi-center or longer-duration study, and implementing DR severity stratification to recruit more patients, while prioritizing a thorough power analysis before data collection. Additionally, since age, diabetes duration, and antidiabetic medication types are important confounders, larger cohorts are needed in future research to examine their impact thoroughly. Finally, it is recommended to test the correlation between the Schirmer test and HbA1c in a larger, longitudinal study with an adequate sample size to detect clinically meaningful effects, thereby strengthening the robustness of these findings.
CONCLUSION
This pilot, research-based study explores the relationship between blood glucose indicators and tear film stability in patients with DR and DED. The study's data recommend that factors beyond glycemic management may contribute to ocular surface deterioration in patients with diabetic retinopathy. Further investigation in a larger population is needed to assess the influence of antidiabetic systemic treatment on ocular health outcomes and to detect clinically meaningful effects.
AUTHORS’ CONTRIBUTIONS
The authors confirm their contribution to the paper as follows: W.A., A.Y.A., and S.A.: Study conception and design; W.A.: Data collection; S.J. and A.Y.A.: Analysis and interpretation of results; A.Y.A., M.M., R.Y.B., and L.A.: Draft manuscript. All authors reviewed the results and approved the final version of the manuscript.
LIST OF ABBREVIATIONS
| CRP | = C-reactive protein |
| DED | = Dry eye disease |
| DM | = Diabetes mellitus |
| DR | = Type 2 diabetes retinopathy |
| DR-DED | = Type 2 diabetic retinopathy and dry eye disease |
| FBG | = fasting blood glucose |
| HbA1c | = glycated hemoglobin |
| IFNs | = Interferons |
| IL-6 | = Interleukin 6 |
| NF-κB | = Transcription factor Nuclear factor-κB |
| OSDI | = Ocular Surface Disease Index |
| OCT | = optical coherence tomography |
| TBUT | = tear break-up time |
| TNF-α | = Tumor necrosis factor alpha |
| VEGF | = Vascular endothelial growth factor |
ETHICS APPROVAL AND CONSENT TO PARTICIPATE
The study was conducted in accordance with the guidelines of the Institutional Review Board (IRB) Committee at King Abdullah International Medical Research Center (KAIMRC), Saudi Arabia, which granted ethical clearance for this research, as evidenced by the IRB approval obtained (approval no IRB/2461/22).
HUMAN AND ANIMAL RIGHTS
All procedures performed in studies involving human participants were in accordance with the ethical standards of institutional and/or research committees and with the 1975 Declaration of Helsinki, as revised in 2013.
CONSENT FOR PUBLICATION
Informed consent was waived for this retrospective study due to the exclusive use of de-identified patient data, which posed no potential harm or impact on patient care.
AVAILABILITY OF DATA AND MATERIALS
The data presented in this study are available on request from the corresponding author [A.Y.A].
ACKNOWLEDGEMENTS
Declared none.