All published articles of this journal are available on ScienceDirect.

Repeatability and Reproducibility of Macular Thickness Measurements Using Fourier Domain Optical Coherence Tomography
Authors Info & Affiliations
Abstract
Aim: To evaluate repeatability and reproducibility of macular thickness measurements in visually normal eyes using the Topcon 3D OCT-1000.
Methods: Phase 1 investigated scan repeatability, the effect of age and pupil dilation. Two groups (6 younger and 6 older participants) had one eye scanned 5 times pre and post- dilation by 1 operator. Phase 2 investigated between-operator, within and between-visit reproducibility. 10 participants had 1 un-dilated eye scanned 3 times on 2 separate visits by 2 operators.
Results: Phase 1: No significant difference existed between repeat scans ( p = 0.75) and no significant difference was found pre- and post-dilation (p=0.54). In the younger group variation was low (95% limits ± 3.62 µm) and comparable across all retinal regions. The older group demonstrated greater variation (95% limits ± 7.6 µm).
Phase 2: For a given retinal location, 95% confidence limits for within-operator, within-visit reproducibility was 5.16 µm. This value increased to 5.56 µm for the same operator over two visits and to 6.18 µm for two operators over two visits.
Conclusion: A high level repeatability, close to 6 µm, of macular thickness measurement is possible using the 3D OCT- 1000. Measured differences in macular thickness between successive visits that exceed 6 µm in pre-presbyopic individuals are therefore likely to reflect actual structural change. OCT measures are more variable in older individuals and it is advisable to take a series of scans so that outliers can be more easily identified.
INTRODUCTION
The development of Optical Coherence Tomography (OCT) to produce high resolution tomographs has allowed detailed investigation of retinal structure [1]. It is a routine, non-invasive method of imaging used to detect and measure retinal changes [2]. Time Domain OCT (e.g. Stratus OCT, Carl Zeiss Meditec, Dublin, CA) utilises a low coherent light source to penetrate retinal tissue. The differential between the echo time delay of light from a reference beam is compared to that from a sample beam, allowing the reflectivity between intraocular microstructures to be measured [3]. The measurement of reflectivity versus depth produces an axial scan (A-scan) and consecutive A-scans set side by side produce a two-dimensional B-scan [4]. Acquiring approximately 400 axial scans per second, a standard 512 A-scan image is obtained in approximately 1.3 seconds [5]. Previous studies have investigated the reproducibility of first [6], second [7] and third generation [8-10] OCT instruments. Paunescu et al. [9] reported an interclass correlation coefficient (ICC) of 94% and Polito et al. [10] reported ICC of 80-98% for macular scans.
The recent OCT development of Fourier domain/ spectral detection techniques has lead to dramatic improvements in image quality and acquisition speed [11]. The spatially resolved tissue reflectance of the A-scan is obtained and the interference pattern measured simultaneously by the spectrometer increases speed, reduced motion arte effects and improves image quality [12]. The development of Fourier-domain OCT offers considerable scope for improved detection and management of ophthalmic disease [13, 14]. However, in order for this new technology to be introduced into routine practice, replacing the existing time domain OCT, repeatability and reproducibility must be established. The results of studies comparing time- and Fourier domain OCT instruments are just beginning to emerge [15]. The present study has been designed to prospectively examine factors that may affect repeatability and reproducibility of a Fourier-domain OCT.
METHODS
In the context of the present study, repeatability is the variability of measurements by the same operator measuring the same entity, under the same conditions within a short period of time. It is a measure of the precision of the instrument. The standard deviation (SD) of the repeated measurements is a measure of repeatability. Reproducibility is the variability of measurements obtained under different conditions e.g. by a different operator or in a different visit [16, 17].
We employed the commercially available 3D OCT-1000 (Topcon, Tokyo, Japan) with version 2.00 software which the manufacturers claim measures to a resolution of 6 µm. The instrument utilises a Fourier domain spectrometer producing cross-sectional B scans and 3-D volumetric images at a speed of 25,000 A scans /sec. The parameters for all scans in this study were a 3D macula scan covering 6 x 6 mm, resolution 256 x 256 (i.e. 65,536 axial scans) imaging the complete macular area and ensuring equal transverse and axial spacing. The Early Treatment of Diabetic Retinopathy Study (ETDRS) 9 region map was used for quantitative evaluation (Fig. 1, [18]).
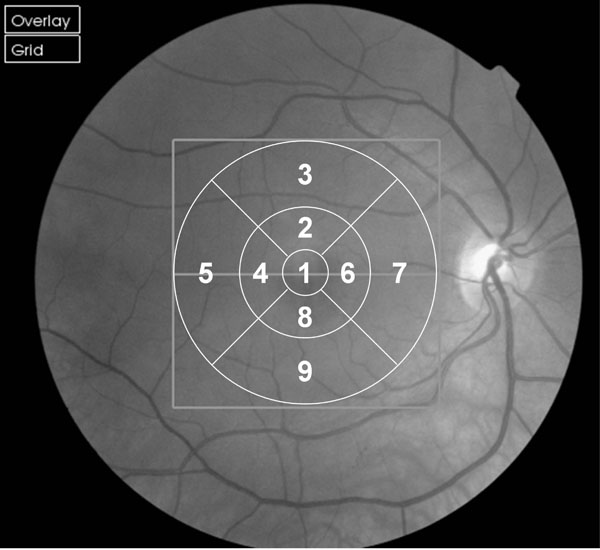
Fundus image of right eye with overlaid ETDRS 9 Region Map. Regions numbered for use in data analysis. For left eyes the region numbers were horizontally mirrored to maintain naso-temporal classification.

Box and whisper plots for older and younger groups at each of the 9 EDTRS (Fig. 1) sectors.
To establish variability across the 10 scans obtained for each participant (Fig. 2) the mean of the OCT measures was determined for each participant at each of the 9 retinal EDTRS sectors (Fig. 1). Then, for each sector, the difference between the mean thickness for that participant and the thickness obtained in their first, second, third etc. scans was determined. Hence, for each box in the plot above a total of 60 differences have been calculated (i.e. based upon 6 participants x 10 scans each). The middle horizontal bar in the box indicates the median difference, and the top and bottom horizontal boundaries of the box represents the third and first quartiles. The top and bottom bars represent the maximum and minimum differences in the absence of outliers. Single scans which are outliers are represented by dots.
Instrument calculations (algorithms) are based on the reflections obtained from the individual A-scans, with the distance between two highly reflective layers (inner limiting membrane and retinal pigment epithelium) representing the thickness of the retina at that point. Scans were judged to be of acceptable quality when the algorithms correctly delineated the retinal layers, as judged by one operator (AB) where no significant motion or blink artefacts prevented acquisition of data.
Participants were recruited from the staff, relatives of staff and patients from the Optometry Clinic at the University of Bradford. Only participants without a history or evidence of ophthalmic disease (including cataract), pathology or surgery, refractive error of less than ±8 D (MSE), ≤ 3D astigmatism and visual acuities of 0.2 Log Mar (6/9 Snellen) or better were included. None of the participants had previously taken part in imaging studies and therefore the sample can be considered to be representative of the general population. Whilst this sample may not reflect the population who would typically undergo OCT assessment (i.e. patients with known or suspected pathology), in order to investigate the optimal repeatability and reproducibility of the Topcon OCT, healthy participants first need to be studied. All participants gave informed consent and the study was conducted according to the tenets of the Declaration of Helsinki.
Phase 1
This phase was designed to identify the minimum number of scans required to ensure measurement repeatability and to assess the effect of age and pupil dilation. Twelve healthy volunteers (7 men, 5 women) formed two groups of 6 subjects, one younger group 30 - 43 years (mean 35.5) and one older group 57 - 78 years (mean 69.5). Each participant had one eye randomly selected (6 RE, 6 LE) and was scanned pre and post pupil dilation (1% Tropicamide) by one of two operators. In total 10 sequential scans (5 pre and 5 post-dilation) were analysed. A small number of scans were discarded mainly due to blinks or eye movement. The number of scans taken ranged from 11-18 (mean ~14 scans).
Phase 2
This phase was designed to investigate between-operator, within and between-visit reproducibility. Ten healthy volunteers (7 men, 3 women) aged 25 - 44 years (mean 32) had 1 eye randomly selected (4 RE, 6 LE). Participants were scanned on 2 separate visits 1-10 days apart (mean 3). At each visit, 3 scans were carried out by 2 different operators. The order of operator was randomised and remained constant for both visits. After each scan the subject was repositioned and the instrument realigned.
In previous scan repetition studies [6, 19, 20] reduced image quality has been reported. Pilot data indicated reduced image quality after multiple scans and a number of participants complained of dry eyes. Artificial tears (Minims Hydroxyethylcellulose 0.44%) were therefore used as necessary to maintain image quality or for participant comfort.
Statistical Analysis
Phase 1:
A repeated measures random-effects regression model (STATA 9.2) was used to determine the effect of repeat scans (1-5) and pupil dilation. The standard deviation (SD) of the differences between participants’ 10 scans was used to estimate repeatability for each group. For Phase 1 the effective sample size was 1080 reflecting the total number of measurements (12 participants x 10 scans x 9 retinal regions).
Phase 2:
Results were analysed using a linear mixed model (‘xtmixed’ command in STATA 9.2) to estimate variance components. This model takes account of the nesting of measurements within visit, observer, and subject (Table 1). For Phase 2 the effective sample size was also 1080 reflecting the total number of measurements (10 participants, 12 scans and 9 retinal regions).
Repeated Measures – Linear Mixed Model (STATA 9.2)
| Coef | Std err | z | P > | z | | 95% CI | ||
|---|---|---|---|---|---|---|
| pupil | -0.318 | 0.526 | -0.61 | 0.545 | -1.349 | 0.712 |
| _cons | 281.900 | 4.205 | 67.04 | 0.000 | 273.658 | 290.141 |
| Random Effects Parameters | Estimate | Std err | 95% CI | |
|---|---|---|---|---|
| Retinal-area variability (SD) | 29.935 | 2.250 | 25.835 | 34.686 |
| Within-operator, within-visit (SD) |
2.634 | 0.060 | 2.519 | 2.755 |
| Between-visit (SD) |
1.059 | 0.500 | 0.420 | 2.671 |
| Between-operator (SD) | 1.376 | 0.252 | 0.961 | 1.970 |
Macular Thickness Values (µm) for All OCT Scans (Dilated and Undilated) at Each EDTRS Region
| Retinal Region (Fig. 1) |
Younger Mean(SD) |
Older Mean(SD) |
Combined Mean(SD) |
|---|---|---|---|
| 1 | 239.13 (16.25) | 250.52 (17.65) | 244.83 (17.84) |
| 2 | 310.62 (12.83) | 299.63 (10.57) | 305.13 (12.94) |
| 3 | 267.33 (12.75) | 260.03 (13.57) | 263.68 (13.61) |
| 4 | 297.87 (14.12) | 291.10 (10.98) | 294.48 (13.04) |
| 5 | 247.53 (17.43) | 244.10 (10.58) | 245.81 (14.46) |
| 6 | 310.78 (11.67) | 302.65 (11.58) | 306.71 (12.27) |
| 7 | 286.77 (15.45) | 279.61 (4.42) | 283.19 (11.87) |
| 8 | 308.35 (13.96) | 298.90 (9.93) | 303.63 (12.96) |
| 9 | 257.75 (13.58) | 260.88 (13.01) | 259.32 (13.33) |
RESULTS
Phase 1
No significant difference was found between each repeat scan (scan 1 vs scan 2, p=0.75; scan 1 vs scan 3, p= 0.8; scan 1 vs scan 4, p = 0.76; scan 1 vs scan 5, p = 0.76) or between non-dilated and dilated scans (p = 0.54).
In order to establish variability across the 10 scans obtained for each participant, the mean of the OCT measures was determined for each participant at each of the 9 retinal EDTRS sectors (Fig. 1). Then, for each sector, the difference between the mean thickness for that participant and the thickness obtained in their first, second, third etc. scans was determined. Fig. ( 2) shows a box and whisker plot of the differences of individual scans relative to the mean across the 9 sectors in the younger and older groups. In the younger group there was little variation (max difference: 6.8 µm) in repeat scans across all 9 EDTRS sectors; the standard deviation was only 1.81µm (approximate 95% prediction interval ± 3.62 µm). The older group showed greater variation, with a standard deviation of 3.73 µm (approximate 95% prediction interval ± 7.5 µm). However, the data for the older group must be viewed with some caution as the sample is not normally distributed and the histogram of differences (max difference: 36 µm) demonstrates a large kurtosis.
Phase 2 (Table 1).
Table 1 shows the results of the repeated measures regression model in which operator, visit and retinal area were random effects and pupil diameter was a fixed effect. Pupil size had a non-significant effect (p=0.545) upon macular thickness measurements.
As expected there is a significant variation in macular thickness with EDTRS region (Table 2) consistent with known anatomical features of the human retina [21, 22]. The mean thickness reflecting all measures found in this study for EDTRS sector 1 was 244.83 ±17.84 µm; this is comparable to previous studies [9, 23]. Table 2 shows mean thicknesses for all 9 sectors. For a given retinal location, and an operator examining a given patient on repeated occasions within a single visit, 95% of measurements would be expected to fall within 5.16 µm (i.e. 1.96 x 2.634) of one another (Equation 1). This value increases to 5.56 µm for a given operator testing the same retinal area of the same patient but on separate occasions (combining variances for within and between-visit) (Equation 1).
1
When different operators are considered over two separate visits, 95% of measures would be expected to fall within 6.18 µm (combining variances for within and between visits) within operator, and between-operator variance. This is determined from the following expression:
2
DISCUSSION
No significant variation between repeat scans (p = 0.75) was established, indicating no improvement in precision from multiple scans. In contrast, a study evaluating retinal nerve fibre layer (RNFL) measurements using the time-domain OCT 2000 (Humphrey Instruments) indicated that 5 scans may be needed to produce optimum repeatability [24]. Our study therefore confirms an improved precision for macular thickness measurements for Fourier-domain 3D OCT-1000 over time-domain OCT in support of recent findings [15]. This study also supports previous findings that pupil dilation does not affect scan repeatability [9, 10] since no significant difference in retinal thickness measurement was noted pre- and post-dilation (p = 0.50). In our study participants were free from pathology. In studies where participants have known lens opacities, dilation is indicated to ensure a reliable image [19, 25, 26].
In the younger group 95% of measurements were within 3.62 µm, and variation was similar across all 9 retinal sectors. The older group showed greater variation (95% limits ± 7.6µm) with an increased number of outliers mainly in peripheral sectors (areas 5 and 9). The error distribution was reasonably normal in the younger group. In the older age group the same did not apply. In this group we provide the caveat that distribution of the errors was wider, and non-normal - a finding that in itself is of interest because it suggests that the technique's reliability is age-dependent. Thus when imaging older individuals we suggest that a series of scans may be necessary. This will enable outliers to be more easily identified. Previous time domain studies encompassing older groups with pathology e.g. glaucoma and diabetes reported greater variability [6, 10, 27]. However, these studies could not distinguish between the effect of the pathology or age on variation. In this study all participants were free from pathology providing evidence that age or a combination of factors related to age, affects the variability of the OCT scan. Wu et al. [28] suggest that factors such as media opacity, pupil dilation and area measured have an effect on the overall scan quality, and Smith et al. [25] found that pupillary dilation was needed in 25% of their patients aged 39-88 years attending a glaucoma clinic in order to obtain an image with their time-domain OCT instrument. Fixational instability represents another possible reason why OCT results are more variable in older subjects [29].
The 95% confidence limits were larger for between-visit than within-visit reproducibility (5.56 µm v 5.16 µm). These results show better reproducibility for this Fourier-domain instrument compared to Stratus OCT for which values of inter-visit standard deviation of 12 microns and intra-visit standard deviation of 6 microns have been reported [9].
These results indicate repeatability using the 3D OCT-1000 for measuring macular thickness within 6 µm for a single scan. Measured differences in macular thickness exceeding 6 µm in younger volunteers are therefore likely to reflect actual structural change. In older individuals measurements from occasional single scans differed from the remaining series and therefore it is advisable to take a series of scans in older individuals to enable outliers to be identified.
ACKNOWLEDGEMENTS
A Bruce is supported by a Personal Award Scheme from the National Institute for Health Research, UK.

