All published articles of this journal are available on ScienceDirect.

The Impact of Excessive Use of Digital Devices During the Pandemic of Corona Virus Disease (COVID-19) Among Saudi Arabia Population
Authors Info & Affiliations
Abstract
Background:
A substantial increase in using digital devices was observed among the population due to staying at home as a result of the quarantine during the coronavirus pandemic. Consequently, ocular symptoms appeared due to spending several hours of screen time per day.
Objective:
The current study aimed to assess the impact of excessive use of digital devices during the pandemic of coronavirus among the Saudi population.
Methods:
A community-based cross-sectional study was carried out from November 2020 to January 2021 among the Saudi population. Data were collected by using Ocular Surface Disease Index (OSDI) questionnaires for the assessment of symptoms related to dry eye and their effect on vision. A logistic regression model was used to evaluate the association between the risk factors and the symptoms of dry eye. SPSS 22nd edition was used, any p-value <0.05 was considered significant.
Results:
Out of 1573 participants, 93.8% used mobile, 42.4% experienced uncomfortable sensitivity to the light. There were 49.15% of the participants who showed that none of the time they felt blurry vision, 54.8% did not report double vision, and 30.5% who felt a headache recently after quarantine. About 48% of the participants did not have any ocular symptoms, while 52% had dry eye symptoms (mild 22.3%, moderate 13.7%, and severe 15.9%). When the logistic regression model of risk factors associated with severe symptoms of dry eye was applied, wearing a contact lens was the most significant variable (p<0.0001).
Conclusion:
Dry eye symptoms increased during the quarantine, which indicated that the digital device users need to learn more about the preventive measures from practitioners in eye healthcare. More studies are warranted to assess the impact of digital device usage on all age groups starting from children up to the elderly population.
1. INTRODUCTION
The COVID-19 pandemic has had a tremendous impact on our everyday lives. Most people are quarantined at home, leading to an increase in near work and the use of smart devices, both of which create visual difficulties. Computer Vision Syndrome (CVS) has been identified in roughly 60 million people worldwide, according to a 2016 study [1]. CVS is a group of visual and extraocular symptoms linked to the continuous use of Visual Display Terminals (VDTs) [2]. Some of these common symptoms include visual and ocular symptoms, sensitivity to light, asthenopia, musculoskeletal symptoms, and other general symptoms [3]. Some of these visual symptoms are related to blurry vision, such as post-work distance blurred vision, constant and intermittent blurred vision, the most Ocular surface symptoms are itching, foreign body sensation, and burning sensation [2, 3].
People who spend more than 4 hours every day in front of a VDT are more likely to develop dry eye diseases [3]. This ocular symptom is often caused by dysfunctions of the meibomian gland [3]. Some of the patient's ocular complaints include excessive blinking and tearing [4]. According to a previous study, the prevalence of asthenopia is estimated to be approximately 55% and 81% among gadget users, the condition causes several binocular anomalies, including near point of convergence removal, phoria deviation in the near vision, and some accommodative responses can be inaccurate [2]. These responses are temporary and do not have any permanent effects on accommodation responses [5]. Musculoskeletal symptoms, such as neck, back, and shoulder pain, are associated with the prolonged use of computers [2]. VDT users in previous studies [6-8] showed that eye-related symptoms are the most common health problems [6-8]. All the previously described symptoms of CVS are included in the American Optometric Association clinical definition as “the combination of eye and vision problems associated with the use of computers”[9, 10]. Asthenopia is considered the most common complaint in patients with CVS. Asthenopia symptoms include strained and tired eyes, ocular surface-related symptoms include dry eyes, watery eyes, irritation, redness, and foreign body sensation, also visual-related symptoms include blurred and double vision [8-10].
In 2008, study results of over 400 computer operators in India reported asthenopic symptoms almost in 46.3% of participants [11]. A study of 35 Mexican computer terminal workers found an even higher prevalence of symptoms, with 68% of the subjects experiencing symptoms due to prolonged VDT [12]. In addition, a study in Australia of more than 1000 computer workers showed that 63% of the subject's reported symptoms of uncontrolled conditions; this number decreased to 25.2% after some adjustments that include the introduction of an optimized ergonomic desk and more frequent work breaks [13]. It is not clear yet if asthenopia symptoms caused by extended computer usage are related to age [11, 13, 14]. Females appear to have a higher prevalence as compared to males [15, 16].
While the electronic screen represents one visual target, a hard paper copy can also behave as a visual target. However, the evidence shows that the two forms of the target presented are not equivalent to each other. For instance, [17] the performance of subjects on an editing task with the material presented either as a VDT or in hard copy form. the evidence shows that with the hard copy presented, subjects make fewer errors and perform the task faster as compared with the VDT subjects. Other studies have reported matching results with fewer errors made by participants when viewing printed materials [18-20]. According to the Sixth European Working Conditions Survey, almost more than 50% of European workers use VDTs at work, with 37% using VDTs no less than three-quarters of the workday [8, 21, 22]. Therefore, the impact of VDTs on ocular health is a relevant area of study. However, the studies published so far have a huge limitation in evaluating CVS through invalidated or unstructured questionnaires, which include different symptoms according to the author and imprecise definitions of when the subjects should be characterized as symptomatic, tremendously compromising the findings of the studies [23-25]. Therefore, the current study aimed to assess the impact of excessive use of digital devices during the pandemic of coronavirus among the Saudi population.
2. MATERIALS AND METHODS
2.1. Design and Setting
A community-based cross-sectional study was administered between November 2020 and January 2021 to the Saudi Arabian population. Informed consent was obtained from each participant.
2.2. Participants
The study was conducted among the Saudi Arabian population both gender (males and females) was considered.
2.3. Inclusion Criteria
The inclusion criteria included subjects living in Saudi Arabia during the pandemic, aged between 10 to 70 years. Those who excessively use electronic digital devices for more than 4 hours per day. Both males and females were included. The exclusion criteria were any subjects suffering from the following:
- Rheumatology disease.
- Any ocular surgery.
- Age younger than 10 and above 70 years.
- Any refractive surgery.
2.4. Data Collection Procedures
Data were collected using a validated questionnaire in Arabic consisting of 35 questions administered. It included questions pertaining to the signs and symptoms related to eye dryness, digital eye strain, and some general symptoms related to musculoskeletal symptoms and the participant’s medical history [26-28]. The questionnaire was checked and evaluated by eye care professionals (optometrists and ophthalmologists) and tested with a pilot study of 50 subjects to reduce the bias during the process of data collection.
2.5. Ethical Clearance
Ethical clearance for the study was obtained from the Biomedical Ethics Committee at qassim health cluster ministry of health. The study was conducted according to the Declaration of Helsinki guidelines. Informed consent was taken from the participants before completing the questioners. All collected data were kept confidential and used only for research purposes. In addition, the questionnaires did not include participants’ names, file numbers, and mobile phone numbers. All participants had the right to stay or withdraw from the study.
2.6. Sampling
The study samples were calculated by the following formula:
2.7. Data Analysis
Statistical analyses were conducted using SPSS 22nd edition. Quantitative variables are presented as mean ± SD and compared using the Mann-Whitney U test and Kruskal-Wallis test. The chi-square test was used to compare qualitative variables expressed as frequency and percentage. A logistic regression model was used to assess risk factors for developing dry eye, while the Spearman correlation test was used to correlate age with the ocular surface disease index (OSDI) score. Statistical significance was set at p <0.05.
3. RESULTS
3.1. Demographic Characteristics of the Participants (N=1573)
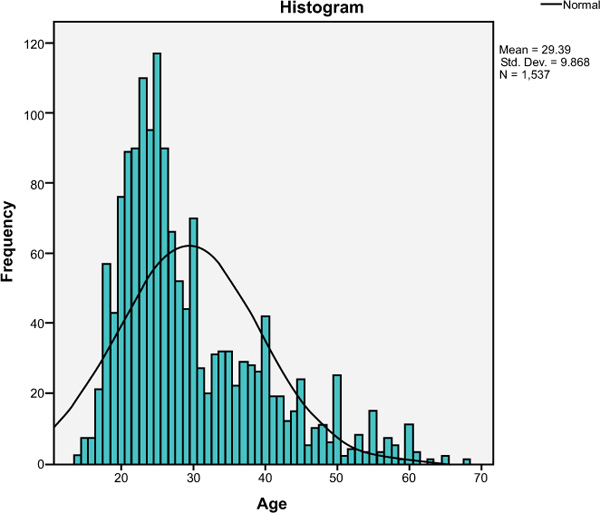
A total of 1573 participants were approved to fill out our online self-administered questionnaire that assesses the prevalence and risk factors for dry eye. The sample comprised 869(56%) females and 668(44%) males with a mean age of 29.39± 9.86 (range, 10 to 70 years as shown in Tables 1, 2 and Fig. (1). Most of the participants (93.8%) used mobile, while 79.4% did not use the computer. On the other hand, approximately 93.1% did not practice hand worker drawing, 87.5% did not utilize reading or writing, and most did not play electronic games (86.2%).
| Variable | N | Range | Minimum | Maximum | Sum | Mean | Std. Deviation |
|---|---|---|---|---|---|---|---|
| Age | 1537 | 54 | 10 | 70 | 45180 | 29.39 | 9.868 |
| SUM A | 1537 | 20 | 0 | 20 | 5585 | 3.63 | 3.920 |
| SUM B | 1537 | 16 | 0 | 16 | 3726 | 2.42 | 3.268 |
| SUM C | 1537 | 12 | 0 | 12 | 3514 | 2.29 | 2.796 |
| SUM D | 1537 | 28 | 0 | 28 | 16824 | 10.95 | 6.518 |
| OSDI | 1537 | 92 | 0 | 92 | 26718 | 17.3 | 17.278 |
| Mobile | 1537 | 1 | 0 | 1 | 1441 | .94 | .242 |
| Computer | 1537 | 1 | 0 | 1 | 316 | .21 | .404 |
| Hand work draw | 1537 | 1 | 0 | 1 | 106 | .07 | .253 |
| Reading or writing | 1537 | 1 | 0 | 1 | 192 | .12 | .331 |
| Electronic games | 1537 | 1 | 0 | 1 | 212 | .14 | .345 |
| Characteristics | N | % | |
|---|---|---|---|
| Age | 10-20 | 523 | 33.2 |
| 21-50 | 757 | 48.1 | |
| 51-70 | 293 | 18.7 | |
| Gender | Female | 869 | 56.5% |
| Male | 668 | 43.5% | |
| Mobile | No | 96 | 6.2% |
| Yes | 1441 | 93.8% | |
| Computer | No | 1221 | 79.4% |
| Yes | 316 | 20.6% | |
| Hand worker draw | No | 1431 | 93.1% |
| Yes | 106 | 6.9% | |
| Reading or writing | No | 1345 | 87.5% |
| Yes | 192 | 12.5% | |
| Electronic games | No | 1325 | 86.2% |
| Yes | 212 | 13.8% | |
Table 3 shows component A of the OSDI score, 42.4% some of the times have experienced about eyes are sensitive to light. Most of the participants during quarantine had no experience (none of the time) regarding eyes that feel gritty, painful, or sore eyes, blurred vision, or poor vision (65.8%, 69.2%, 52.1%, and 56.2%, respectively). Component A score at Mean ±SD (4±4).
Table 4 shows component B of the OSDI score, most of the participants showed that none of the time their eyes limited them in performing reading, driving a night, working on a computer or ATM, or watching TV during the quarantine (65.9%, 70.2%, 64.4%, or 58.4%, respectively). Component B score at Mean ±SD (2±3).
Table 3.
| Question | N | % | |
|---|---|---|---|
| Have you experienced any of the following during Quarantine (Eyes that are sensitive to light?) | All the time | 61 | 4.0% |
| Half of the time | 119 | 7.7% | |
| Most of the time | 138 | 9.0% | |
| None of the time | 568 | 37.0% | |
| Some of the time | 651 | 42.4% | |
| Have you experienced any of the following during Quarantine (Eyes that feel gritty?) | All the time | 26 | 1.7% |
| Half of the time | 67 | 4.4% | |
| Most of the time | 46 | 3.0% | |
| None of the time | 1011 | 65.8% | |
| Some of the time | 387 | 25.2% | |
| Have you experienced any of the following during Quarantine (Painful or sore eyes?) | All the time | 29 | 1.9% |
| Half of the time | 73 | 4.7% | |
| Most of the time | 59 | 3.8% | |
| None of the time | 1063 | 69.2% | |
| Some of the time | 313 | 20.4% | |
| Have you experienced any of the following during Quarantine (Blurred vision?) | All the time | 164 | 10.7% |
| Half of the time | 107 | 7.0% | |
| Most of the time | 0 | 0.0% | |
| None of the time | 801 | 52.1% | |
| Some of the time | 465 | 30.3% | |
| Have you experienced any of the following during Quarantine (Poor vision?) | All the time | 89 | 5.8% |
| Half of the time | 108 | 7.0% | |
| Most of the time | 70 | 4.6% | |
| None of the time | 864 | 56.2% | |
| Some of the time | 406 | 26.4% | |
| Component A score | 4 | 4 | |
| Question | N | % | |
|---|---|---|---|
| Have your eyes limited you in performing any of the following during the quarantine? (Reading) | All the time | 52 | 3.4% |
| Half of the time | 89 | 5.8% | |
| Most of the time | 50 | 3.3% | |
| None of the time | 1013 | 65.9% | |
| Some of the time | 333 | 21.7% | |
| Have your eyes limited you in performing any of the following during the quarantine? (Driving at night) | All the time | 53 | 3.4% |
| Half of the time | 64 | 4.2% | |
| Most of the time | 65 | 4.2% | |
| None of the time | 1079 | 70.2% | |
| Some of the time | 276 | 18.0% | |
| Have your eyes limited you in performing any of the following during the quarantine? (Working on a computer or ATM) | All the time | 40 | 2.6% |
| Half of the time | 86 | 5.6% | |
| Most of the time | 91 | 5.9% | |
| None of the time | 990 | 64.4% | |
| Some of the time | 330 | 21.5% | |
| Have your eyes limited you in performing any of the following during the quarantine? (Watching TV) | All the time | 63 | 4.1% |
| Half of the time | 110 | 7.2% | |
| Most of the time | 86 | 5.6% | |
| None of the time | 897 | 58.4% | |
| Some of the time | 381 | 24.8% | |
| Component B score | 2 | 3 | |
Table 5 represents component C of the OSDI score, most of the participants showed that none of the time their eyes felt uncomfortable during the quarantine in windy conditions, places with low humidity (very dry), or in areas that are air-conditioned (51.9%, 64.2%, or 59.5%, respectively). Component C score at Mean ±SD (2±3).
Table 6 represents component D of the OSDI score; most of the participants showed that none of the time they felt blurry vision recently (even with glasses if they have it), felt for a second’s double vision, felt increased in emotions and nervousness recently, or felt a headache recently after quarantine (49.1%, 54.8%, 25.6%, and 30.5%, respectively). Other participants showed that half of the time, they felt pain in the neck, shoulders, and back recently, felt tired and exhausted at the end of the day, or felt sleepy most of the day recently (30.1%, 26.9%, and 23%, respectively). Component D score at Mean ±SD (11±7).
| Question | N | % | |
|---|---|---|---|
| Have your eyes felt uncomfortable in any of the following situations during the quarantine? (Windy conditions) | All the time | 101 | 6.6% |
| Half of the time | 120 | 7.8% | |
| Most of the time | 107 | 7.0% | |
| None of the time | 797 | 51.9% | |
| Some of the time | 412 | 26.8% | |
| Have your eyes felt uncomfortable in any of the following situations during the quarantine? (Places with low humidity (very dry)) | All the time | 52 | 3.4% |
| Half of the time | 110 | 7.2% | |
| Most of the time | 82 | 5.3% | |
| None of the time | 987 | 64.2% | |
| Some of the time | 306 | 19.9% | |
| Have your eyes felt uncomfortable in any of the following situations during the quarantine? (Areas that are air-conditioned) | All the time | 83 | 5.4% |
| Half of the time | 110 | 7.2% | |
| Most of the time | 88 | 5.7% | |
| None of the time | 915 | 59.5% | |
| Some of the time | 341 | 22.2% | |
| Component C score | 2 | 3 | |
| Question (Choose the answers that best suit your situation from the beginning until the end of the home quarantine) | N | % | |
|---|---|---|---|
| Do you feel blurry vision recently? (even with glasses if you have it?) | All the time | 54 | 3.5% |
| Half of the time | 296 | 19.3% | |
| Most of the time | 80 | 5.2% | |
| None of the time | 754 | 49.1% | |
| Some of the time | 353 | 23.0% | |
| Do you feel for a second’s double vision? | All the time | 39 | 2.5% |
| Half of the time | 228 | 14.8% | |
| Most of the time | 78 | 5.1% | |
| None of the time | 843 | 54.8% | |
| Some of the time | 349 | 22.7% | |
| Do you feel pain in the neck, shoulders, and back recently? | All the time | 228 | 14.8% |
| Half of the time | 463 | 30.1% | |
| Most of the time | 307 | 20.0% | |
| None of the time | 272 | 17.7% | |
| Some of the time | 267 | 17.4% | |
| Do you feel tired and exhausted at the end of the day? | All the time | 270 | 17.6% |
| Half of the time | 414 | 26.9% | |
| Most of the time | 296 | 19.3% | |
| None of the time | 287 | 18.7% | |
| Some of the time | 270 | 17.6% | |
| Do you feel sleepy most of your day recently? | All the time | 261 | 17.0% |
| Half of the time | 354 | 23.0% | |
| Most of the time | 330 | 21.5% | |
| None of the time | 296 | 19.3% | |
| Some of the time | 296 | 19.3% | |
| Do you feel increased your emotions and nervousness recently? | All the time | 213 | 13.9% |
| Half of the time | 323 | 21.0% | |
| Most of the time | 276 | 18.0% | |
| None of the time | 394 | 25.6% | |
| Some of the time | 331 | 21.5% | |
| Do you feel a headache recently after quarantine? | All the time | 171 | 11.1% |
| Half of the time | 332 | 21.6% | |
| Most of the time | 264 | 17.2% | |
| None of the time | 469 | 30.5% | |
| Some of the time | 301 | 19.6% | |
| Component D score | 11 | 7 | |
Table 7 shows the risk factors for developing dry eye, 85.3% of the participants did not smoke, all the participants were not diagnosed with arthritis. Moreover, 96.2% were not diabetics and 91.3% did not have high cholesterol in the blood. Most of the participants (97.7%) did not take aspirin, 98.4% did not take antidepressant medications, 71.5% did not take multivitamins. Higher percentages of the participants (61.1%) drink caffeine (coffee, tea, power drinks, soft drinks), 84.9% did not use contact lenses, and all the participants did not undergo LASIK surgery before.
| Question | N | % | |
|---|---|---|---|
| Do you smoke? | No | 1311 | 85.3% |
| Yes | 226 | 14.7% | |
| Have you been diagnosed with arthritis? | No | 1537 | 100.0% |
| Yes | 0 | 0.0% | |
| Do you have diabetes mellitus? | No | 1479 | 96.2% |
| Yes | 58 | 3.8% | |
| Do you have any thyroid diseases? | No | 1462 | 95.1% |
| Yes | 75 | 4.9% | |
| Do have high cholesterol in the blood? | No | 1403 | 91.3% |
| Yes | 134 | 8.7% | |
| Do you take aspirin? | No | 1502 | 97.7% |
| Yes | 35 | 2.3% | |
| Do you take antidepressant medications? | No | 1512 | 98.4% |
| Yes | 25 | 1.6% | |
| Do you take multivitamins? | No | 1099 | 71.5% |
| Yes | 438 | 28.5% | |
| Do you drink caffeine (coffee, tea, power drinks, soft drinks)? | No | 598 | 38.9% |
| Yes | 939 | 61.1% | |
| Do you use contact lenses? | No | 1305 | 84.9% |
| Yes | 232 | 15.1% | |
| Did you have LASIK surgery before? | No | 1537 | 100.0% |
| Yes | 0 | 0.0% | |
Table 8 shows a summary of OSDI score among respondents, 48% did not have any ocular symptoms and about 22.3% has mild ocular symptoms (Fig. 2).
| Question | Mean | N | % | |
|---|---|---|---|---|
| OSDI score | No symptoms | 0 | 738 | 48.0% |
| Mild symptoms | 1 | 343 | 22.3% | |
| Moderate symptoms | 2 | 211 | 13.7% | |
| Severe symptoms | 3 | 245 | 15.9% | |

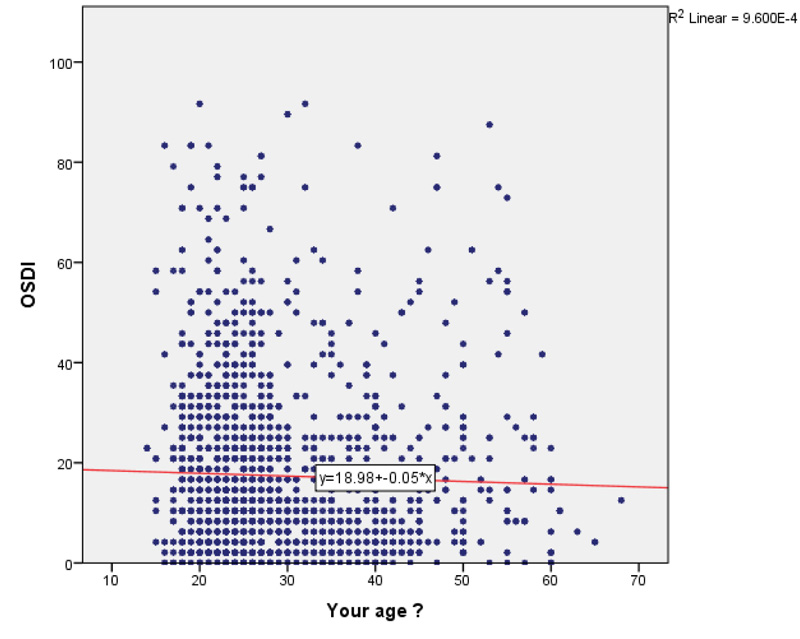
Table 9 represents the correlation between OSDI score and risk factors for developing dry eyes, a significant correlation was found between OSDI and age (Fig. 3), gender, having thyroid diseases, taking antidepressant medications, multivitamins, and use of contact lenses (p=0.02, p=0.003, p˂0.0001, p=0.01, p=0.02, and p˂0.0001, respectively) (Fig. 4).
| Variables | OSDI score | P value | ||||||||
|---|---|---|---|---|---|---|---|---|---|---|
| No symptoms | Mild symptoms | Moderate symptoms | Severe symptoms | |||||||
| N | % | N | % | N | % | N | % | |||
| Age (Mean ± SD) | 30 | 10 | 29 | 10 | 29 | 11 | 10 | 30 | 0.02 | |
| Gender | F | 393 | 53.3 | 186 | 54.2 | 139 | 65.9 | 151 | 61.6 | 0.003 |
| M | 345 | 46.7 | 157 | 45.8 | 72 | 34.1 | 94 | 38.4 | ||
| Do you smoke? | No | 628 | 85.1 | 295 | 86.0 | 182 | 86.3 | 206 | 84.1 | 0.89 |
| Yes | 110 | 14.9 | 48 | 14.0 | 29 | 13.7 | 39 | 15.9 | ||
| Have you been diagnosed with arthritis? | No | 738 | 100 | 343 | 100 | 211 | 100 | 245 | 100 | NA |
| Yes | 0 | 0.0 | 0 | 0.0 | 0 | 0.0 | 0 | 0.0 | ||
| Do you have diabetes mellitus? | No | 713 | 96.6 | 336 | 98.0 | 199 | 94.3 | 231 | 94.3 | 0.05 |
| Yes | 25 | 3.4 | 7 | 2.0 | 12 | 5.7 | 14 | 5.7 | ||
| Do you have any thyroid diseases? | No | 706 | 95.7 | 338 | 98.5 | 191 | 90.5 | 227 | 92.7 | <0.001 |
| Yes | 32 | 4.3 | 5 | 1.5 | 20 | 9.5 | 18 | 7.3 | ||
| Do have high cholesterol in the blood? | No | 673 | 91.2 | 316 | 92.1 | 186 | 88.2 | 228 | 93.1 | 0.27 |
| Yes | 65 | 8.8 | 27 | 7.9 | 25 | 11.8 | 17 | 6.9 | ||
| Do you take aspirin? | No | 718 | 97.3 | 341 | 99.4 | 203 | 96.2 | 240 | 98.0 | 0.06 |
| Yes | 20 | 2.7 | 2 | 0.6 | 8 | 3.8 | 5 | 2.0 | ||
| Do you take antidepressant medications? | No | 728 | 98.6 | 342 | 99.7 | 206 | 97.6 | 236 | 96.3 | 0.01 |
| Yes | 10 | 1.4 | 1 | 0.3 | 5 | 2.4 | 9 | 3.7 | ||
| Do you take multivitamins? | No | 529 | 71.7 | 260 | 75.8 | 153 | 72.5 | 157 | 64.1 | 0.02 |
| Yes | 209 | 28.3 | 83 | 24.2 | 58 | 27.5 | 88 | 35.9 | ||
| Do you drink the caffeine (coffee, tea, power drinks, soft drinks)? | No | 283 | 38.3 | 133 | 38.8 | 81 | 38.4 | 101 | 41.2 | 0.87 |
| Yes | 455 | 61.7 | 210 | 61.2 | 130 | 61.6 | 144 | 58.8 | ||
| Do you use contact lenses? | No | 655 | 88.8 | 296 | 86.3 | 165 | 78.2 | 189 | 77.1 | <0.001 |
| Yes | 83 | 11.2 | 47 | 13.7 | 46 | 21.8 | 56 | 22.9 | ||
| Did you have LASIK surgery before? | No | 738 | 100 | 343 | 100 | 211 | 100 | 245 | 100 | NA |
| Yes | 0 | 0.0 | 0 | 0.0 | 0 | 0.0 | 0 | 0.0 | ||
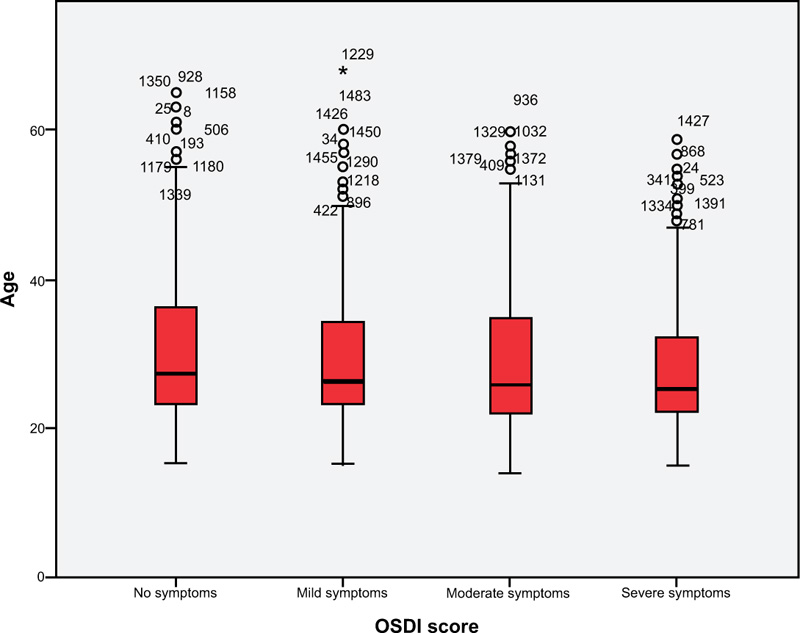

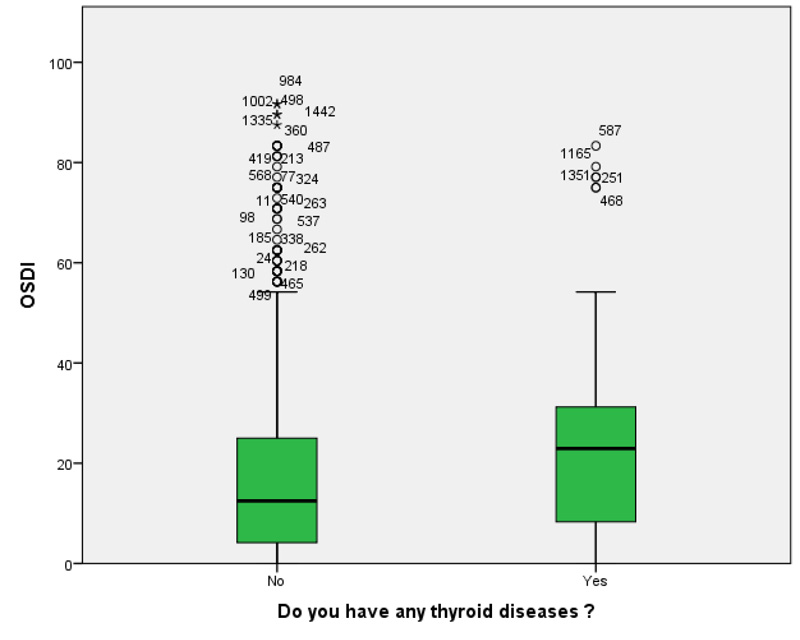
Table 10 shows a comparison of mean OSDI score based on risk factors, gender, having thyroid diseases, taking multivitamins, and use of contact lens showed a significant difference (p<0.0001, p=0.009, p=0.028, and p<0.0001, respectively) (Figs. 5, 7).
| - | OSDI | P-Value | ||
|---|---|---|---|---|
| Mean | Standard Deviation | |||
| Gender | Female | 18.6 | 17.4 | <0.0001 |
| Male | 15.8 | 17.0 | ||
| Do you smoke? | No | 17.4 | 17.2 | 0.58 |
| Yes | 17.2 | 17.7 | ||
| Have you been diagnosed with arthritis? | No | 17.4 | 17.3 | NA |
| Yes | . | . | ||
| Do you have diabetes mellitus? | No | 17.3 | 17.2 | 0.30 |
| Yes | 20.3 | 19.3 | ||
| Do you have any thyroid diseases? | No | 17.1 | 17.0 | 0.009 |
| Yes | 23.3 | 21.2 | ||
| Do have high cholesterol in the blood? | No | 17.4 | 17.4 | 0.35 |
| Yes | 17.4 | 15.6 | ||
| Do you take aspirin? | No | 17.4 | 17.3 | 0.96 |
| Yes | 17.8 | 18.2 | ||
| Do you take antidepressant medications? | No | 17.2 | 17.1 | 0.13 |
| Yes | 25.7 | 23.4 | ||
| Do you take multivitamins? | No | 16.9 | 17.1 | 0.028 |
| Yes | 18.7 | 17.6 | ||
| Do you drink caffeine (coffee, tea, power drinks, soft drinks)? | No | 18.2 | 19.0 | 0.94 |
| Yes | 16.9 | 16.1 | ||
| Do you use contact lenses? | No | 16.4 | 16.7 | <0.0001 |
| Yes | 23.0 | 19.3 | ||
| Did you have LASIK surgery before? | No | 17.4 | 17.3 | NA |
| Yes | . | . | ||
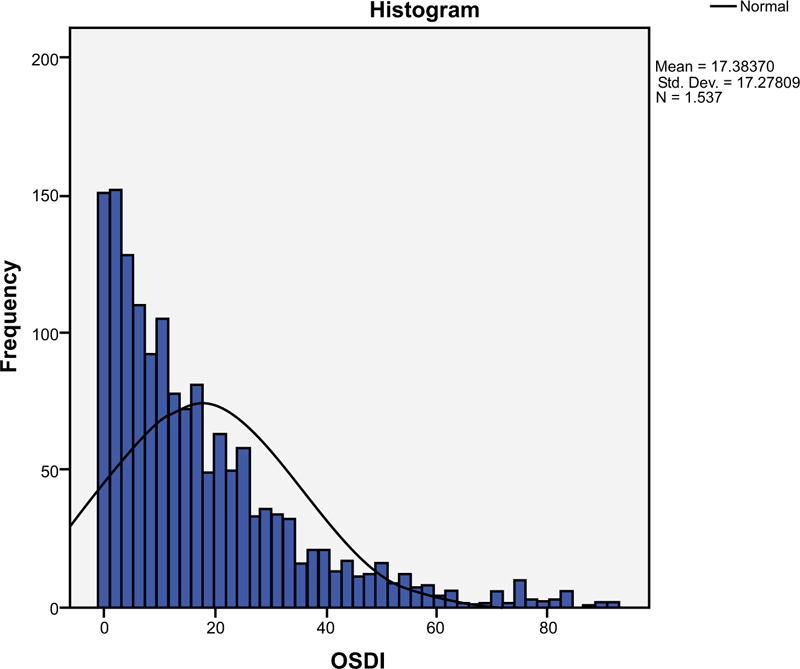
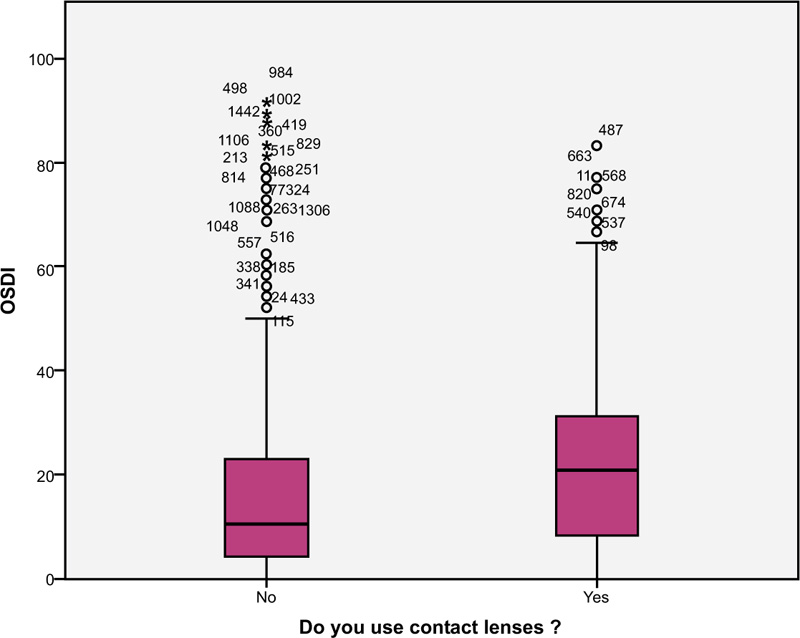
Table 11.
| Variables | Spearman correlation coefficient | P-value |
|---|---|---|
| Age and OSDI score | r= -0.059 | 0.02 |
A significant correlation was found between age and the OSDI score (p=0.02) (Fig. 8 and Table 11).
| - | Correlation Coefficient | Standard error | Wald | df | P value | OR | 95% CI |
|---|---|---|---|---|---|---|---|
| Male | 0.19 | 0.12 | 2.55 | 1 | 0.11 | 1.21 | 0.96 - 1.53 |
| Smoking | -0.09 | 0.16 | 0.35 | 1 | 0.56 | 0.91 | 0.67 - 1.24 |
| Diabetes mellitus | -0.40 | 0.29 | 1.94 | 1 | 0.16 | 0.67 | 0.38 - 1.18 |
| Thyroid disease | -0.24 | 0.25 | 0.92 | 1 | 0.34 | 0.79 | 0.49 - 1.28 |
| High Cholesterol level | -0.02 | 0.19 | 0.01 | 1 | 0.93 | 0.98 | 0.67 – 1.43 |
| Aspirin intake | 0.44 | 0.36 | 1.50 | 1 | 0.22 | 1.56 | 0.77 - 3.16 |
| Antidepressant intake | -0.39 | 0.42 | 0.86 | 1 | 0.35 | 0.68 | 0.30 – 1.54 |
| Multivitamin’s intake | 0.09 | 0.12 | 0.59 | 1 | 0.44 | 1.10 | 0.87 - 1.39 |
| High Caffeine consumption | 0.11 | 0.11 | 1.06 | 1 | 0.30 | 1.12 | 0.90 - 1.38 |
| Wearing contact lenses | -0.56 | 0.16 | 12.56 | 1 | <0.0001 | 0.57 | 0.42 – 0.78 |
| Constant | 0.99 | 0.64 | 2.39 | 1 | 0.12 | 2.70 |
| - | Correlation Coefficient | Standard Error | Wald | df | P value | OR | 95% CI |
|---|---|---|---|---|---|---|---|
| Mobile | 0.07 | 0.22 | 0.10 | 1 | 0.76 | 1.07 | 0.70 – 1.65 |
| Computer | 0.22 | 0.13 | 2.91 | 1 | 0.09 | 1.25 | 0.97 – 1.61 |
| Hand worker draw | -0.25 | 0.21 | 1.44 | 1 | 0.23 | 0.78 | 0.51 – 1.17 |
| Reading or writing | -.015 | 0.16 | 0.88 | 1 | 0.35 | 0.86 | 0.63 – 1.17 |
| Electronic games | 0.08 | 0.15 | 0.25 | 1 | 0.62 | 1.08 | 0.80 – 1.45 |
| Constant | 0.00 | 0.22 | 0.00 | 1 | 0.98 | 1.00 |
Table 12 shows the logistic regression model of risk factors associated with severe symptoms of dry eye, wearing contact lens was the most significant variables (p<0.0001), OR 0.57 (95% CI, 0.42 – 0.78).
Table 13 shows the ordinal logistic regression model of electronic devices associated with severe dry eye symptoms; there was no significant association (p˃0.05) between using electronic devices and severe symptoms of dry eye.
4. DISCUSSION
During the coronavirus pandemic, many people were quarantined at home to maintain social distance and avoid spreading the disease [7-10]. Accordingly, smart devices were used increasingly for prolonged periods, causing a potential upswing in CVS, an umbrella term for several visual disorders that affect 60 million people worldwide [12-17]. People are more likely to experience the risk of dry eye disease and the disruptive symptoms that go along with it if they work in front of a VDT for more than 4 hours per day [1, 2, 3]. Therefore, the current study aimed to assess the impact of excessive use of digital devices on the eyes during the coronavirus pandemic in the Saudi population.
The results of these studies showed that approximately 94% of the participants used a mobile phone. Nearly half of the participants (48%) did not have any symptoms of eye dryness while 52% experienced eye dryness symptoms (22.3% had mild, 13.7% had moderate, and 15.9% had severe symptoms), according to the OSDI score. It was reported that most of the participants did not feel foreign body sensations, pain, strained eyes, blurred vision, or poor vision during quarantine. Their eyes did not limit them from doing their daily activities of reading, driving at night, working on a computer, or even watching TV. The majority did not recently experience blurry vision or momentary double vision. These findings agree with previous studies that reported that mobile phones were the most used digital devices among all age groups during coronavirus lockdown [26, 27]. A previous study reported that the prevalence of asthenopia symptoms was higher among women than men, which is in line with our study results; among those who had mild symptoms, 54.2% were females, and 45.8% were males [15, 16].
Our results showed a significant association between age and the development of eye dryness symptoms (p=0.02), which disagreed with other studies in which there was no association between asthenopia symptoms and the age of the subjects [11, 13, 14]. Additionally, the current study showed a significant correlation between eye dryness and sex, having thyroid diseases, taking antidepressant medications, taking multivitamins, and using contact lenses. However, a logistic regression model of risk factors associated with severe dry eye symptoms revealed that wearing contact lenses was the most significant variable (p<0.0001) among the participants. A previous study reported several symptoms of eye dryness among mobile device users during the coronavirus lockdowns [11-20]. These symptoms, such as watering eyes, dry eyes, shoulder pain, headache, and back pain, were significantly associated with hours of using digital devices per day (p<0.05). Pain behind the eyes and itching eyes are the major symptoms among participants engaged in digital activities for prolonged periods. Additionally, some subjects complained of excessive tears and a high blinking rate due to the long-time use of digital devices [4]. Previous studies reported that the prevalence of asthenopia ranged from 55% to 81% among gadget users [5].
The prolonged use of gadgets may result in several binocular anomalies, such as the deficiency of near point of convergence, phoria deviation in near vision, and inaccurate accommodative responses [2-7]. All these modifications are temporary but do not have any permanent effect on accommodation. Prolonged use of digital devices has been reported to increase the prevalence of dry eye symptoms. A study reported that approximately 91% of the participants experienced dryness symptoms associated with excessive digital device usage, but this percentage was much higher than another study conducted in 2014 hence, the prevalence of symptoms was 81.9% and 78.6% for engineering students and medical college students, respectively [28]. This significant shift occurred due to the increase in the duration of digital device usage of the participants during coronavirus lockdown, estimated to be an average of 8.9 ± 3.63 hours of usage per day [28].
Facial masks are commonly used during the pandemic of coronavirus and this may be associated with increased dry eye and ocular symptoms [29]. However, in the current study, the facial mask was not considered a factor for assessing the dry eye symptom may have been considered as a limitation of this study. The current study has some limitations. First, it was a community-based cross-sectional study and was conducted online; consequently, the collected data was sometimes incomplete. To decrease the bias of the questionnaire, incomplete questionnaires were excluded from the final report. Furthermore, the participant response rate was slightly low, which reflects that not all the invited participants participated in the study. Second, the current study did not consider the facial mask as a factor for assessing the dry eye symptom may have been considered a limitation of this study All the above-mentioned limitations notwithstanding, the current study provides information about the impact of excessive use of digital devices during the pandemic of coronavirus among the Saudi population.
CONCLUSION
This study highlighted the potential increase in the use of different digital devices during the coronavirus pandemic lockdown and its adverse impact on ocular health among different age groups. There was a significant association found between age and development of eye dryness symptoms, with eye dryness symptoms increasing during quarantine. The previous findings suggest that it is important for digital device users to learn preventive measures from practitioners in eye healthcare, in order to reducd the effect of eye dryness. More studies should be conducted to assess the impact of digital device usage on all age groups, starting from children up to the elderly population.
LIST OF ABBREVIATIONS
| OSDI | = Ocular Surface Disease Index |
ETHICS APPROVAL AND CONSENT TO PARTICIPATE
Ethical clearance for the study was obtained from the Biomedical Ethics Committee of qassim health cluster ministry of health.
HUMAN AND ANIMAL RIGHTS
No Animals were used that are the basis of this study. all the human procedures were conducted according to the Declaration of Helsinki guidelines.
CONSENT FOR PUBLICATION
Informed consent has been taken from the participants before completing the questionnaires. All collected data were kept confidential and used only for research purposes. In addition, the questionnaires did not include participants’ names, file numbers, and mobile phone numbers. All participants had the right to stay or withdraw from the study.
STANDARDS OF REPORTING
STROBE guidelines were followed for this study.
AVAILABILITY OF DATA AND MATERIALS
Not applicable.
FUNDING
None.
CONFLICT OF INTEREST
The authors declare no conflict of interest, financial or otherwise.
ACKNOWLEDGEMENTS
Declared none.

