All published articles of this journal are available on ScienceDirect.
Volatile Organic Compounds in Patients’ Breath during Conversation
Abstract
Purpose:
The protracted coronavirus disease (COVID-19) pandemic has caused an unprecedented global health, social, economic, and psychological crisis. COVID-19 is transmitted via droplets, which include volatile organic compounds (VOCs) emitted by COVID-19 carriers. As a result, medical healthcare workers interacting with COVID-19 patients are at a high risk of infection. In this study, we measured the concentration of total VOCs (TVOCs) in the droplets of patients during conversations.
Methods:
Thirty patients aged 20–88 years were enrolled in this study. The amounts of VOCs, formaldehyde (HCHO), and carbon dioxide (CO2) as surrogate parameters for the patient’s droplets were measured at a distance of 1 m from the patients under the following conditions: 1) no conversation with a mask on, 2) conversation with a mask on, 3) conversation without a mask on, and 4) no conversation without a mask on.
Results:
The average concentrations of TVOCs (mg/m3), HCHO (mg/m3), and CO2 (ppm) were all the lowest before the masked conversation (1.79 ± 1.72, 0.25 ± 0.25, 1193 ± 516), increased during the masked conversation (1.99 ± 1.87, 0.29 ± 0.24, 1288 ± 555), were the highest during the unmasked conversation (3.10 ± 1.86, 0.45 ± 0.28, 1705 ± 729), and decreased to baseline after the unmasked conversation (1.89 ± 1.88, 0.26 ± 0.27, 1191 ± 518, respectively). Variations in TVOC and HCHO concentrations were positively correlated with patient age (TVOC: r = 0.42, p = 0.019 and HCHO: r = 0.47, p = 0.008).
Conclusion:
Wearing a mask reduced the VOC concentrations measured during conversations more than when a mask was not worn. Therefore, wearing a mask can reduce the emission of airborne droplet-derived VOCs and thereby reduce the risk of transmission of unknown patient-derived infections.
Clinical Trial Registration no:
The Clinical Trial Registration no: (UMIN000039595)
1. INTRODUCTION
The emergence of coronavirus disease (COVID-19) caused by severe acute respiratory syndrome coronavirus 2 (SARS-CoV-2) has led to a large global outbreak and major public health and governance concerns. According to the World Health Organization (WHO), the possible routes of transmission of SARS-CoV-2 include contact, droplet, airborne, fomite, fecal-oral, blood-borne, mother-to-child, and animal-to-human transmission [1, 2]. Previous studies on the transmission of SARS-CoV-2 showed that the virus spreads between people mainly via respiratory droplets via sneezing, coughing, and contact routes [3-10]. However, the possibility of airborne transmission of COVID-19 alone without a carrier is low, and no airborne transmission has been reported in 75,465 COVID-19-positive case reports in China [10]. In addition, the polymerase chain reaction (PCR) test did not detect COVID-19 DNA in the air samples surrounding COVID-19-positive patients in isolation rooms in a Singapore hospital [11]. These analyses indicate that COVID-19 is transmitted primarily by direct person-to-person contact through coughing, droplets, and conversations.
To date, studies have demonstrated that droplets from patients talking in the examination room can float up to 1 m away [12]. Another study proved that droplet particles could move up to 5 m in the direction of airflow [13]. Normal breathing produces not only tiny droplets of water and air or small particles but also gaseous particles [13]. These gaseous particles in exhaled air mainly contain a large amount of oxygen and carbon dioxide as well as volatile organic compounds (VOCs). The typical composition of exhaled breath is approximately 78% nitrogen, 13%-16% oxygen, 4%-5% carbon dioxide, 4% water vapor, and potentially thousands of VOCs with low molecular weights (less than 500 Da) [14, 15]. VOCs are organic chemicals that readily volatilize in the atmosphere at normal temperatures and pressures. Specific examples of VOCs include toluene, benzene, chlorofluorocarbons, and dichloromethane, which are widely used in daily life as important solvents and fuels [16]. Formaldehyde and acetaldehyde are extremely volatile VOCs and are classified as highly volatile organic compounds (VVOCs) [16]. VOCs and VVOCs are naturally present in the air exhaled from a person's mouth [17]. A study on VOCs in exhaled air detected 748 compounds in exhaled air samples obtained from 115 healthy individuals [18]. Furthermore, 266 of these 748 VOCs were detected in more than 10% of the individuals [18]. The VOCs in the exhaled breath from an infected person can be inhaled into the lower respiratory tract of nearby persons. However, the VOC concentrations emitted during conversation and breathing are not well understood. Determination of the VOC concentrations in exhaled air may be important because it can improve our understanding of the dynamics of SARS-CoV-2 transmission. Therefore, in this study, we investigated the concentrations of VOCs.
2. METHODS
2.1. Research Design and Participants
The current study was performed within the scope of a prospective and non-randomized design trial. This was approved by the Ethics Committee of Teikyo University (#Teirin 18-227) and performed in compliance with the Declaration of Helsinki. This study was registered in the University Hospital Medical Information Network (UMIN) Clinical Trials Registry (UMIN000039595). Thirty consecutive patients (13 women and 17 men; mean age, 58.3 ± 19.3 years; range, 20-88 years) were enrolled from an ophthalmology outpatient clinic of Teikyo University Hospital between February 2020 and June 2020. All the patients provided written informed consent before participating in the study.
2.2. The Concentration of VOCs
The measurements of the amount of VOCs were performed during face-to-face examinations in the following four states: (1) No conversation with a mask on, (2) conversation with a mask on, (3) conversation without a mask on, and (4) no conversation without a mask on. The concentrations of total volatile organic compounds (TVOCs), formaldehyde (chemical formula: HCHO), and carbon dioxide (chemical formula: CO2) in the droplets were measured as surrogate parameters. An interval of several minutes was allowed between each measurement. The TVOC, HCHO, and CO2 concentrations were measured using a portable detection instrument placed 1 meter away from the patient. A digital air quality detector (SMART SENSOR 5-in-1; KKmoon from Shenzhen Tomtop Technology Co., Ltd, Shenzhen, Guangdong, China) was used to measure VOCs concentration. The device was installed at a distance of 1 m from the patients. The room had dimensions of 4 m × 3 m, and the height of the room was approximately 3 m. Patients sat on chairs at least 1 m away from the wall. The room temperature was set between 20-22°C with no special humidity control. The measured values were recorded and saved in Microsoft Excel® (Microsoft Office 365; Microsoft Corporation, Redmond, WA).
2.3. Statistical Analysis
The mean values among the four groups were compared using the Tukey–Kramer multiple-comparison test and a one-way analysis of variance. Pearson correlation coefficients were calculated to determine the relationships among variables. A p-value less than 0.05 was considered statistically significant.
3. RESULTS
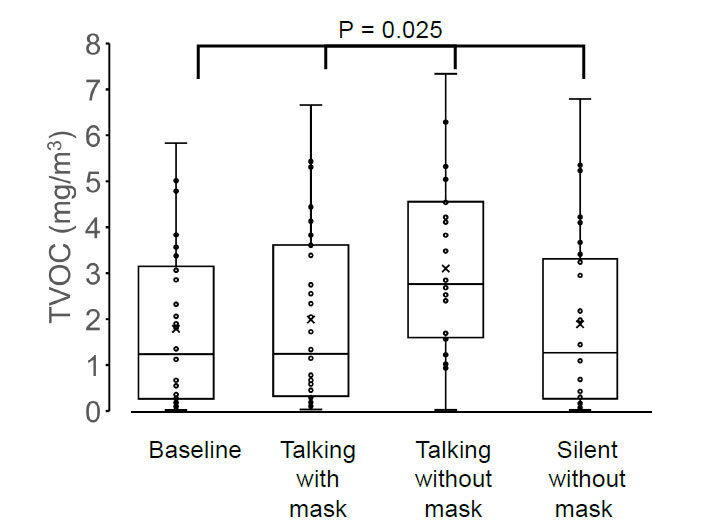
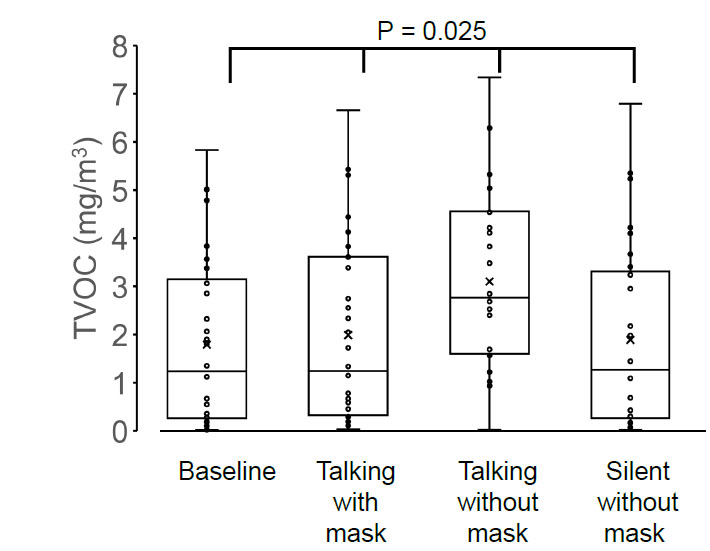
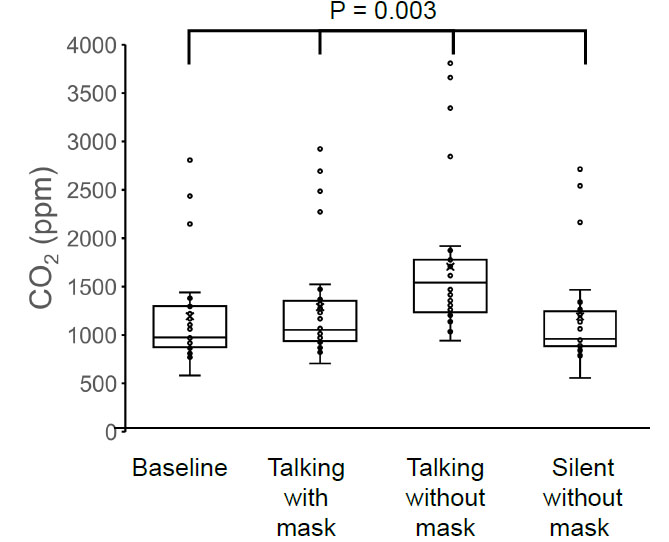
The TVOC concentration was 1.79 ± 1.72 mg/m3 before the conversation with the mask on, 1.99 ± 1.87 mg/m3 during the conversation with the mask on, 3.10 ± 1.86 mg/m3 during the conversation without the mask on, and 1.89 ± 1.88 mg/m3 after the conversation without the mask on (Fig. 1). The HCHO concentration was 0.253 ± 0.252 mg/m3 before the conversation with the mask on, 0.288 ± 0.243 mg/m3 during the conversation with the mask on, 0.453 ± 0.278 mg/m3 during the conversation without the mask on, and 0.263 ± 0.268 mg/m3 after the conversation without the mask on (Fig. 2). The concentration of CO2 was 1193 ± 516 ppm before the conversation with the mask on, 1288 ± 555 ppm during the conversation with the mask on, 1705 ± 729 ppm during the conversation without the mask on, and 1191 ± 518 ppm after the conversation without the mask on (Fig. 3).
The four groups showed significant differences in TVOC (p = 0.025), HCHO (p = 0.017), and CO2 (p = 0.003) concentrations, and the highest values of TVOC, HCHO, and CO2 concentrations were observed in the group without a mask on during conversation (one-way analysis of variance and the Tukey–Kramer multiple-comparison test).
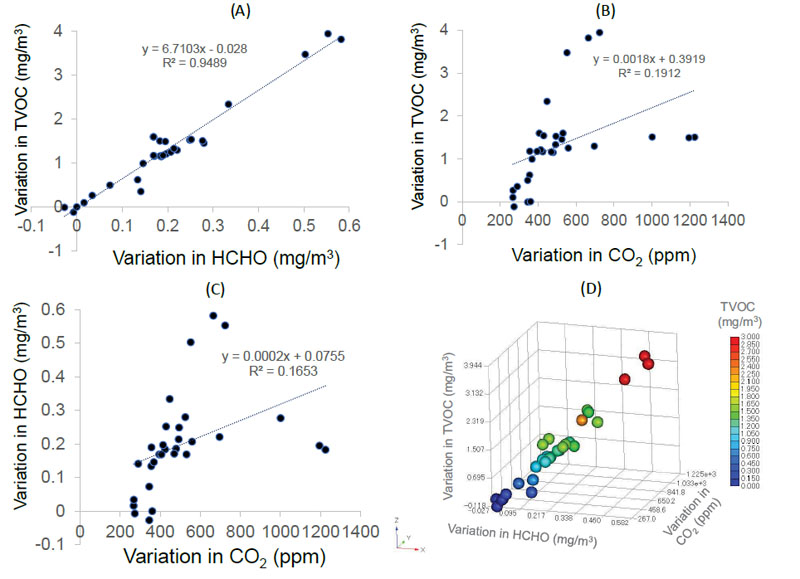
Next, we calculated the differences in the concentration of TVOC (variation in TVOC), HCHO (variation in HCHO), and CO2 (variation in CO2) before the conversation with the mask and during the conversation without a mask. A significant correlation was observed between the variation in TVOC and HCHO concentrations (r = 0.974, p < 0.01), TVOC and CO2 concentrations (r = 0.437, p = 0.016), and HCHO and CO2 concentrations (r = 0.407, p = 0.016; Pearson product-moment correlation coefficient) (Fig. 4A-D).
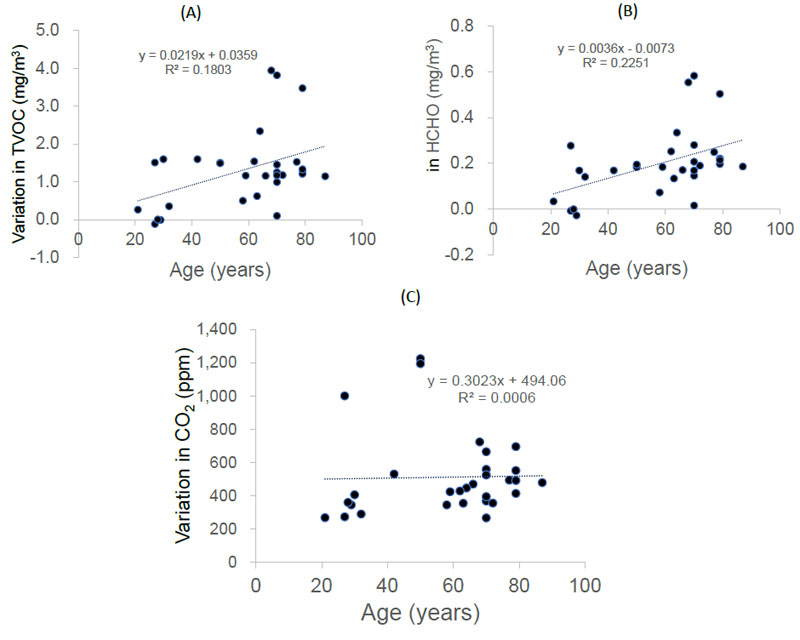
Variations in both TVOC and HCHO concentrations were positively correlated with patient age (r = 0.42, p = 0.019 and r = 0.47, p = 0.008, respectively; Pearson product-moment correlation coefficient) (Fig. 5A-B). However, CO2 levels did not correlate with patient age (r = 0.02, p = 0.899) (Figure 5C).
4. DISCUSSION
To our knowledge, this study is the first to report the concentration of gaseous particles, including VOCs, in the exhaled breath of patients in an ophthalmic outpatient clinic. The major findings of this study are that the amount of gaseous particles can be dramatically reduced by wearing a mask and that the amount of TVOCs and HCHO in exhaled breath increases with age. These results indicated that wearing a mask in the examination room may prevent VOC-derived droplet transmission between patients and doctors.
Our results showed that TVOC, HCHO, and CO2 were dispersed in significant amounts up to 1 m from the patient. In general, large droplets fall to the ground quickly, whereas smaller droplets travel farther. Moreover, gaseous particles remain in the air for a long time. Specifically, particle size and dispersal distance are inversely proportional. According to a study on the relationship between particle size and transport distance, droplet particles of 1000, 100, 10, and 1 µm fall 1 m away after 0.3, 3, 300, and 30,000 s, respectively [19, 20]. The droplet sizes vary from 0.1 to 1000 μm [13, 21-23], with larger droplets being large enough to carry bacteria and viruses [23]. The average initial velocity of coughing and breathing immediately after exiting the mouth is approximately 1-22 m/s [22, 24-26]. These exhaled droplets are transported by cough or exhalation jets in the first stage and dispersed by the airflow in the room in the second stage [13]. A computer simulation study investigating the effect of ventilation rate on droplets and social distance showed that sneezing or coughing at an initial velocity of 20 m/s can cause particles or droplets to travel more than 3 m in 40 s [13]. Furthermore, sneeze propagation analysis showed that the maximum dispersal area was 4.84 m downstream, 1.13 meters wide, and 1.82 meters horizontally [13]. These results suggested that a social distance of at least 5 m instead of the generally recommended 2 m is more appropriate as a practical condition under environmental ventilation [19, 20, 27].
Human exhaled breath contains thousands of metabolites and VOCs derived from microorganisms present in the human respiratory tract and internal organs [28]. Pathogenic and symbiotic bacteria with humans and viruses of the microbiota can produce VOCs of complex chemical origin. Microbial-derived VOCs have also been implicated in the transmission of pathogens and the initiation of diseases [28]. Our results showed that patient-derived TVOCs could be dispersed at least 1 m away. These facts indicate that viruses attached to gaseous particles have sufficient potential to be transferred from person to person.
Virus transmission via VOCs can be better understood in reference to the airborne dynamics of the influenza virus and severe acute respiratory syndrome (SARS) coronavirus, which are representative infectious viruses. Many studies have demonstrated that infectious particles with attached viable influenza can be detected in air samples collected from hospitals and medical health centers [29, 30]. SARS coronavirus has also been detected in air samples obtained from rooms in which SARS patients were hospitalized [31]. In general, infectious influenza virus and SARS coronavirus can survive in the air for several hours to days [32, 33]. According to a study by the National Institute of Allergy and Infectious Diseases, the COVID-19 virus has been experimentally proven to remain infectious for three hours in airborne aerosols in enclosed spaces [34]. Additionally, coronaviruses remain infectious in the environment for up to nine days, according to a review of 22 studies on SARS and Middle East respiratory syndrome (MERS) [32]. In contrast, several studies have reported that COVID-19 DNA was not detected in air samples near COVID-19-positive patients [10, 11]. The results of these studies do not prove that the COVID-19 virus exists in the air without carriers, but it is quite possible that the infectious COVID-19 virus is still alive and floating in the air using VOC-dominated gaseous particles as carriers.
The differences in TVOC, HCHO, or CO2 concentrations before and during the conversation may reflect the amount of droplets released from the patient's mouth. Interestingly, the concentrations of TVOCs and HCHO increased with age. On the other hand, the CO2 concentration did not correlate with age. Correlation analysis of gas particles showed a strong correlation between TVOC and HCHO concentrations, while CO2 concentrations did not correlate with TVOC or HCHO concentrations. HCHO is a metabolic intermediate essential for cellular metabolism and is produced in the human body. HCHO is produced in the body during the metabolism of serine, glycine, methionine, and choline [35]. Factors that can alter the concentration of HCHO and VOCs in exhaled breath include aging, diet, disease, smoking, and alcohol consumption [18, 36-40]. As HCHO is classified as a VOC with fairly high volatility, the concentration of HCHO probably occurs in the exhaled air and is linked to the TVOC concentration [41]. However, the generation and internal metabolism of CO2 are fundamentally different from those of HCHO and TVOCs [42]. In our previous study, oral droplets in patients decreased with age [12]. The concentration of CO2 in the exhaled breath is probably strongly influenced by the lung capacity of the patient. Respiratory function gradually decreases with age in adults [43]. Furthermore, CO2 is abundant in the atmosphere; therefore, fluctuations in exhaled CO2 concentration can be ignored. Therefore, in the present study, the effect of aging on the changes in CO2 emissions may have been minimal.
This study had several limitations. First, in this study, the gaseous particles were measured only at a site 1 m away from the patient where the readings were stable. Second, in this study, all patients wore their own disposable masks and, therefore, did not use uniform masks. Third, there are many types of VOCs; however, we only measured TVOC, HCHO, and CO2 levels. Fourth, this portable measuring device can only measure the total concentration of all types of VOCs.
CONCLUSION
We found that TVOCs, HCHO, and CO2 were generated from the patients’ mouths during conversation and could be prevented by wearing a mask. Wearing a mask is the simplest and most powerful tool for protecting patients and healthcare workers from unknown viruses and pathogens in the air.
LIST OF ABBREVIATIONS
| VOCs | = Volatile Organic Compounds |
| TVOCs | = Total VOCs |
ETHICS APPROVAL AND CONSENT TO PARTICIPATE
This study was approved by the Ethics Committee of Teikyo University (#Teirin 18-227).
HUMAN AND ANIMAL RIGHTS
No animals were used in the studies that are the basis of this research. All the humans were used in accordance with the ethical standards of the committee responsible for human experimentation (institutional and national) and with the Helsinki Declaration of 1975, as revised in 2013 (http://ethics.iit.edu/ecodes/node/3931).
CONSENT FOR PUBLICATION
All the patients provided written informed consent before participating in the study.
STANDARDS OF REPORTING
CONSORT guidelines were followed.
AVAILABILITY OF DATA AND MATERIALS
The data that support the findings of this study are available within the article.
FUNDING
This work was supported in part by a Grant-in-Aid for Scientific Research from the Ministry of Education, Culture, Sports, Science, and Technology of Japan (16K11332).
CONFLICT OF INTEREST
Dr. Tatsuya Mimura is the EIC of the journal The Open Ophthalmology Journal.
ACKNOWLEDGEMENTS
Declared none.

