All published articles of this journal are available on ScienceDirect.

A Survey of Ophthalmologists in 52 Cities in the Southern United States
Authors Info & Affiliations
Abstract
Background:
The United States (US) supply of surgical specialty practitioners in 2025 is projected to fall short by 24,340 physician full-time equivalents. The greatest deficit is projected for ophthalmology with the most affected region noted to be the southern US.
Aims:
To better understand the distribution of our ophthalmology workforce in the southern US and to identify cities with less access to subspecialty-specific vision care.
Objective:
To determine the prevalence of ophthalmologists as well as rates of ophthalmology subspecialists and practice types in the three largest cities of each state within the southern US.
Methods:
The American Academy of Ophthalmology’s “Find an Ophthalmologist” online listing was queried on a city-by-city basis from December 2020 to April 2021. The number and location of ophthalmologists were determined in the three largest cities, according to population, in the southern US. Data collected on each ophthalmologist included sex, primary subspecialty, practice type, year of first board certification, and academic affiliation.
Results:
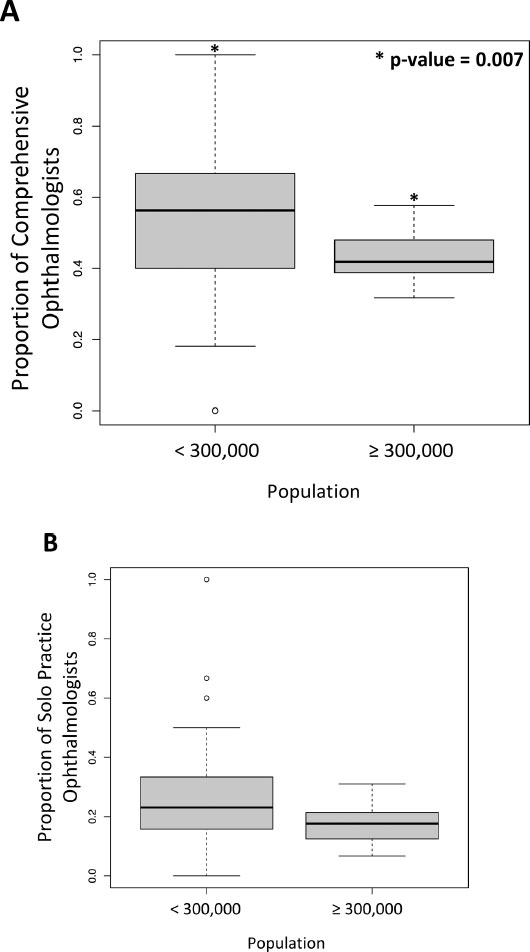
There were 1,735 total ophthalmologists identified in the three largest cities of each state, 52 cities in total, within the southern US. The majority were male (n= 1,369, 78.90%) and board-certified prior to or during 1997 (n= 913, 52.62%). There were 12,308 persons per ophthalmologist (P/O) in the southern US. Cities with the highest P/O ratio were Rio Rancho, NM (101,475 P/O), Southaven, MS (28,691 P/O), and Houston, TX (27,868 P/O). The lowest P/O ratios included Morgantown, WV (1,587 P/O), Charleston, WV (2,263 P/O), and Wilmington, DE (3,025 P/O). Less populated cities (<300,000 persons) had a significantly higher proportion of comprehensive ophthalmologists in the southern US (p-value=0.007).
Conclusion:
A total of 550 ophthalmologists were evaluated in southwestern cities and 1,185 were evaluated in southeastern cities. Our results suggest that less populated cities are driven by comprehensive ophthalmology practices. This data suggests greater vulnerability in certain cities with less access to subspecialty-specific vision care.
1. INTRODUCTION
With a rapidly expanding and aging population, demand for physician healthcare services is projected to outgrow the current supply in the United States (US) [1, 2]. The southern US has been projected, from 2017 to 2032, to have the highest growth in demand for physicians [2]. Specifically, the US supply of surgical specialty practitioners in 2025 is projected to fall short by 24,340 physician full-time equivalents (FTEs). The greatest deficit is projected for ophthalmology with the most affected region noted to be the southern US [3]. Alongside this estimated shortage, there has been a decline over the last two decades in the national density of ophthalmologists and an increase in the age of active providers [4, 5]. Ophthalmology additionally experienced one of the largest decreases in the number of first-year ACGME residents and fellows between 2014 and 2019 [5]. Given the projected shortage of ophthalmologists in the Southern United States, it becomes imperative to gain insights into the current distribution and demographics of ophthalmologists in this region to identify potential gaps in ophthalmic care delivery and to inform targeted workforce planning strategies.
The predicted ophthalmologist shortage is further challenged by an expanding elderly population. Over 20% of the entire US population is projected to be over age 65 by 2029. The 65-and-older age group is expected to outgrow the under-18-year-old population by 2056 [6]. An aging US population is also faced with an aging ophthalmology workforce. In 2019, 51.1% of active ophthalmologists were 55 or older, compared to 44.9% in all US specialties combined. The prevalence of age-related eye diseases has expanded over time and is expected to continue increasing [7]. In regard to specific conditions, since the early 2000s, the number of persons with cataracts in the US increased by 46.8% [8]. From 2011 to 2020, there was an almost 50% increase in the prevalence of age-related macular degeneration (AMD) [9]. In 2050, the prevalence of diabetic retinopathy is expected to triple from its prevalence in 2005 [10]. Lastly, the prevalence of primary open-angle glaucoma in 2050 is expected to increase by 170% from its prevalence in 2011 [10, 11].
With the increasing prevalence of age-related eye diseases and the anticipated surge in the elderly population, there is an urgent need to assess the geographic distribution and subspecialty distribution of ophthalmologists to ensure adequate access to specialized eye care services, especially for vulnerable populations. Moreover, as the aging ophthalmology workforce approaches retirement, our study aims to shed light on the potential challenges in meeting the growing demand for ophthalmic services in the coming years. Understanding the practice patterns of ophthalmologists is also beneficial in identifying areas of potential workforce shortages, optimizing healthcare resource allocation, and ensuring comprehensive and timely eye care services for diverse patient populations. Therefore, we sought to evaluate the prevalence and types of ophthalmologists in the southern US, with a focus on the three largest cities of each state based on population. We hypothesized that there would be a greater proportion of older ophthalmologists, based on board certification year, as well as a predominance of non-comprehensive ophthalmologists.
2. MATERIALS AND METHODS
2.1. Data Collection
This is a cross-sectional study based on data gathered from the American Academy of Ophthalmology’s “Find an Ophthalmologist” online listing, from December 2020 to April 2021. Country, state, and city were selected as part of each query. Data were obtained on the number and location of ophthalmologists in the three most populated cities in each southern state. 52 cities were identified. States were grouped into the Southwest (SW) or Southeast (SE) as defined by the National Geographic Society’s United States Regions map; this included 17 states and the District of Columbia. Data collected on each ophthalmologist included sex, primary subspecialty, practice type, year of first board certification, and academic affiliation. In order to best resemble age 55 years, two age groups were assigned based on board certification year: prior to or during 1997 vs. during or after 1998. Primary practice types with less than five total ophthalmologists (i.e. administration, professional association, and missionary/humanitarian) were excluded from our analysis of practice types. The data collection was conducted by systematically gathering information from the American Academy of Ophthalmology's “Find an Ophthalmologist” online listing. To ensure the accuracy of the data, the authors cross-checked the collected information and resolved any discrepancies through mutual agreement with a final verification of the data to further enhance its accuracy and reliability.
2.2. Statistical Analysis
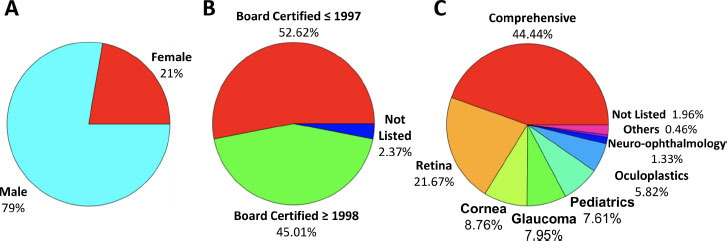
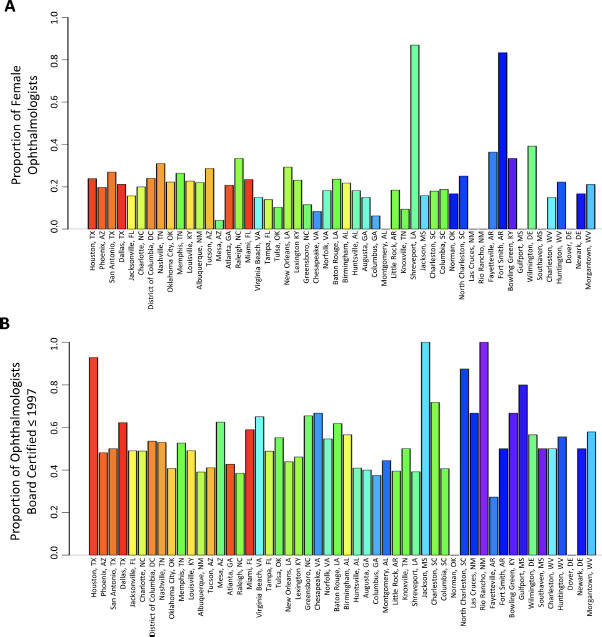
A summary of ophthalmologist demographics, including their sex, year of board certification, and primary specialty, was obtained and visualized using pie charts. For the year of board certification, the population was separated into two groups: board certified prior to or during 1997 or during or after 1998. City-wise demographic analyses were also performed. The city population, number of ophthalmologists, and availability of ophthalmologists (ophthalmologists per 100,000 population) were plotted. Cities were ordered by their population size, and a rainbow color scheme was assigned for the number of ophthalmologists (red for larger ophthalmologist population and purple for smaller ophthalmologist population).
Further, proportions of ophthalmologists based on their sex, board certification year, primary specialties, and practice types were calculated for each city and plotted. Again, the population was distributed into two groups for the year of board certification: the board certified prior to or during 1997 or during or after 1998. Next, the proportion of comprehensive and solo practice ophthalmologists was tested against population size using a t-test (tested between cities with larger populations and smaller populations). All analyses were performed using R version 4.0.3 [12].
3. RESULTS
3.1. Demographics and Distribution of Ophthalmologists in the Southern US
There were 52 total cities identified among the 17 states and the District of Columbia within the southern US, as shown in Table 1 and Table S1. The four southwestern states included Arizona (AZ), New Mexico (NM), Oklahoma (OK), and Texas (TX). The 13 southeastern states and/or territories included Alabama (AL), Arkansas (AR), Delaware (DE), District of Columbia (DC), Florida (FL), Georgia (GA), Kentucky (KY), Louisiana (LA), Mississippi (MS), North Carolina (NC), South Carolina (SC), Tennessee (TN), Virginia (VA), and West Virginia (WV). The total population of the three largest cities per state in the southern US was 21,354,525 persons. There were 1,735 total ophthalmologists in this region, including 550 in southwestern cities and 1,185 in southeastern cities. The majority were male (n= 1,369, 78.90%) and board-certified prior to or during 1997 (n= 913, 52.62%) (Fig. 1A and B). The following cities had zero female ophthalmologists: Las Cruces, Rio Rancho, Montgomery, Dover, Gulfport, and Southaven (Fig. 2A). In contrast, all 52 cities listed more than one male ophthalmologist, except for Rio Rancho (n=1). Shreveport was the only city in our study with a female predominant ophthalmology workforce (20/23 ophthalmologists). Rio Rancho, NM had zero recently board-certified ophthalmologists (Fig. 2B). Another four cities only had one: Bowling Green, KY, Gulfport, MS, Southaven, MS, and North Charleston, SC (Fig. 2B).
| State | City | Population | No. of Ophthalmologists | No. of Ophthalmologists Per 100,000 Persons |
|---|---|---|---|---|
| Arizona | Phoenix | 1,703,080 | 81 | 4.76 |
| Tucson | 553,871 | 56 | 10.11 | |
| Mesa | 527,666 | 24 | 4.55 | |
| New Mexico | Albuquerque | 561,188 | 41 | 7.31 |
| Las Cruces | 104,148 | 6 | 5.76 | |
| Rio Rancho | 101,475 | 1 | 0.99 | |
| Oklahoma | Oklahoma City | 655,407 | 54 | 8.24 |
| Tulsa | 396,543 | 29 | 7.31 | |
| Norman | 126,377 | 6 | 4.75 | |
| Texas | Houston | 2,340,890 | 84 | 3.59 |
| San Antonio | 1,578,030 | 78 | 4.94 | |
| Dallas | 1,382,270 | 90 | 6.51 | |
| Alabama | Birmingham | 207,235 | 46 | 22.20 |
| Huntsville | 205,472 | 22 | 10.71 | |
| Montgomery | 197,777 | 9 | 4.55 | |
| Arkansas | Little Rock | 196,968 | 38 | 19.29 |
| Fayetteville | 89,540 | 11 | 12.29 | |
| Fort Smith | 88,233 | 6 | 6.80 | |
| Delaware | Wilmington | 69,584 | 23 | 33.05 |
| Dover | 38,482 | 4 | 10.39 | |
| Newark | 33,419 | 6 | 17.95 | |
| DOC | District of Columbia | 711,571 | 71 | 9.98 |
| Florida | Jacksonville | 929,647 | 51 | 5.49 |
| Miami | 478,251 | 90 | 18.82 | |
| Tampa | 404,636 | 43 | 10.63 | |
| Georgia | Atlanta | 524,067 | 82 | 15.65 |
| Augusta | 199,614 | 20 | 10.02 | |
| Columbus | 198,969 | 16 | 8.04 | |
| Kentucky | Louisville | 615,924 | 53 | 8.60 |
| Lexington | 324,604 | 39 | 12.01 | |
| Bowling Green | 74,363 | 3 | 4.03 | |
| Louisiana | New Orleans | 388,424 | 41 | 10.56 |
| Baton Rouge | 216,328 | 34 | 15.72 | |
| Shreveport | 182,616 | 23 | 12.59 | |
| Mississippi | Jackson | 154,340 | 19 | 12.31 |
| Gulfport | 71,573 | 5 | 6.99 | |
| Southaven | 57,382 | 2 | 3.49 | |
| North Carolina | Charlotte | 912,096 | 45 | 4.93 |
| Raleigh | 483,579 | 39 | 8.06 | |
| Greensboro | 301,094 | 26 | 8.64 | |
| South Carolina | Charleston | 140,476 | 39 | 27.76 |
| Columbia | 129,482 | 32 | 24.71 | |
| North Charleston | 119,992 | 8 | 6.67 | |
| Tennessee | Nashville | 678,448 | 68 | 10.02 |
| Memphis | 651,011 | 38 | 5.84 | |
| Knoxville | 188,085 | 31 | 16.48 | |
| Virginia | Virginia Beach | 450,224 | 20 | 4.44 |
| Chesapeake | 249,787 | 12 | 4.80 | |
| Norfolk | 241,056 | 22 | 9.13 | |
| West Virginia | Charleston | 45,264 | 20 | 44.19 |
| Huntington | 43,814 | 9 | 20.54 | |
| Morgantown | 30,153 | 19 | 63.01 |
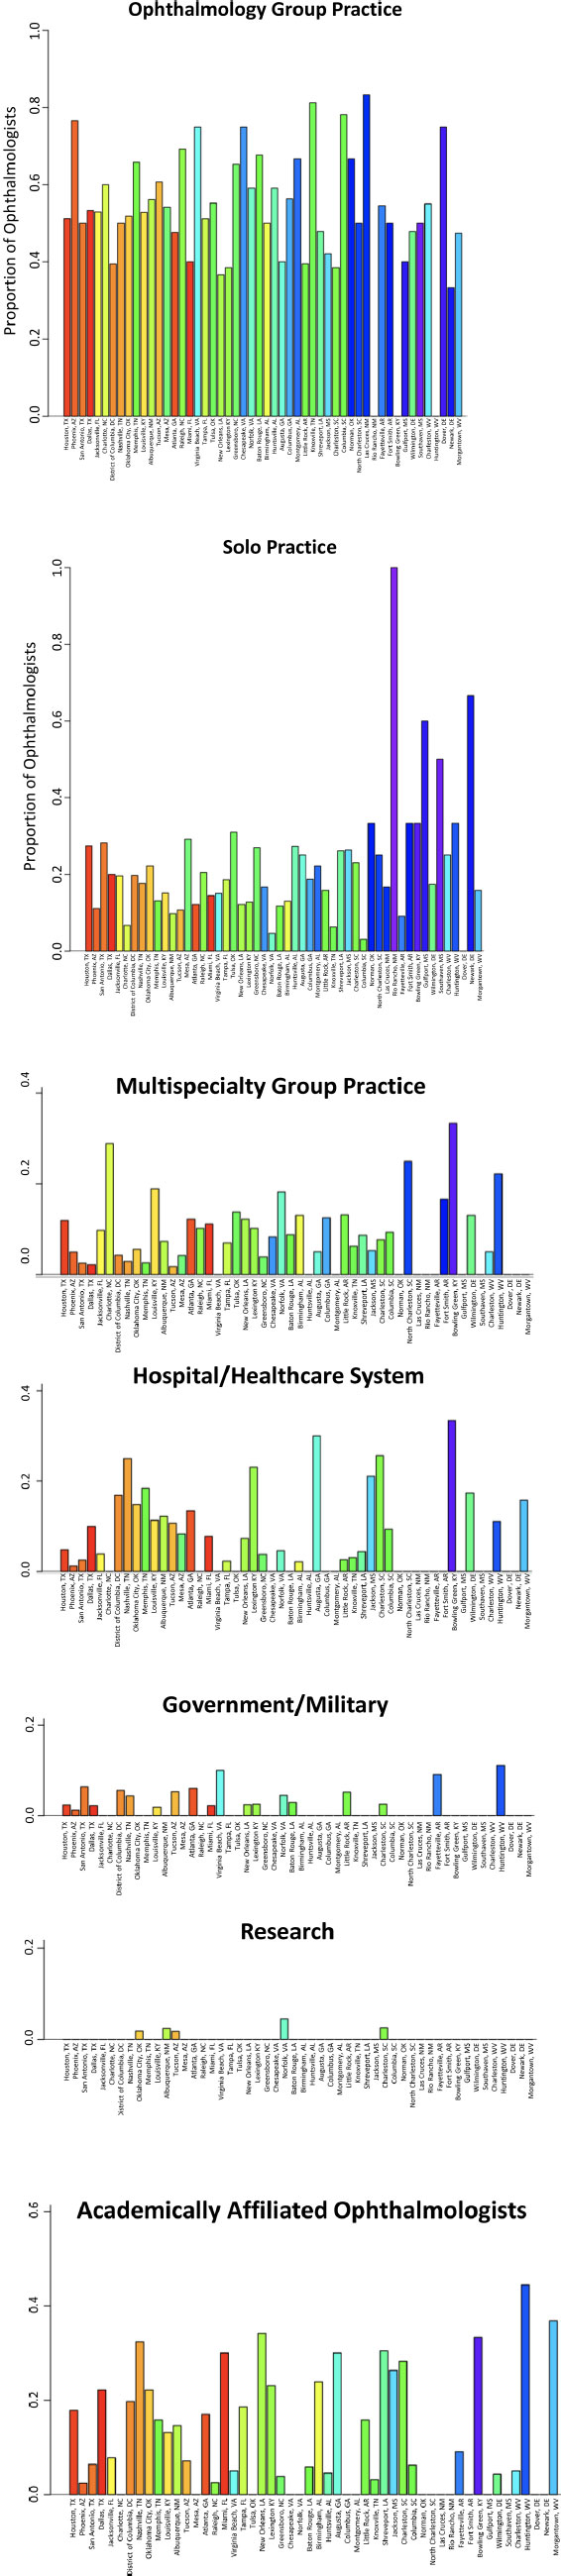
As far as the distribution of ophthalmologists in these 52 cities is concerned, there were 8.12 ophthalmologists per 100,000 persons (O/P), i.e., 12,308 persons per one ophthal- mologist (P/O). However, the density of ophthalmologists per 100,000 persons widely ranged from 0.99 to 63.01 in Rio Rancho, NM, and Morgantown, WV, respectively (Fig. 3C). The cities with the highest person to ophthalmologist ratios were Rio Rancho, NM (101,475 P/O), Southaven, MS (28,691 P/O), and Houston, TX (27,868 P/O). The cities with the lowest person to ophthalmologist ratios were Morgantown, WV (1,587 P/O), Charleston, WV (2,263 P/O), and Wilmington, DE (3,025 P/O) (Fig. 3). Overall, less populated cities (<300,000 persons) were noted to have a significantly higher proportion of comprehensive ophthalmologists in the southern US (p-value=0.007) (Figs. 4 and 6A). Less populated cities also had a higher proportion of solo practices, although this trend did not reach significance (p-value=0.057) (Figs. 5 and 6B).
3.2. Primary Subspecialty and Practice Types of Ophthalmologists in the Southern US
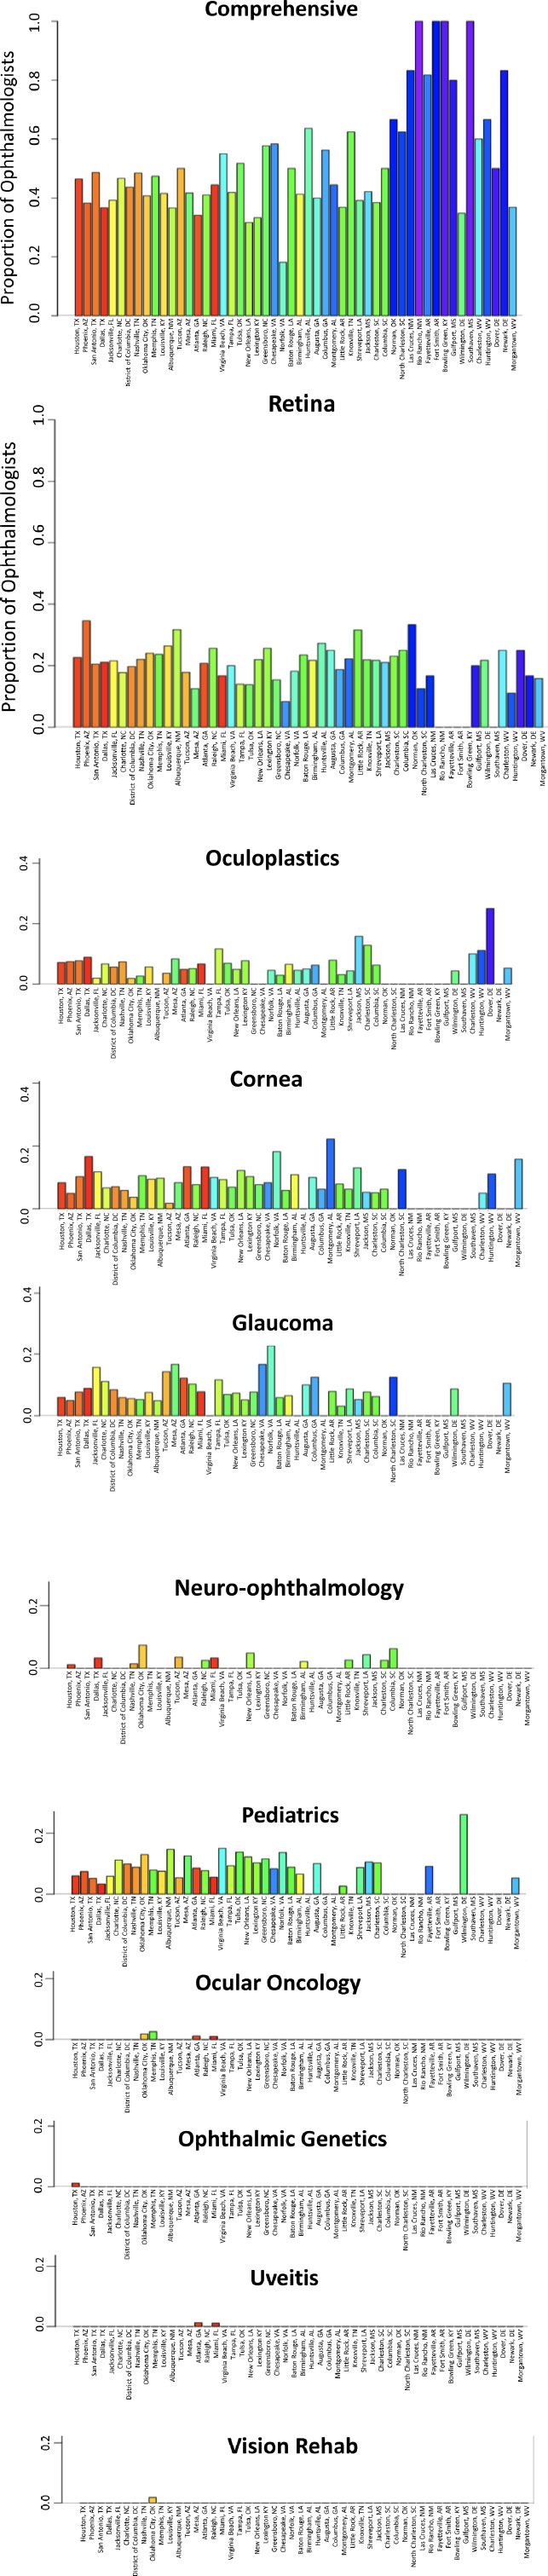
Comprehensive (n= 771, 44.44%) and retina (n= 376, 21.67%) were the most reported primary subspecialties; collectively, ocular oncology (n=3), ophthalmic genetics (n=2), uveitis (n=2), and vision rehab (n=1) were the least reported primary subspecialties (Fig. 1C). Of the remaining subspecialties, oculoplastics (n= 101, 5.82%) and neuro-ophthalmology (n= 23, 1.33%) were the least reported (Fig. 1).
However, there were a few outlying cities when compared to the average specialty breakdown among all 52 cities. For instance, there was a greater concentration (n= 8) of oculoplastics specialists in Chesapeake, VA, and a greater concentration of pediatric specialists (n= 7) in Atlanta, GA, District of Columbia, and Oklahoma City, OK (Fig. 4).

The two most common practice types were ophthalmology group practice (n= 926, 53.37%) and solo practice (n= 312, 17.98%). Interestingly, the largest numbers of solo practices were found in the Texas cities (Houston: n= 23, San Antonio: n= 22, Dallas, n= 18).
Lastly, there was a lower prevalence of hospital/healthcare systems (n= 149, 8.59%) and academically affiliated ophthalmologists (n= 259, 14.93%) in this region (Fig. 5). Although academic affiliation was low in certain cities, many of those states have some of their larger academic institutions geographically located outside of their three most populated cities.
4. DISCUSSION
The southern US is faced with not only the challenge of a shrinking ophthalmology workforce but also with a greater presence of eye conditions associated with chronic disease including diabetes, hypertension, and coronary artery disease [13-15]. Recently, there has been an increasing awareness of the prevalence of ocular manifestations associated with age and such systemic diseases [7-11]. The southern US is projected to have the worst deficit of ophthalmologists in 2025 as compared to all other surgical specialties [3]. Our study found a male-predominant and older ophthalmologist workforce primarily driven by comprehensive eye care and ophthalmology group practices. Prior studies have determined that the mean national density of ophthalmologists in the US in 2017 was 5.68 ophthalmologists per 100,000 persons [4]. In contrast, the ratio among 52 of the most populated southern cities in our study was 8.12.
In 2019, ophthalmology had less female representation (26.7%) when compared to the entire active physician workforce (36.3%) in the US [16]. Our study found an even smaller percentage of females in the southern US ophthalmologist workforce (n=366, 21.10%). In addition to a predominantly male specialty, ophthalmology is facing an aging population. Our study further highlights this aging workforce with 52.62% of our study’s ophthalmologists with board certification prior to or during 1997 (n=913). We selected this board certification year to best resemble the age of 55 years. In consideration of this aging workforce and the reduced number of ophthalmologists entering training programs, ophthalmologists may struggle to keep up with the demands of our aging US population [1, 2].
Previous studies have shown that populations tend to have a decline in eye exam screening, disease awareness, and ophthalmic outcomes when faced with fewer ophthalmologists in their region [17-23]. According to the Association of American Medical Colleges (AAMC) 2020 Physician Specialty Data Report, there were 19,312 total active ophthalmologists in the US with 17,162 people per active ophthalmologist (P/O).16 Our study found a lower ratio of persons per ophthalmologist in these 52 cities (12,172 P/O). This ratio is subdivided into 18,238 P/O within the 12 southwestern cities and 9,556 P/O within the 40 southeastern cities. With this being said, further population-based studies are needed to determine the optimal P/O ratio for any given region and to evaluate for any ophthalmologist shortages in the United States. Ultimately, an awareness of the distribution and demographics of practicing ophthalmologists is crucial to expand and improve ophthalmic care for our communities.
According to the 2020 AAMC Physician Specialty Data Report, ophthalmology experienced one of the largest decreases (-10.9%) in the number of first-year ACGME residents and fellows between 2014 and 2019 [16]. Among the 47 largest specialties in the US in 2019, ophthalmology ranked third to last based on the ratio of active physicians to the number of first-year ACGME residents and fellows. Compared to the average ratio, of 19.05, Ophthalmology’s ratio was 45.3. Other specialties including internal medicine (11.58), otolaryngology (30.27), urology (16.64) general surgery (10,60), and plastic surgery (30.62) are listed for comparison [16]. This data additionally supports the idea that ophthalmology residency programs are not growing at a rate to best provide care for our aging US population. Therefore, a potential avenue for increasing the density of ophthalmologists in the southern US, and within the entire country at large, could be in the form of expanding the total number of training positions.
One study evaluating academic ophthalmology group practices in the US showed the greatest allocation of full-time employee equivalents among comprehensive care and then retina [24]. The authors combined complete eye exams, anterior segment/cataract surgery, and various laser procedures into one overarching comprehensive category. Similarly, in our study, comprehensive and retina were the first and second most reported primary subspecialties. Our study similarly combined the comprehensive, cataract/anterior segment and refractive subspecialties, found in the American Academy of Ophthalmology’s Find an Ophthalmologist online directory, into one comprehensive primary subspecialty. Our study found that 44.44% of ophthalmologists provide comprehensive ophthalmic care instead of subspecialty ophthalmic care. Furthermore, with fewer ophthalmologists pursuing niche specialties, there is concern as to whether there will be enough graduates to train and treat future generations within these subspecialties. Neuro-ophthalmology and uveitis have been identified as the lowest tier of allocation in academic ophthalmology group practices [24].
Another study projects that most of the per capita burden of primary open-angle glaucoma (POAG) in the US in 2050 will be in the southern states [10]. Our study similarly found a lower density of glaucoma specialists in NM. NM is one of the three states that Vajaranant et al. projected will double in POAG rates. As stated above, pediatric ophthalmology consists of a very small percentage of ophthalmologists. Specifically, certain regions of the United States are facing limited pediatric glaucoma care [25].
The strengths of this study include its identification of specialty choice popularity, demographic breakdown, and population density of persons per ophthalmologist in select cities. This study also has several limitations. We acknowledge the limitation of our study's focus on big city centers, which may restrict the generalizability of our findings to the entire southern US region. By examining only the three largest cities of each state, our results may not fully represent the workforce distribution and access to eye care services in smaller cities and rural areas. Consequently, the ophthalmologist density and prevalence of practice types and subspecialties in these regions may differ significantly from what was observed in our study. Second, only one subspecialty was listed as the primary subspecialty per ophthalmologist on the main “Find an Ophthalmologist” search results, but additional subspecialties appear as secondary subspecialties when viewing the details of a particular ophthalmologist. This was not recorded in our study. As a result, it is possible that a less commonly reported subspecialty does indeed have representation in a given city by an ophthalmologist who listed something else as their primary subspecialty. Despite efforts to ensure data validity, it is important to acknowledge that the data obtained from the online database may be subject to change and could potentially contain inaccuracies or omissions due to possible real-time updates or variations in reporting practices. Lastly, the database evaluated in our study primarily comprises ophthalmologists who are members of the American Academy of Ophthalmology. Consequently, it is possible that an ophthalmologist who is not a member of the Academy would not be listed in the database.
CONCLUSION
Ultimately, a total of 550 ophthalmologists were identified in southwestern cities and 1,185 were identified in southeastern cities. Our study found a male-predominant and older ophthalmologist workforce primarily driven by comprehensive eye care and ophthalmology group practices. Our results suggest that less populated cities are driven by comprehensive ophthalmology practices. This data suggests greater vulnerability in certain cities with less access to subspecialty-specific vision care. Future studies are warranted to further evaluate the ophthalmologist workforce distribution throughout a broader range of cities, including smaller and rural areas. While the study provides valuable insights into the prevalence and types of ophthalmologists in the three largest cities of each state, further research including data from smaller cities and rural areas is warranted to provide a more comprehensive understanding of the workforce challenges and access to subspecialty-specific vision care across the entire southern United States.
AUTHORS' CONTRIBUTIONS
C.A., G.S., B.S., L.W., R.N.M., and R.F.M. collected the study data. C.A., G.S., B.S., L.W., R.N.M., T.J.L., A.S., and R.F.M. analyzed and interpreted the study data and contributed to writing the manuscript. All authors read and approved the final manuscript.
LIST OF ABBREVIATIONS
| US | = United States |
| P/O | = Persons per one ophthalmologist |
| FTEs | = Full time equivalents |
| AMD | = Age-related macular degeneration |
| SW | = Southwest |
| SE | = Southeast |
| O/P | = Ophthalmologists per 100,000 persons |
| AAMC | = Association of American Medical Colleges |
| POAG | = Primary open-angle glaucoma |
ETHICS APPROVAL AND CONSENT TO PARTICIPATE
Not applicable.
HUMAN AND ANIMAL RIGHTS
No human or animal experiments were performed for this study.
CONSENT FOR PUBLICATION
Not applicable.
AVAILABILITY OF DATA AND MATERIALS
The American Academy of Ophthalmology’s “Find an Ophthalmologist” online listing is publicly available (https://secure.aao.org/aao/find-ophthalmologist). The dataset supporting the conclusions of this article is included as an additional file.
STANDARDS OF REPORTING
STROBE guidelines were followed.
FUNDING
None.
CONFLICT OF INTEREST
The authors declare that they have no competing interests.
ACKNOWLEDGEMENTS
Not applicable.
SUPPLEMENTARY MATERIAL
Supplementary Table 1. Breakdown of 1,735 ophthalmologists identified in 52 cities among the 17 states and the District of Columbia within the southern United States.

