All published articles of this journal are available on ScienceDirect.

Contribution of Posterior Corneal Astigmatism to Total Corneal Astigmatism among Saudi Population
Abstract
Background:
Astigmatism is an error of refraction in which incident parallel rays cannot be focused on a single point. It could be corneal astigmatism (CA), lenticular astigmatism (LA), or both. Regarding CA, it is due to the difference in the corneal curvature in the different meridians of both the anterior and posterior surfaces. The anterior and posterior corneal surfaces contribute to total corneal astigmatism (TCA). Newer technologies, such as slit-scanning technology, Scheimpflug devices, and optical coherence tomography, are now used in the clinical setting for measuring the posterior corneal surface. However, it has been shown that relying only on the anterior corneal surface measurement and neglecting the relationship between the anterior and posterior corneal surfaces can lead to unacceptable intraocular lens (IOL), power calculation results after corneal refractive surgery, and errors during the calculation of toric IOLs.
Objectives:
This study aimed to determine the percentage of contribution of the magnitude of posterior corneal astigmatism (PCA) to total corneal astigmatism (TCA) and to investigate the correlation between anterior corneal astigmatism (ACA), PCA, and TCA.
Methods:
A prospective cross-sectional study including 55 subjects aged 18 – 31 years old and divided into 3 groups based on spherical equivalent (SE), Emmetropia, Hyperopia, and Myopia were included. All subjects underwent full ophthalmological examinations and corneal topography. ACA and PCA were evaluated. TCA was computed by the addition of the ACA and PCA using vector analysis. The percentage of contribution of the PCA to the magnitude of the TCA and the correlation between ACA, PCA, and TCA were calculated.
Results:
All subjects had anterior corneal with the rule (WTR) astigmatism. The contribution of PCA to TCA for all subjects in 3 groups (Emmetropia, Hyperopia, and Myopia) was 35%, 37%, and 37%, respectively, with P > 0.05, which was not statistically significant. There was a correlation between ACA, PCA, and TCA in all study groups.
Conclusion:
TCA is composed of both corneal surfaces, and PCA impacts the outcomes of refractive surgeries for correcting astigmatism and in toric intraocular lens (IOL) calculation when just based on the data of the anterior corneal surface.
1. INTRODUCTION
Astigmatism is a widespread optical disorder that happens when the visual system does not have a good perception of a point-from-a-point source because of the different powers in the different meridians of the cornea [1-3]. It could be corneal astigmatism (CA), lenticular astigmatism (LA), or total astigmatism (TA), representing the sum of CA and LA [4]. It is classified into two primary groups: regular astigmatism, where the variation between the steepest and flattest meridian is 90 degrees, and irregular astigmatism, where the variation between the steepest and flattest meridian is lower than 90 degrees [4-6]. Idiopathic astigmatism happens due to abnormalities involving the optical system of the eye, commonly the anterior and posterior corneal surfaces [7]. There are variable causes for astigmatism, such as corneal scars, keratoconus (KC), different operations, corneal transplants, crystalline lens dislocation, and large incisions in cataract surgery [8, 9]. It impacts different visual functions, for example, VA, contrast sensitivity (CS), also it induces some problems and symptoms like epiphora, unilateral diplopia, asthenopia, and distortion [1]. Some studies have exhibited that age, sex, environment, and genetic factors are valuable factors that influence the type and amount of astigmatism and found that the prevalence of astigmatism was between 10–13% of the refractive errors [10-12].
Corneal topography is a non-contact imaging procedure that maps the shape and aspects of the cornea [13]. Conventionally, corneal power and astigmatism have been computed based on anterior corneal measurements only, presuming a fixed posterior–anterior curvature ratio to determine the contribution of posterior corneal power, but currently, machines can illustrate both the anterior and posterior corneal surfaces, building a three-dimensional map [4, 14]. The four standards of corneal topography are Placido disk-based keratoscopy, Slit-scanning elevation topography, Scheimpflug imaging, and Anterior segment optical coherence tomography (AS-OCT) [13, 15-19]. The exact power of astigmatism that is evaluated with various instruments is not definitely the same, so it is still a challenge [20]. There are many clinical applications of corneal topography, such as checking and monitoring KC and refractive surgeries like photorefractive keratectomy (PRK), selection of IOL prior to cataract surgery, moreover, assessment and handling of post-keratoplasty astigmatism and ocular surface disorders that can cause irregular CA, like pterygia, corneal scars, and Salzmann nodules [21].
CA is due to the difference in the corneal curvature in the different meridians of both the anterior and posterior surfaces [22]. The anterior and posterior corneal surfaces contribute to TCA [4]. Understanding the changes in corneal shape with increasing age is essential as it impacts the stability of the corneal shape after refractive surgery [23-25]. The prevalence of WTR astigmatism is greater in juvenile people, and by increasing age, it will alter to against the rule (ATR) astigmatism [23, 26-29]. Utilizing spectacles in high astigmatism has some restrictions as it causes meridional magnification [30]. An additional valuable point that should be taken into concern is that the primary meridians of the two corneal surfaces are not constantly parallel, and this counteraction of the ACA is not associated with the refractive index of the rigid gas permeable (RGP) lens, and any quantity of astigmatism that is associated to the crystalline lens stays uncorrected so every degree of CA could be counteracted by suiting a spherical GP [28, 31]. Implanting toric IOL is used for the treatment of astigmatism, and it has been shown that relying only on the anterior corneal surface measurements and neglecting the relationship between the anterior and posterior corneal surfaces can lead to unacceptable IOL power calculation results after corneal refractive surgery and in errors during toric IOL calculation [32-36].
The aim of this study was to specify the percentage of contribution of PCA to TCA and to evaluate the correlation between ACA, PCA, and TCA in a sample of the Saudi population.
2. METHODS
2.1. Subjects
An observational prospective cross-sectional study was conducted on a total of 55 subjects recruited from King Saud University, Riyadh, Kingdom of Saudi Arabia, in the period from January to April 2021, and divided into 3 groups based on SE: Emmetropia, Hyperopia, and Myopia. Inclusion criteria were CA 0.5 – 4 D, Myopia up to −8 D, and Hyperopia up to +4 D, while exclusion criteria were coexisting corneal or any ocular pathology, previous corneal surgeries, contact lens wearers, and pregnant females.
This study adhered to the Declaration of Helsinki and was approved by the Ethics Committee of the Deanship of Scientific Research at King Saud University. A signed informed consent was obtained from each subject before participating in the study.
2.2. Study Examination
All subjects underwent full ophthalmological examinations, including VA measurement using logarithmic minimum angle of resolution (LogMAR) chart, refractive errors and IOP measurements using TOPCON Auto Kerato-refracto-tonometer TRK-1P, anterior segment examination using Slit-lamp, and corneal topography by Scheimpflug imaging using Oculus Pentacam® AXL (Oculus, Wetzlar, Germany).
From the corneal parameters displayed on the Oculus Pentacam® AXL map, ACA was calculated by subtracting ksteep – kflat on the front surface and PCA by subtracting ksteep – kflat on the back surface.
TCA was calculated by the sum of the ACA and PCA by vector analysis using the “ASSORT vector calculator,” which is the total planning and outcomes analysis software for astigmatism using the Alpins method, cheltman, Victoria, Australia [37].
The percentage of contribution of the PCA to the magnitude of the TCA and the correlation between ACA, PCA, and TCA were calculated.
2.3. Statistical Analysis
Data were analyzed using Statistical Package for Social Sciences (SPSS) software (version 17.0; SPSS Inc., Chicago, IL, USA). Normality was checked using the Kolmogorov-Smirnov normality test. The Kruskal-Wallis test was used to compare the means of the percentage of contribution of the magnitude of PCA to TCA between 3 groups. A Pearson correlation test was employed to examine possible relationships between ACA, PCA, and TCA in each group. A P-value < 0.05 was considered statistically significant.
3. RESULTS
A total of 110 eyes of 55 females were enrolled in this study. The participants' ages ranged between 18 – 31 years old, with an average 20.7±2.3 years. The number of eyes in the 3 groups (Emmetropia, Hyperopia, and Myopia) were 4, 21, and 85 eyes, respectively. All participants had anterior corneal WTR astigmatism. Table 1 shows the demographic data of the study participants.
The distribution of participants by age where the highest percentage of participants aged 21 years with 23.6% of all participants. Moreover, 45.5% of all participants were aged 18 years or more, while 30.9% of all participants were aged 22 years or more.
Descriptive statistics of the measured ocular parameters were performed in study groups summarized in Tables 2-4.
| Total Participants | 55 |
|---|---|
| Total eyes (N) | 110 |
| Gender (%) | - |
| Female | 55 (100%) |
| Age (years) | 20.7±2.3 |
| Groups (N) | - |
| Emmetropia | 4 |
| Hyperopia | 21 |
| Myopia | 85 |
| Types of astigmatism (N) | - |
| WTR | 110 |
| Parameter | Minimum | Maximum | Mean | Std. Deviation | Median |
|---|---|---|---|---|---|
| VA | 0.0 | 0.0 | 0.0 | 0.0 | 0.0 |
| SE | 0.0 | 0.0 | 0.0 | 0.0 | 0.0 |
| IOP | 15.7 | 20.0 | 17.43 | 2.0 | 17.00 |
| Ksteep front | 43.2 | 45.3 | 44.03 | 1.0 | 43.80 |
| Kflat front | 41.1 | 44.2 | 42.48 | 1.3 | 42.30 |
| Axis | 92.3 | 110.3 | 100.18 | 7.6 | 99.05 |
| Ksteep back | -6.6 | -6.2 | -6.35 | 0.2 | -6.30 |
| Kflat Back | -6.3 | -5.8 | -6.00 | 0.2 | -5.95 |
| Axis | 95.6 | 100.9 | 98.48 | 2.3 | 98.70 |
| ACA | 0.9 | 3.1 | 1.55 | 1.0 | 1.10 |
| PCA | -0.5 | -0.3 | -0.35 | 0.1 | -0.30 |
| TCA | 0.6 | 2.6 | 1.22 | 0.9 | 0.81 |
| Axis | 89.0 | 116.0 | 100.75 | 11.5 | 99.00 |
| Percentage (PCA/TCA) | 0.19 | 0.47 | 0.35 | 0.12 | 0.37 |
| Parameter | Minimum | Maximum | Mean | Std. Deviation | Median |
|---|---|---|---|---|---|
| VA | 0.0 | 0.0 | 0.0 | 0.0 | 0.0 |
| SE | 0.25 | 3.5 | 1.23 | 1.0 | 0.75 |
| IOP | 15.0 | 22.8 | 18.55 | 2.2 | 18.80 |
| Ksteep front | 42.6 | 45.4 | 43.89 | 0.9 | 43.70 |
| Kflat front | 40.9 | 44.3 | 42.36 | 1.0 | 42.20 |
| Axis | 68.2 | 117.5 | 89.57 | 11.1 | 87.20 |
| Ksteep back | -6.7 | -6.1 | -6.43 | 0.2 | -6.50 |
| Kflat back | -6.3 | -5.8 | -6.05 | 0.2 | -6.10 |
| Axis | 62.0 | 112.5 | 87.11 | 11.1 | 86.90 |
| ACA | 0.7 | 3.9 | 1.53 | 0.8 | 1.40 |
| PCA | -0.8 | -0.1 | -0.38 | 0.2 | -0.30 |
| TCA | 0.5 | 3.1 | 1.16 | 0.6 | 1.03 |
| Axis | 70.0 | 119.0 | 90.38 | 11.7 | 87.00 |
| Percentage (PCA/TCA) | 0.17 | 0.80 | 0.37 | 0.16 | 0.33 |
| Parameter | Minimum | Maximum | Mean | Std. Deviation | Median |
|---|---|---|---|---|---|
| VA | 0.0 | 0.2 | 0.02 | 0.0 | 0.00 |
| SE | -6.5 | -0.25 | -2.61 | 1.8 | -2.50 |
| IOP | 14.0 | 22.8 | 18.43 | 1.9 | 18.30 |
| Ksteep front | 40.4 | 48.6 | 44.06 | 1.6 | 44.00 |
| Kflat front | 38.9 | 47.1 | 42.54 | 1.5 | 42.50 |
| Axis | 70.0 | 110.1 | 90.03 | 8.5 | 89.70 |
| Ksteep back | -7.2 | -5.8 | -6.44 | 0.3 | -6.40 |
| Kflat back | -7.0 | -5.5 | -6.08 | 0.3 | -6.10 |
| Axis | 65.0 | 104.4 | 88.55 | 8.0 | 89.10 |
| ACA | 0.3 | 4.4 | 1.52 | 0.7 | 1.40 |
| PCA | -0.9 | -0.1 | -0.36 | 0.1 | -0.30 |
| TCA | 0.2 | 3.5 | 1.18 | 0.6 | 1.10 |
| Axis | 65.0 | 131.0 | 90.78 | 10.5 | 90.00 |
| Percentage (PCA/TCA) | 0.10 | 1.50 | 0.37 | 0.22 | 0.31 |
Figs. (1 and 2) show the visual insight for ACA, PCA, and TCA means and the percentage of the contribution of PCA to TCA means within study groups. The mean magnitude of PCA for all subjects who had WTR astigmatism was -0.36 ± 0.13 D, and in each 3 groups (Emmetropia, Hyperopia, and Myopia) was -0.35 ± 0.1 D, -0.38 ± 0.2 D, and -0.36 ± 0.1 D, respectively.
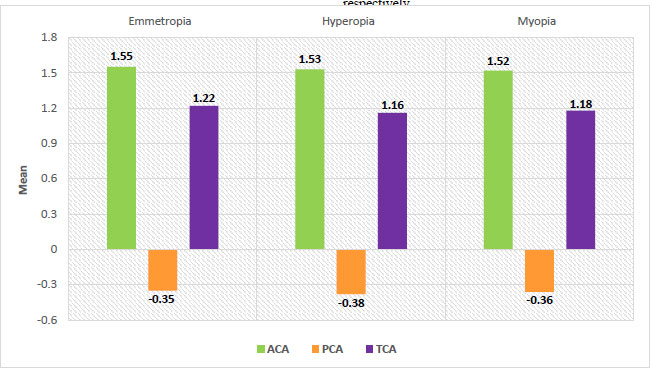
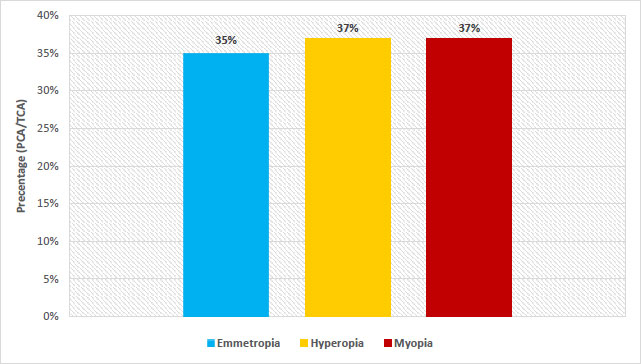
Around 37% contribution of PCA to TCA in 110 eyes of all 55 subjects that had WTR astigmatism, and in each 3 groups (Emmetropia, Hyperopia, and Myopia) was 35%, 37%, and 37%, respectively with P = 0.838 > 0.05, which was not statistically significantly. The distribution of percentage of contribution of PCA to TCA was not statistically significantly different between study groups (X2(2) = 0.353, P > 0.05) (Table 5).
In the 3 groups (Emmetropia, Hyperopia, and Myopia), there was highly statistically significant negative correlation between ACA and PCA (r = -0.996, P < 0.01), (r = -0.826, P < 0.01), (r = -0.768, P < 0.01), respectively, while highly statistically significant positive correlation between ACA and TCA (r = 1.000, P < 0.01), (r = 0.992, P < 0.01), (r = 0.991, P < 0.01) was found. In addition, there was a highly statistically significant negative correlation between PCA and TCA (r = -0.996, P < 0.01), (r = -0.750, P < 0.01), (r = -0.678, P < 0.01), respectively (Tables 6-8).
| Percentage (PCA/TCA) | Mean Rank | Kruskal-Wallis Test | ||
|---|---|---|---|---|
| X2(2) | df | P | ||
| Emmetropia | 57.63 | 0.353 | 2 | 0.838 |
| Hyperopia | 59.02 | |||
| Myopia | 54.53 | |||
| Parameter | Correlation Coefficient | ACA | PCA | TCA |
|---|---|---|---|---|
| ACA | r | 1 | - | - |
| P-value | - | - | - | |
| PCA | r | -0.996 | 1 | - |
| P-value | 0.004** | - | - | |
| TCA | r | 1.000 | -0.996 | 1 |
| P-value | 0.001** | 0.004** | - |
Table 7.
| Parameter | Correlation Coefficient | ACA | PCA | TCA |
|---|---|---|---|---|
| ACA | r | 1 | - | - |
| P-value | - | - | - | |
| PCA | r | -0.826 | 1 | - |
| P-value | 0.001** | - | - | |
| TCA | r | 0.992 | -0.750 | 1 |
| P-value | 0.001** | 0.001** | - |
| Parameter | Correlation Coefficient | ACA | PCA | TCA |
|---|---|---|---|---|
| ACA | r | 1 | - | - |
| P-value | - | - | - | |
| PCA | r | -0.768 | 1 | - |
| P-value | 0.001** | - | - | |
| TCA | r | 0.991 | -0.678 | 1 |
| P-value | 0.001** | 0.001** | - |
4. DISCUSSION
Most human eyes display a slight degree of CA, and it can emerge from both surfaces of the cornea [1]. Scheimpflug imaging is one of the modern machines that permits direct measurement of the posterior corneal surface [38]. The goal of modern refractive cataract surgery is not just to correct spherical errors but to correct astigmatism, too. IOL implantation is a beneficial procedure to correct astigmatism at the time of cataract surgery [39]. Proper screening before surgery is one of the most important elements for the success of refractive surgery that would decrease the unpleasant outcomes and patient dissatisfaction [1].
PCA is valuable for better predictability of toricity in toric IOL power calculations, and the magnitude of PCA was assumed negligible because of the smaller variation in the refractive index between the cornea and the aqueous [38-40]. Giacomo Savini et al. reported that PCA exerts the highest impact on the error in refractive astigmatism (ERA) after toric IOL implantation; calculations based on TCA rather than keratometric astigmatism enhance the prediction of residual refractive astigmatism [41]. Also, Olga Reitblat et al. declared that residual astigmatism after toric IOL implantation can be decreased by suitable consideration of PCA [32]. Moreover, the fixation degree of the IOL may contribute to TA [42]. J Kozaki et al. assumed that the fixation degree of the toric IOL implanted in the bag does not induce a critical astigmatic error, while Nino Hirnschall et al. appraised that the primary source of error in toric IOL power calculation is the preoperative corneal measurement followed by IOL misalignment and tilt [42, 43].
In our study, the mean magnitude of PCA for all subjects who had WTR astigmatism was -0.36 ± 0.13 D, and in every 3 groups (Emmetropia, Hyperopia, and Myopia) was -0.35 ± 0.1 D, -0.38 ± 0.2 D, and -0.36 ± 0.1 D, respectively. About 37% of the contribution of PCA to TCA in 110 eyes of all 55 subjects that had WTR astigmatism, and in every 3 groups (Emmetropia, Hyperopia, and Myopia) was 35%, 37% and 37%, respectively, with P = 0.838 > 0.05, which was not statistically significantly. There was a correlation between ACA, PCA, and TCA in each group.
The results of many studies support ours.An American study by Douglas D Koch et al. and a Brazilian study by Ventura et al., who used Scheimpflug imaging using Galilei Dual Scheimpflug Analyser evaluated the mean magnitude of PCA as follows: 715 eyes of 435 participants were -0.30 ± 0.15 D, and 3,253 eyes of 1,919 participants (745 males and 1,174 female) were 0.34 ± 0.15 D, respectively. Also, Egyptian studies by Hany Ahmed Helaly and Mohamed Hosny et al., who used Scheimpflug imaging using Pentacam, found the mean magnitude of PCA as follows: 100 eyes of 100 participants (46 males and 54 female) were 0.42 ± 0.20 D, and 356 eyes of 356 participants were 0.418 ± 0.2296 D, respectively. All of them proved that TCA measured from both the anterior and posterior surfaces, and ignoring PCA may produce an incorrect estimation of TCA because it can induce errors during the calculation and correction of astigmatism; thus, selecting toric IOL based on anterior corneal measurements could lead to overcorrection in eyes with WTR astigmatism and under correction in eyes with ATR astigmatism [4, 38, 40, 44, 45].
On the other hand, the three studies' results were inconsistent with our study. American study by Prisant et al. found the mean magnitude of PCA for 40 eyes of 31 participants was 0.66 ± 0.23 D, German study by Modis et al. found that the mean magnitude for 88 eyes of 44 participants (24 males and 20 females) in right and left eyes was -0.78 ± 0.61 D, and -0.75 ± 0.45 D, respectively, and Australian study by LaHood and Goggin found that the mean magnitude for for 1,098 eyes of 1,098 participants was 0.24 ± 0.15 D [46-48]. The reason for the difference could be due to different instrument utilization to evaluate PCA by Slit-scanning elevation topography using Orbscan and IOLMaster 700.
The reason for the variability of results in many studies was due to patient age range, selection, varied refractive error classifications, methodologies, types of studies and several analyses modalities by researchers [44].
We found the percentage of contribution of PCA to TCA for all participants and the distribution of the percentage between study groups with P > 0.05, which was not statistically significant and could be explained by the small sample size. Meanwhile, about 30% of the contribution of PCA to TCA for 356 eyes of 356 participants, 33% for 314 eyes with WTR astigmatism, and 8% for 42 eyes with ATR astigmatism with P < 0.001, which was statistically significant, as revealed by Egyptian study by Mohamed Hosny et al. [40].
Many studies confirmed that there was a correlation between ACA, PCA, and TCA, as we found in all study groups. An American study by Douglas D Koch et al. showed that in 364 eyes of 435 participants, there was a statistically significant positive correlation between the magnitude of CA on both corneal surfaces when the anterior meridian was vertically steep (r = 0.56, P < 0.001). Also they inferred that the magnitude of the anterior corneal WTR astigmatism had a direct correlation with the magnitude of PCA [4]. Also, an Egyptian study by Hany Ahmed Helaly revealed that in 100 eyes of 100 participants (46 males and 54 female), there was a good correlation between ACA and PCA, and in cases of anterior corneal WTR and ATR astigmatism (r2 = 0.731, P < 0.001), (r2 = 0.750, P < 0.001), and (r2 = 0.746, P < 0.001), respectively [38]. Moreover, a Japanese study by Miyake et al. showed that in 608 eyes of 608 participants (275 males and 333 females) there was a significant correlation between ACA and PCA magnitude (r = 0.4739, P < 0.001), in 402 eyes with anterior corneal WTR astigmatism (r = 0.5746, P < 0.001) [49]. Furthermore, an Iranian study by Sepehr Feizi et al. exhibited that in 153 eyes of 153 participants (65 males and 88 females) there was a statistically significant positive correlation of ACA with PCA and TCA (r = 0.630, p < 0.001), and (r = 0.861, p < 0.001), respectively, also between PCA and TCA (r = 0.715, p < 0.001) [50]. In addition, a Brazilian study by Ventura et al. confirmed that in 2,423 eyes of 1,919 participants, there was a statistically significant strong correlation between ACA and PCA when the anterior meridian was vertically steep (r = 0.720, P < 0.001) [45].
5. STRENGTH AND LIMITATIONS
To our knowledge, our study is the first one in the Kingdom of Saudi Arabia, Riyadh, that determines the contribution of PCA to TCA as a percentage and evaluates the correlation between ACA, PCA, and TCA. The present study has two limitations. The sample size is quite small because it was performed during the coronavirus pandemic. Also, the participants were young females.
CONCLUSION
According to current studies, studying the contribution of PCA is relatively significant, and it cannot be ignored during the calculation of TCA and toric IOL power, which will cause errors in astigmatism correction. Moreover, many studies found a correlation between ACA, PCA, and TCA. Future prospective studies to re-evaluate the results with a larger sample size, different age groups, including males, and different racial populations are recommended.
AUTHORS’ CONTRIBUTIONS
Conceptualization, methodology, formal analysis, data curation, F.RM & S. A; writing-original draft preparation, writing-review and editing, F. RM. All authors read and agreed to the published version of the manuscript.
LIST OF ABBREVIATIONS
| IOL | Intraocular lens |
| PCA | Posterior corneal astigmatism |
| TCA | Total corneal astigmatism |
| ACA | Anterior corneal astigmatism |
| SE | Spherical equivalent |
| WTR | With the rule |
| LA | Lenticular astigmatism |
| KC | Keratoconus |
| CS | Contrast sensitivity |
| AS-OCT | Anterior segment optical coherence tomography |
| PRK | Photorefractive keratectomy |
| ATR | Against the rule |
| RGP | Rigid gas permeable |
| LogMAR | Logarithmic minimum angle of resolution |
| SPAA | Statistical Package for Social Sciences |
ETHICS APPROVAL AND CONSENT TO PARTICIPATE
The study was approved by the Institutional Review Board of Health Sciences Colleges’ Research on Human Subjects, College of Medicine, King Saud University.
HUMAN AND ANIMAL RIGHTS
No animals were used that are the basis of this study. All the human procedures were conducted according to the guidelines of the Declaration of Helsinki.
CONSENT FOR PUBLICATION
Informed consent was obtained from all participants of this study.
AVAILABILITY OF DATA AND MATERIALS
The datasets used and analyzed during the current study are available from the corresponding author [R.F] upon reasonable request.
STANDARDS OF REPORTING
STROBE guidelines were followed.
FUNDING
This research project was supported by a grant from the Research Center of the Centre for Female Scientific and Medical Colleges Deanship of Scientific Research, King Saud University.
CONFLICT OF INTEREST
The authors declare no conflict of interest, financial or otherwise.
ACKNOWLEDGEMENTS
Declared none.

